Volume 43 Issue 3
Jul.  2019
Article Contents

Citation:

Prognostic value of 18F-FDG PET/CT metabolic parameters in patients with diffuse large B-cell lymphoma of stage Ⅱ~Ⅲ disease

  • Corresponding author: Tiannyu Li, litiannv@126.com
  • Received Date: 2018-05-07
  • Objective To investigate the prognostic value of the maximum standardized uptake value(SUVmax), metabolic tumor volume(MTV) and total lesion glycolysis(TLG) calculated from pretreatment 18F-FDG PET/CT results in patients with diffuse large B-cell lymphoma of stage Ⅱ~Ⅲ disease. Methods A total of 85 patients with DLBCL of stageⅡ~Ⅲ disease were enrolled from June 2009 to December 2015, and the clinic data and pretreatment 18F-FDG PET/CT data were retrospectively analyzed. MTV and TLG of tumor tissue were calculated from PET/CT images with the threshold value of 41% of the SUVmax. The optimal cutoff point of progression-free survival(PFS) of SUVmax, MTV and TLG were investigated by using receiver operating characteristic(ROC) curve analysis. The Kaplan-Meier method and Log-rank test were respectively used for survival analysis and univariate analysis, and COX proportional hazards model for multivariate analysis. Results The SUVmax, MTV and TLG of 85 patients were 23.9(16.3), 25.1(95.3) cm3, 424.4(1404.6), respectively. ROC curve showed that the area under the curce(AUC) of SUVmax, MTV and TLG were 0.610, 0.729 and 0.726(95% CI: 0.483–0.736, P=0.109; 0.621–-0.838, P=0.001; 0.621–0.831, P=0.001), respectively. The median SUVmax(23.9) was used as the cutoff points due to smaller AUC of SUVmax. The cutoff point of MTV was 39.1 cm3(sensitivity=73.1% and specificity=69.5%), and the cutoff point of TLG was 404.5(sensitivity=80.8% and specificity= 61.0%). Univariate analysis showed that Ann Arbor stage, β-2 MG, lactate dehydrogenase(LDH) level, bulky disease, international prognostic index(IPI), SUVmax, MTV and TLG were relative factors affecting PFS(χ2=19.118, P=0.000; χ2=12.310, P=0.000; χ2=4.861, P=0.027; χ2=7.731, P=0.013; χ2=19.693, P=0.000; χ2=6.414, P=0.011; χ2=14.538, P=0.000; χ2=13.089, P=0.000), and Ann Arbor stage, β-2 MG, bulky disease, IPI, MTV and TLG were relative factors affecting overall survival(OS)(χ2=14.550, P=0.000; χ2=5.473, P=0.019; χ2=5.643, P=0.018; χ2=15.943, P=0.000; χ2=13.877, P=0.000; χ2=12.677, P=0.000). As MTV and TLG measures correlated strongly, only TLG measures were used for multivariate analysis. LDH level and TLG were statistically significant predictors of PFS(RR=4.891, 95%CI=1.332–11.955, P=0.017; RR=0.195, 95%CI=0.058–0.660, P=0.009), and IPI and TLG were statistically significant predictors of OS on multivariate analysis(RR=0.508, 95%CI=0.270–0.956, P=0.036; RR=0.433, 95%CI=0.227–0.826, P=0.011). Conclusions TLG in pretreatment 18F-FDG PET/CT is an independent prognostic factor for predicting progression-free survival and overall survival time in patients with DLBCL of stageⅡ-Ⅲ disease. TLG may be more useful than SUVmax for prognosisand has certainly reference value.
  • 加载中
  • [1] Farooq U, Maurer MJ, Thompson CA, et al. Clinical heterogeneity of diffuse large B cell lymphoma following failure of front-line immunochemotherapy[J]. Br J Haematol, 2017, 179(1): 50−60. DOI: 10.1111/bjh.14813.
    [2] 胡娜, 吴永港, 肖立志, 等. 18F-FDG PET/CT代谢活性参数及其在淋巴瘤中的应用[J]. 国际放射医学核医学杂志, 2015, 39(4): 342−347. DOI: 10.3760/cma.j.issn.1673−4114.2015.04.015.Hu N, Wu YG, Xiao LZ, et al. Metabolic parameters of 18F-FDG PET/CT and their application in lymphoma[J]. Int J Radiat Med Nucl Med, 2015, 39(4): 342−347. DOI: 10.3760/cma.j.issn.1673−4114.2015.04.015.
    [3] 李亚明, 赵晋华. 淋巴瘤PET/CT诊断学[M]. 北京: 人民卫生出版社, 2017.Li Y M, Zhao J H. PET/CT imaging of lymphoma[M]. Beijing: People's Medical Publishing House, 2017.
    [4] 梁颖, 吴宁, 方艳, 等. 18F-FDG PET/CT显像SUVmax、MTV和TLG判断弥漫性大B细胞淋巴瘤的预后价值[J]. 中华核医学与分子影像杂志, 2015, 35(2): 97−101. DOI: 10.3760/cma.j.issn.2095−2848.2015.02.005.Liang Y, Wu N, Fang Y, et al. Prognostic significance of SUVmax, MTV and TLG on 18F-FDG PET/CT imaging in patients with diffuse large B-cell lymphoma[J]. Chin J Nucl Med Mol Imaging, 2015, 35(2): 97−101. DOI: 10.3760/cma.j.issn.2095−2848.2015.02.005.
    [5] Okuyucu K, Ozaydın S, Alagoz E, et al. Prognosis estimation under the light of metabolic tumor parameters on initial FDG-PET/CT in patients with primary extranodal lymphoma[J]. Radiol Oncol, 2016, 50(4): 360−369. DOI: 10.1515/raon−2016−0045.
    [6] Mikhaeel NG, Smith D, Dunn JT, et al. Combination of baseline metabolic tumour volume and early response on PET/CT improves progression-free survival prediction in DLBCL[J]. Eur J Nucl Med Mol Imaging, 2016, 43(7): 1209−1219. DOI: 10.1007/s00259−016−3315−7.
    [7] 丁重阳, 郭喆, 吴宇霖, 等. 18F-FDG PET/CT在局限期小细胞肺癌预后评估中的价值[J]. 中华核医学与分子影像杂志, 2017, 37(11): 694−699. DOI: 10.3760/cma.j.issn.2095−2848.2017.11.005.Ding CY, Guo Z, Wu YS, et al. Prognostic value of 18F-FDG PET/CT in patients with limited-stage small cell lung cancer[J]. Chin J Nucl Med Mol Imaging, 2017, 37(11): 694−699. DOI: 10.3760/cma.j.issn.2095−2848.2017.11.005.
    [8] Gallicchio R, Mansueto G, Simeon V, et al. F-18 FDG PET/CT quantization parameters as predictors of outcome in patients with diffuse large B-cell lymphoma[J]. Eur J Haematol, 2014, 92(5): 382−389. DOI: 10.1111/ejh.12268.
    [9] 张玥伟, 范洋, 杨志, 等. 化疗早期及中期18F-FDG PET/CT显像对56例弥漫大B细胞淋巴瘤患者预后的评估价值[J]. 中华血液学杂志, 2015, 36(10): 824−829. DOI: 10.3760/cma.j.issn.0253−2727.2015.10.004.Zhang YW, Fan Y, Yang Z, et al. The prognosis value of early and interim 18F-FDG-PET/CT scans in patients with diffuse large B-cell lymphoma[J]. Chin J Hematol, 2015, 36(10): 824−829. DOI: 10.3760/cma.j.issn.0253−2727.2015.10.004.
    [10] Song MK, Yang DH, Lee GW, et al. High total metabolic tumor volume in PET/CT predicts worse prognosis in diffuse large B cell lymphoma patients with bone marrow involvement in rituximab era[J]. Leuk Res, 2016, 42(1): 1−6. DOI: 10.1016/j.leukres.2016.01.010.
    [11] Ceriani L, Martelli M, Conconi A, et al. Prognostic models for primary mediastinal (thymic) B-cell lymphoma derived from 18-FDG PET/CT quantitative parameters in the International Extranodal Lymphoma Study Group (IELSG) 26 study[J]. Br J Haematol, 2017, 178(4): 588−591. DOI: 10.1111/bjh.14728.
    [12] Zhou M, Chen Y, Huang H, et al. Prognostic value of total lesion glycolysis of baseline 18F-fluorodeoxyglucose positron emission tomography/computed tomography in diffuse large B-cell lymphoma[J]. Oncotarget, 2016, 7(50): 83544−83553. DOI: 10.18632/oncotarget.13180.
    [13] Adams HJ, de Klerk JM, Fijnheer R, et al. Prognostic superiority of the National Comprehensive Cancer Network International Prognostic Index over pretreatment whole-body volumetric-metabolic FDG-PET/CT metrics in diffuse large B-cell lymphoma[J]. Eur J Haematol, 2015, 94(6): 532−539. DOI: 10.1111/ejh.12467.
    [14] Lovinfosse P, Janvary ZL, Coucke P, et al. FDG PET/CT texture analysis for predicting the outcome of lung cancer treated by stereotactic body radiation therapy[J]. Eur J Nucl Med Mol Imaging, 2016, 43(8): 1453−1460. DOI: 10.1007/s00259−016−3314−8.
  • 加载中
通讯作者: 陈斌, bchen63@163.com
  • 1. 

    沈阳化工大学材料科学与工程学院 沈阳 110142

  1. 本站搜索
  2. 百度学术搜索
  3. 万方数据库搜索
  4. CNKI搜索

Figures(3) / Tables(3)

Article Metrics

Article views(22618) PDF downloads(95) Cited by()

Related
Proportional views

Prognostic value of 18F-FDG PET/CT metabolic parameters in patients with diffuse large B-cell lymphoma of stage Ⅱ~Ⅲ disease

    Corresponding author: Tiannyu Li, litiannv@126.com
  • 1. Department of Nuclear Medicine, the First Affiliated Hospital of Nanjing Medical University, Nanjing 210029, China
  • 2. Department of CT/MRI, Suzhou First People’s Hospital, Suzhou 234000, China

Abstract:  Objective To investigate the prognostic value of the maximum standardized uptake value(SUVmax), metabolic tumor volume(MTV) and total lesion glycolysis(TLG) calculated from pretreatment 18F-FDG PET/CT results in patients with diffuse large B-cell lymphoma of stage Ⅱ~Ⅲ disease. Methods A total of 85 patients with DLBCL of stageⅡ~Ⅲ disease were enrolled from June 2009 to December 2015, and the clinic data and pretreatment 18F-FDG PET/CT data were retrospectively analyzed. MTV and TLG of tumor tissue were calculated from PET/CT images with the threshold value of 41% of the SUVmax. The optimal cutoff point of progression-free survival(PFS) of SUVmax, MTV and TLG were investigated by using receiver operating characteristic(ROC) curve analysis. The Kaplan-Meier method and Log-rank test were respectively used for survival analysis and univariate analysis, and COX proportional hazards model for multivariate analysis. Results The SUVmax, MTV and TLG of 85 patients were 23.9(16.3), 25.1(95.3) cm3, 424.4(1404.6), respectively. ROC curve showed that the area under the curce(AUC) of SUVmax, MTV and TLG were 0.610, 0.729 and 0.726(95% CI: 0.483–0.736, P=0.109; 0.621–-0.838, P=0.001; 0.621–0.831, P=0.001), respectively. The median SUVmax(23.9) was used as the cutoff points due to smaller AUC of SUVmax. The cutoff point of MTV was 39.1 cm3(sensitivity=73.1% and specificity=69.5%), and the cutoff point of TLG was 404.5(sensitivity=80.8% and specificity= 61.0%). Univariate analysis showed that Ann Arbor stage, β-2 MG, lactate dehydrogenase(LDH) level, bulky disease, international prognostic index(IPI), SUVmax, MTV and TLG were relative factors affecting PFS(χ2=19.118, P=0.000; χ2=12.310, P=0.000; χ2=4.861, P=0.027; χ2=7.731, P=0.013; χ2=19.693, P=0.000; χ2=6.414, P=0.011; χ2=14.538, P=0.000; χ2=13.089, P=0.000), and Ann Arbor stage, β-2 MG, bulky disease, IPI, MTV and TLG were relative factors affecting overall survival(OS)(χ2=14.550, P=0.000; χ2=5.473, P=0.019; χ2=5.643, P=0.018; χ2=15.943, P=0.000; χ2=13.877, P=0.000; χ2=12.677, P=0.000). As MTV and TLG measures correlated strongly, only TLG measures were used for multivariate analysis. LDH level and TLG were statistically significant predictors of PFS(RR=4.891, 95%CI=1.332–11.955, P=0.017; RR=0.195, 95%CI=0.058–0.660, P=0.009), and IPI and TLG were statistically significant predictors of OS on multivariate analysis(RR=0.508, 95%CI=0.270–0.956, P=0.036; RR=0.433, 95%CI=0.227–0.826, P=0.011). Conclusions TLG in pretreatment 18F-FDG PET/CT is an independent prognostic factor for predicting progression-free survival and overall survival time in patients with DLBCL of stageⅡ-Ⅲ disease. TLG may be more useful than SUVmax for prognosisand has certainly reference value.

    HTML

  • 弥漫大B细胞淋巴瘤(diffuse large B-cell lymphoma, DLBCL)是非霍奇金淋巴瘤(non-Hodgkin lymphoma,NHL)中最常见的病理类型,约占成人NHL的1/3[1]18F-FDG PET/CT作为一种新型分子影像技术,在淋巴瘤尤其是DLBCL疗效评价及预后判断中具有重要的价值[2]。但是既往大部分研究中包含了Ⅰ~Ⅳ期的DLBCL患者,而Ⅰ期患者的预后本身就好于Ⅳ期的患者。因此,本研究回顾性分析85例Ⅱ~Ⅲ期DLBCL患者的临床资料和18F-FDG PET/CT显像资料,旨在探讨治疗前18F-FDG PET/CT显像中PET代谢参数的预后价值。

1.   资料与方法

    1.1.   一般资料

  • 收集2009年6月至2015年12月在南京医科大学第一附属医院诊治且行18F-FDG PET/CT检查的85例Ⅱ~Ⅲ期DLBCL患者,其中男性35例、女性50例,中位年龄55(20~78)岁。入组标准:①年龄≥18岁;②病理确诊为DLBCL,Ann Arbor分期[3]为Ⅱ期或Ⅲ期;③PET/CT检查前未接受任何抗肿瘤治疗;④化疗前PET/CT检查可见淋巴瘤阳性病灶;⑤化疗方案为利妥昔单抗+环磷酰胺+阿霉素+长春新碱+泼尼松(R-CHOP);⑥病历资料完整;⑦无其他恶性肿瘤病史。排除标准:①伴有活动性感染或不可控制的慢性感染;②伴有严重的心、脑血管疾病,如难治性心功能不全等。所有患者于PET/CT检查前均签署了知情同意书。

  • 1.2.   PET/CT检查方法

  • 采用德国西门子公司生产的Biograph 16 HR PET/CT扫描仪,18F-FDG由美国GE公司生产的PET trace型回旋加速器生产并通过自动化合成模块自动合成,放射化学纯度>95%。检查前所有患者至少空腹6 h,并控制空腹血糖≤7.0 mmol/L,经静脉注射18F-FDG 3.70~5.55 MBq/kg后安静休息40~60 min,排尿后行PET/CT扫描。先行CT扫描,扫描参数:管电压120 kV,管电流140 mA,层厚3.75 mm,准直1.5 mm。再行PET数据采集:采用三维模式采集6~7个床位,每个床位采集2~3 min。应用CT数据进行衰减校正,迭代法重建获得融合图像。

  • 1.3.   图像分析

  • 通过PET/CT数据处理工作站,采用麦迪克斯软件对数据进行处理。采用相对阈值法,参照文献[45]并结合本研究,将SUVmax大于1.5倍肝脏平均标准化摄取值(mean standardized uptake value, SUVmean)+2倍肝脏SUVmean标准差的病灶设为可测量病灶,将上述病灶包括在容积感兴趣区内(volume of interest, VOI),以SUVmax的41%作为阈值,由软件自动进行容积分割,得出病灶的SUVmax、代谢体积(metabolic tumor volume, MTV)及病灶糖酵解总量(total lesion glycolysis, TLG)。

  • 1.4.   随访

  • 采用门诊进行随访,随访时间为2009年6月1日至2018年1月1日,无患者失访。无进展生存期(progression-free survival, PFS)为疾病诊断至第一次出现疾病复发、进展、疾病所致死亡或随访截止时间。总生存期(overall survival, OS)为疾病诊断至疾病所致死亡或随访截止时间。

  • 1.5.   统计学方法

  • 应用SPSS 17.0软件进行统计学分析。符合偏态分布的计量资料以中位数(四分位间距)表示,采用受试者工作特征(receiver operating characteristic , ROC)曲线获得SUVmax、MTV及TLG的最佳界值点,并计算曲线下面积(area under the curve, AUC);如果AUC较小,则以中位数进行分组。采用Kaplan-Meier法进行生存分析,单因素分析采用Log-rank 检验,多因素分析采用Cox比例风险模型。P<0.05为差异有统计学意义。

2.   结果

    2.1.   患者生存情况

  • 经过中位随访46(24~102)个月,85例患者中,26例患者复发或进展,中位PFS为31.0(2.5~99.7)个月,1年、3年无进展生存率分别为83.5%、40%;15例患者死亡,中位OS为34.8(2.0~99.7)个月,1年、3年总生存率分别为91.8%、48.2%。

  • 2.2.   PET代谢参数判断预后的界值点

  • 85例患者的SUVmax、MTV、TLG的中位数分别为23.9(16.3)、25.1(95.3)cm3、424.4(1404.6)。以复发或进展作为阳性事件,ROC曲线分析结果显示:SUVmax的AUC=0.610(95%CI=0.483~0.736,P=0.109),MTV 的AUC=0.729(95%CI=0.621~0.838,P=0.001),TLG 的AUC=0.726(95%CI=0.621~0.831,P=0.001)。由于SUVmax的AUC较小,不能通过ROC曲线分析获得界值点,因此,以SUVmax的中位数23.9作为界值点进行分组。MTV的界值点为39.1 cm3(灵敏度为73.1%,特异度为69.5%);TLG的界值点为404.5(灵敏度为80.8%,特异度为61.0%)。

  • 2.3.   Ⅱ~Ⅲ期DLBCL患者预后单因素分析结果

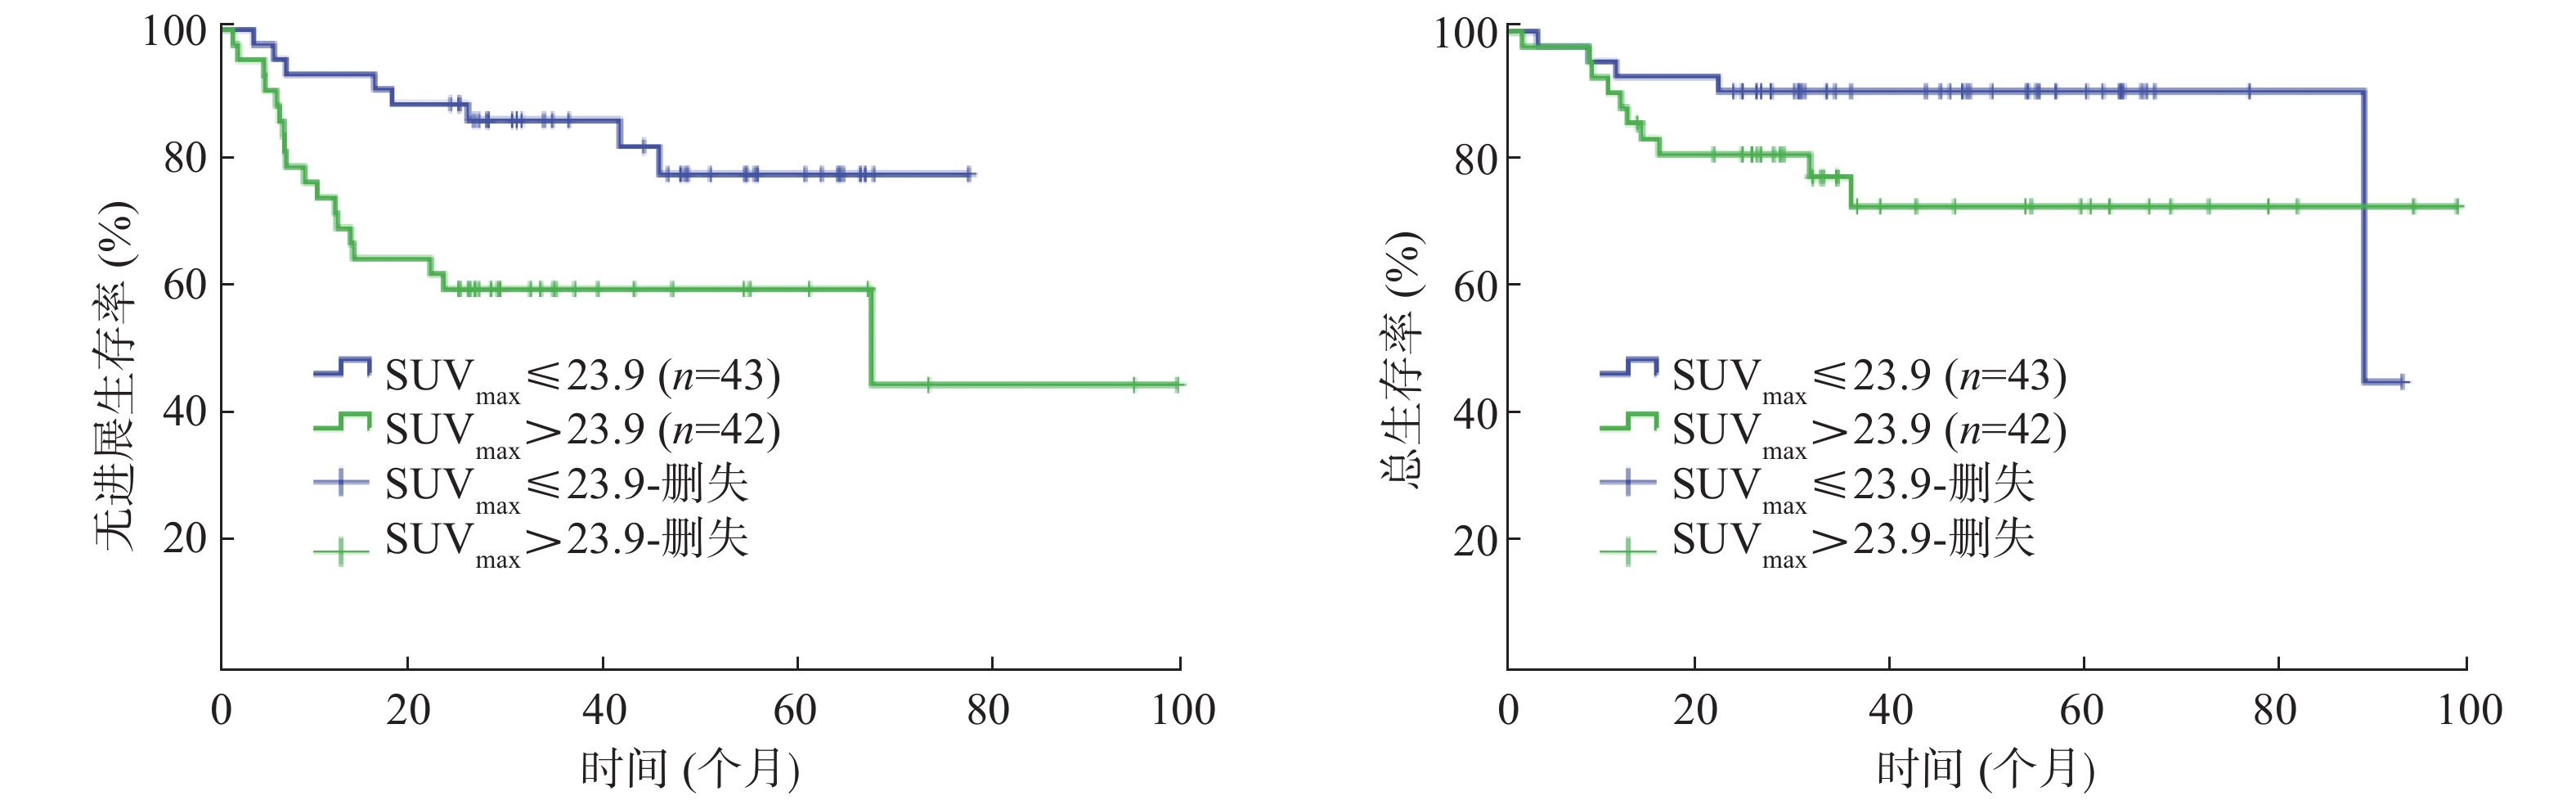
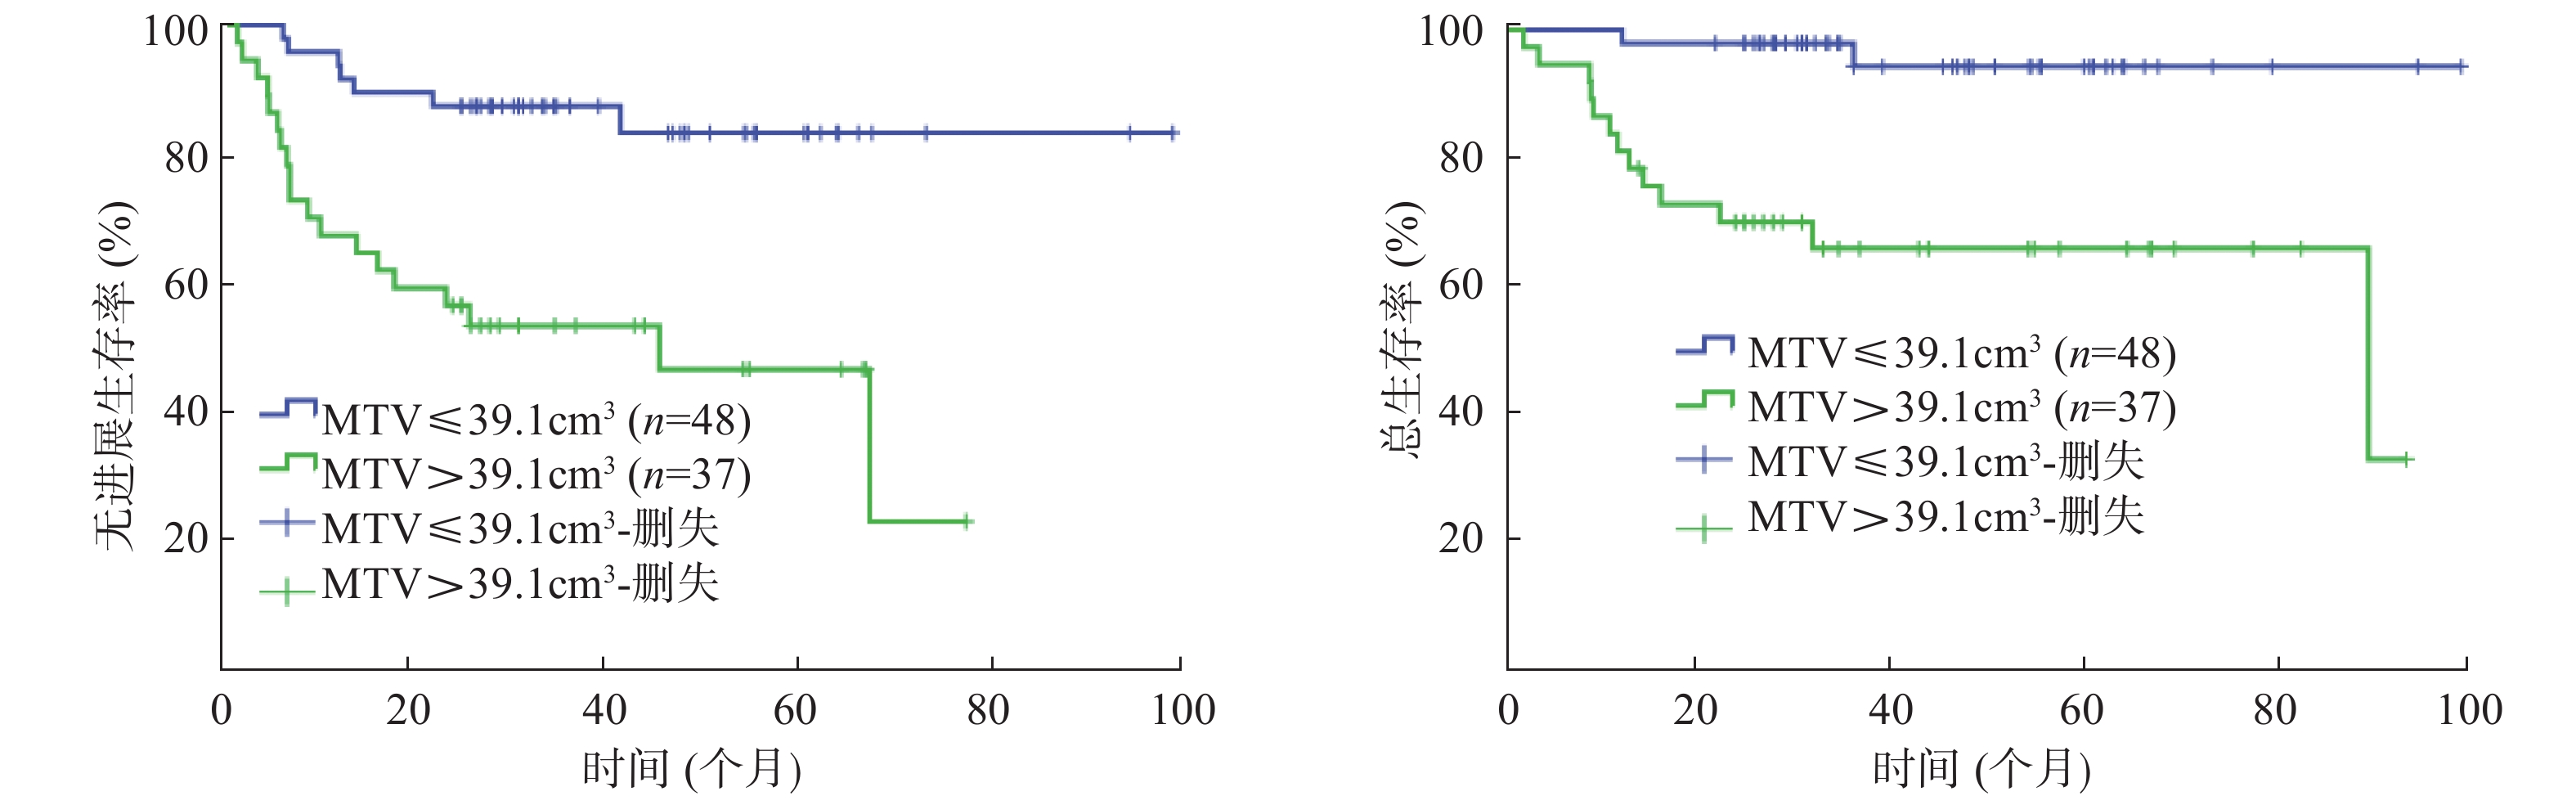
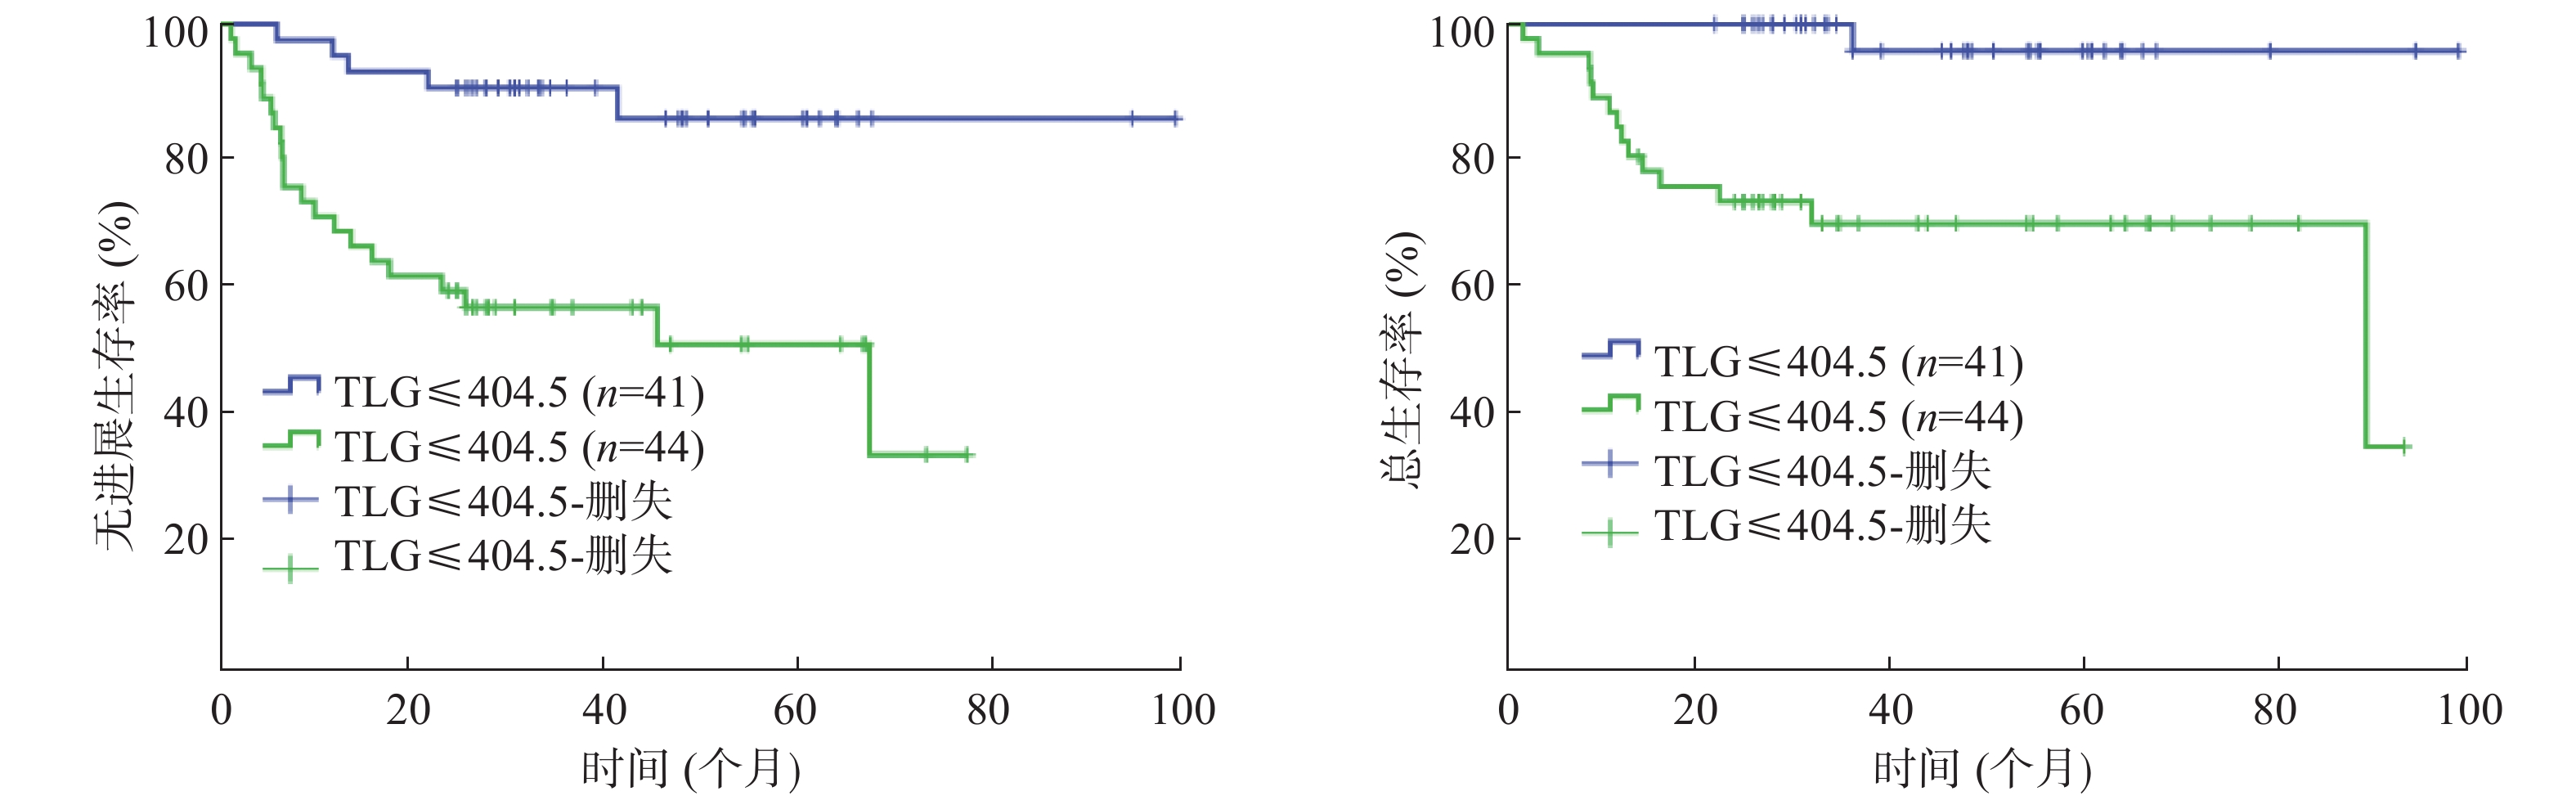
  • 单因素分析结果显示:Ann Arbor分期、β-2微球蛋白、乳酸脱氢酶(lactate dehydrogenase, LDH)、大肿块、国际预后指数(international prognosis index, IPI)、SUVmax、MTV、TLG均是Ⅱ~Ⅲ期DLBCL患者PFS的影响因素(χ2=19.118、12.310、4.861、7.731、19.693、6.414、14.538、13.089,均P<0.05);Ann Arbor分期、β-2微球蛋白、大肿块、IPI、MTV、TLG 是患者 OS 的影响因素(χ2=14.550、5.473、5.643、15.943、13.877、12.677,均P<0.05)(表1图1~3)。

    因素例数中位无进
    展生存
    期(个月)
    χ2值,P中位总
    生存期
    (个月)
    χ2值,P因素例数中位无进
    展生存
    期(个月)
    χ2值,P中位总
    生存期
    (个月)
    χ2值,P
    性别乳酸脱氢酶
     男3531.0χ2=0.734,33.5χ2=0.539, 正常5432.4χ2=4.861,34.8χ2=2.150,
     女5028.0P=0.39239.4P=0.463 升高3126.0P=0.02733.2P=0.147
    年龄大肿块
     ≤60岁5332.8χ2=1.656,35.0χ2=1.759, 无6433.8χ2=7.731,37.0χ2=5.643,
     >60岁3225.5P=0.19830.5P=0.185 有2125.0P=0.01326.0P=0.018
    B症状国际预后指数
     无6731.0χ2=2.557,34.8χ2=0.074, 低危组(0~1分)4636.4χ2=19.693,43.2χ2=15.943,
     有1828.0P=0.10833.2P=0.786 中高危组(2~4分)3924.1P=0.00028.0P=0.000
    ECOG评分SUVmax
     0~1分7631.0χ2=0.899,35.0χ2=0.383, ≤23.94336.4χ2=6.414,39.4χ2=2.158,
     2~3分 924.1P=0.34328.0P=0.536 >23.94226.0P=0.01129.0P=0.142
    Ann Arbor分期MTV(cm3
     Ⅱ期4534.8χ2=19.118,39.4χ2=14.550, ≤39.14834.7χ2=14.53843.7χ2=13.877,
     Ⅲ期4025.0P=0.00028.0P=0.000 >39.13725.0P=0.00028.0P=0.000
    病理亚型TLG
     生发中心3933.8χ2=1.650,37.0χ2=0.099, ≤404.54136.4χ2=13.089,45.7χ2=12.677,
     非生发中心4630.5P=0.19931.0P=0.735 >404.54425.9P=0.00029.0P=0.000
    β-2微球蛋白
     正常6833.8χ2=12.310,36.4χ2=5.473,
     升高1722.0P=0.00025.0P=0.019
    注:表中,DLBCL:弥漫大B细胞淋巴瘤;ECOG:美国东部肿瘤协作组;SUVmax:最大标准化摄取值;MTV:代谢体积;TLG:病灶糖酵解总量。

    Table 1.  Univariate analysis for survivals of 85 patients with diffuse large B cell lymphoma of stage Ⅱ~Ⅲ disease

    Figure 1.  Kaplan-Meier curves for progression-free survival(A) and overall survival(B) of patients 85 patients with diffuse large B cell lymphoma of stage Ⅱ~Ⅲ disease by SUVmax

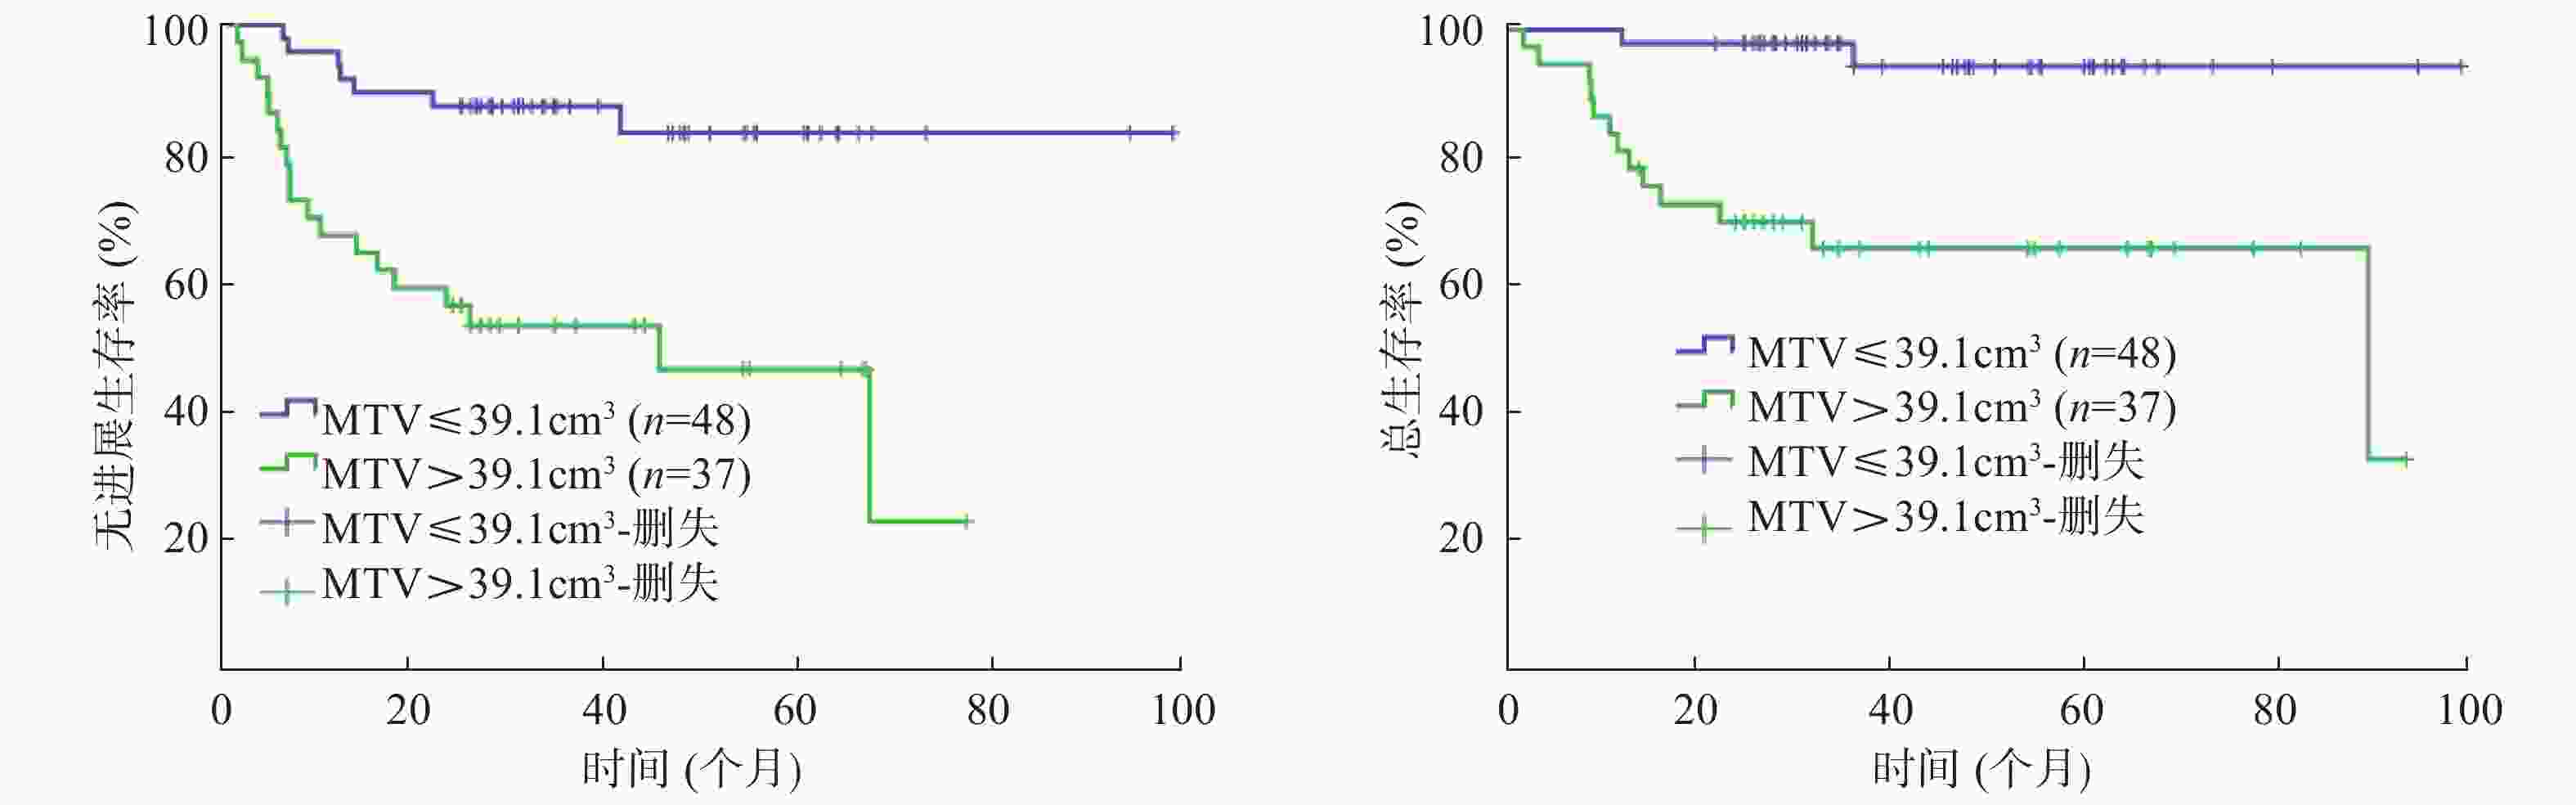
    Figure 2.  Kaplan-Meier curves for progression-free survival(A) and overall survival(B) of patients 85 patients with diffuse large B cell lymphoma of stage Ⅱ~Ⅲ disease by MTV

    Figure 3.  Kaplan-Meier curves for progression-free survival(A) and overall survival(B) of patients 85 patients with diffuse large B cell lymphoma of stage Ⅱ~Ⅲ disease by TLG

  • 2.4.   Ⅱ~Ⅲ期DLBCL患者预后多因素分析结果

  • 由于MTV与TLG呈高度相关,参照文献[6]并结合本研究,多因素分析时,二者中仅纳入了TLG,结果显示:LDH、TLG是影响Ⅱ~Ⅲ期DLBCL患者PFS的独立危险因素(RR=4.891, 95%CI=1.332~11.955,P=0.017;RR=0.195, 95%CI=0.058~0.660,P=0.009)(表2),IPI、TLG是影响患者OS的独立危险因素(RR=0.508, 95%CI=0.270~0.956,P=0.036;RR=0.433, 95%CI=0.227~0.826,P=0.011)(表3)。

    因素βWaldRR95%CIP
    Ann Arbor分期−1.2303.2470.2920.077~1.1140.072
    β-2微球蛋白−0.6962.8160.4990.221~1.1240.093
    LDH1.5875.7234.8911.332~11.9550.017
    大肿块−0.8183.2880.4410.182~1.0680.070
    IPI−1.2322.3700.2920.061~1.4000.124
    SUVmax−0.7462.1680.4740.176~1.2800.141
    TLG−1.6356.8980.1950.058~0.6600.009
    注:表中,DLBCL:弥漫大B细胞淋巴瘤;PFS:无进展生存期;LDH:乳酸脱氢酶;IPI:国际预后指数;SUVmax:最大标准化摄取值;TLG:病灶糖酵解总量。

    Table 2.  Multivariate analysis for progression-free survival of 85 patients with diffuse large B cell lymphoma of stage Ⅱ~Ⅲ disease

    因素βWaldRR95%CIP
    Ann Arbor分期0.0730.0631.0760.610~1.8970.801
    β-2微球蛋白−0.1150.1430.8920.492~1.6160.706
    大肿块0.2950.8681.3430.722~2.4990.351
    IPI−0.6784.4060.5080.270~0.9560.036
    TLG−0.8376.4430.4330.227~0.8260.011
    注:表中,DLBCL:弥漫大B细胞淋巴瘤;OS:总生存期;IPI:国际预后指数;TLG:病灶糖酵解总量。

    Table 3.  Multivariate analysis for overall survival of 85 patients with diffuse large B cell lymphoma of stage Ⅱ~Ⅲ disease

3.   讨论
  • PET/CT是CT的解剖形态成像与PET的功能代谢显像的结合,在淋巴瘤的诊断、分期、疗效评价及预后评估中的作用明显优于CT检查,其常用的显像剂为18F-FDG,肿瘤细胞葡萄糖代谢异常活跃,相应地肿瘤病灶在18F-FDG PET/CT显像中为18F-FDG高摄取。有研究结果表明,肿瘤细胞恶性程度越高,细胞增殖越快,则摄取18F-FDG越高[67]。DLBCL是一类侵袭性淋巴瘤,对18F-FDG具有较高的亲和力,绝大多数DLBCL病灶的18F-FDG PET/CT显像为18F-FDG 高代谢。本研究85例DLBCL患者,18F-FDG PET/CT显像均表现为18F-FDG高代谢,SUVmax、MTV、TLG的中位数分别为23.9(16.3)、25.1(95.3)cm3、424.4(1404.6)。因此,18F-FDG PET/CT可作为DLBCL患者分期、疗效评价及预后判断的一种影像学检查技术。

    DLBCL是一种异质性较高的肿瘤,近年来,尽管免疫化疗(利妥昔单抗+环磷酰胺+阿霉素+长春新碱+泼尼松方案)在临床治疗中的广泛应用,使DLBCL患者的生存期和生存率得到了明显改善,但是仍有部分患者在接受一线治疗后不能到达完全缓解或缓解后复发。目前,临床常用于判断DLBCL患者预后的评估指标为IPI,但是在利妥昔单抗时代,IPI的预后评价能力已在逐渐下降。因此,如何筛选出这些预后较差的高危患者,以便及早地进行干预和制定个体化治疗方案,提高临床治愈率及延长患者的生存期,已成为临床亟需解决的问题。

    PET/CT自问世以来,PET代谢参数与DLBCL的预后关系一直是临床研究热点。SUVmax是临床常用的18F-FDG PET/CT半定量指标,反映了肿瘤18F-FDG摄取最高部位的代谢活性,其在DLBCL中的预后判断价值目前存在一定的争议。既往一些研究结果表明,SUVmax与DLBCL患者的预后相关,且是影响DLBCL患者预后的独立危险因素[8-9]。而另一些研究结果表明,SUVmax与DLBCL的预后无关[10-11],我们认为SUVmax受多种因素的影响,如患者血糖水平、仪器的衰减校正等,且SUVmax不能反映肿瘤的整体负荷情况,而DLBCL常常多发,肿瘤负荷较大。因此,治疗前DLBCL病灶SUVmax的预后判断价值存在一定局限性。基于此,近年来,一些新的PET代谢参数,如MTV、TLG则逐渐应用于临床,MTV是SUV在某一给定范围内PET图像上全部像素的体积,是一种基于肿瘤负荷的代谢参数,TLG则是MTV与平均SUVmean的乘积,既包含了肿瘤的18F-FDG代谢活跃程度,又兼顾了肿瘤的代谢体积,更接近于PET成像原理和肿瘤负荷的概念。Zhou等[12]回顾性分析91例DLBCL(Ⅰ/Ⅱ期患者34例,Ⅲ/Ⅳ期患者57例)的临床资料,结果表明治疗前18F-FDG PET/CT显像所获得的TLG是影响患者预后的独立危险因素,而SUVmax、MTV均不是。而Adams等[13]研究纳入了73例Ⅰ~Ⅳ期的DLBCL患者,多因素生存分析结果显示治疗前18F-FDG PET/CT得出的SUVmax、MTV、TLG均与患者的预后无关。因此,MTV、TLG在DLBCL患者的预后价值目前也存在一定的争议。Zhou等[12]和Adams等[13]研究同时都纳入了Ⅰ期和Ⅳ期的DLBCL患者,Ⅳ期患者易侵犯骨髓,而当骨髓浸润在PET/CT图像上表现为弥漫性18F-FDG代谢增高时,ROI的勾画较困难,MTV不易测量,同样TLG也不易获得;且当DLBCL累及消化道时,PET/CT也较难与肠管的炎性病变和生理性摄取鉴别;而Ⅰ期DLBCL患者,由于病灶较局限,患者的预后本身就明显好于Ⅲ期、Ⅳ期的患者。因此,本研究为排除上述干扰因素,仅纳入了Ⅱ期和Ⅲ期的DLBCL患者,结果表明:单因素分析时SUVmax、MTV、TLG是患者PFS的影响因素,MTV、TLG是患者OS的影响因素,由于MTV与TLG呈高度相关,因此多因素生存分析时没有纳入MTV,结果表明TLG是影响患者PFS和OS的独立危险因素,TLG越大,患者的预后越差;而SUVmax不是患者预后的独立危险因素。目前也有研究者将治疗前DLBCL患者的MTV与化疗中期PET/CT的多维尔评分(Deauville score,DS)进行结合,将患者分为:低危组(MTV<400)、中危组(MTV≥400,且DS≤3分)和高危组(MTV≥400,且DS>3分),高危组患者的5年PFS率明显低于低危组(29.7% vs. 90.9%,P<0.05),结果表明,治疗前18F-FDG PET/CT得出的MTV与中期PET/CT的DS评分结果进行结合,对患者的预后具有更好的判断价值[6]。我们后续研究将收集更多的病例,结合中期PET/CT显像结果来判断PET/CT在Ⅱ~Ⅲ期DLBCL患者中的预后价值。

    本研究也存在不足。①本研究为回顾性研究,样本量较小;②一些淋巴结炎性病灶18F-FDG PET/CT可表现为18F-FDG高代谢,因此可能会高估MTV;③MTV的测量采用的是相对阈值法,可能会低估SUVmax较高病灶的MTV。目前,一种新的研究手段——纹理分析,即通过对CT、PET及PET/CT图像上的像素空间分布、强度等影像学特征进行数学分析和运算,从而对肿瘤的纹理参数进行量化,以便对肿瘤的诊断、疗效评价及预后评估进行判断。一项针对肺癌的研究结果表明,18F-FDG PET/CT得出的SUVmax、MTV、TLG均与患者的预后无关,而纹理分析所获得的量化指标是影响患者预后的独立危险因素[14]。我们团队后续将行PET/CT纹理分析与DLBCL患者的预后的相关研究。

    总之,治疗前18F-FDG PET/CT得出的TLG是Ⅱ~Ⅲ期DLBCL患者预后的独立影响因素,对患者的预后判断具有一定的指导依据。

    利益冲突 本研究由署名作者按以下贡献声明独立开展,不涉及任何利益冲突。

    作者贡献声明 丁重阳负责数据的获取、提供与分析及论文的起草;丁磊负责数据的采集;李天女负责研究过程的实施;唐立钧负责数据的统计分析;柳卫负责研究命题的提出、设计及最终版本的修订。

Reference (14)

Catalog

/

DownLoad:  Full-Size Img  PowerPoint
Return
Return