


-
孤立性纤维瘤(solitary fibrous tumors,SFT)是一种罕见的间叶组织肿瘤,在软组织肿瘤中约占2%[1]。SFT最早被认为发生于胸膜、心包膜、腹膜内间皮或间皮下的肿瘤,但随着病理学的发展,SFT被发现是一种发生于成纤维细胞或肌纤维母细胞且遍布全身的软组织肿瘤,病理上也具有多样性[2]。由于SFT与血管外皮细胞瘤组织学起源相同,又具有相似的细胞病理学、临床影像学等表现,导致SFT常被误诊为血管外皮细胞瘤[3]。目前,世界卫生组织对SFT与血管外皮细胞瘤做了明确规定,将多数血管外皮细胞瘤的病例划分为SFT[4]。
研究发现,胸外SFT较胸腔内的更常见[5]。通常表现为生长缓慢、边界清晰的软组织肿瘤,无特异性临床症状,偶尔表现为压迫症状。腹盆腔的SFT亦是如此。复习国内外文献,关于发生于腹盆腔SFT的文献报道不多,本研究通过回顾性分析腹盆腔SFT的CT和MRI影像学表现及特征,旨在提高对其的诊断水平。
-
收集2008年1月至2017年6月经手术病理结果证实的18例腹盆腔SFT患者的临床资料,其中男性9例、女性9例,年龄41~71(53.0±10.6)岁。所有患者中有1例肛门坠胀疼痛、1例腹痛、1例发烧,其他15例均无明显临床症状。
-
采用美国GE公司生产的64层Lightspeed VCT。18例患者中,有13例行CT平扫及三期动态增强扫描。检查前患者禁食6~8 h,扫描时患者平卧于检查床正中,双手上举、屏气扫描。扫描参数:电压120 kV、电流450 mAs、螺距0.984、准直器宽度4 cm;扫描范围:自膈顶至耻骨联合。图像信息进行容积采集,采集后进行图像重建,层厚0.625 mm,层间距0.625 mm。图像后处理行轴位、多平面重建、容积再现及最小密度投影重建。对比剂采用德国拜耳医药公司的优维显(每100 mL含碘量30 g),用量1.0~1.5 mL/kg,注射速度2.5~3.0 mL/s。动脉期:阈值触发,触发阈值为120 Hu;静脉期:动脉期延迟35 s;延迟期:延迟5 min。
-
采用美国GE公司生产的 1.5 T MRI扫描仪。18例患者中,有5例患者行MRI腹部平扫及动态增强扫描,采用相控阵体部线圈。平扫序列包括快速自旋回波T2加权成像,重复时间3000~3500 ms,回波时间84 ms;梯度回拨序列T1加权成像,重复时间110~130 ms,回波时间4.8 ms;动态增强前后扫描采用三维LAVA扫描,重复时间 5.04 ms,回波时间 2.31 ms。对比剂采用马根维显,总量约25~30 mL,静脉推注,行多期动态扫描。
-
图像由2位10年以上工作经验的放射科医师共同分析,包括病灶位置、大小、平扫密度、有无钙化、边界是否清晰、有无周围浸润及转移;动态增强扫描重点观察有无裂隙样斑片状延迟强化、有无动脉期小血管强化、肿瘤周围有无迂曲血管影。意见不一致时,2位医师讨论后确定。
-
所有手术标本经10%甲醛溶液浸泡固定,石蜡包埋,5 μm切片,苏木精-伊红染色(HE染色)。免疫组化染色(Envision法)检测细胞分化因子34(CD34)、B淋巴细胞瘤2基因等指标。
-
应用SPSS19.0软件进行统计学分析。采用卡方检验分析肿瘤大小、边界及形态与良恶性肿瘤的关系,以Fisher检验比较三者在良恶性肿瘤中表现的差异性。P<0.05表示差异有统计学意义。
-
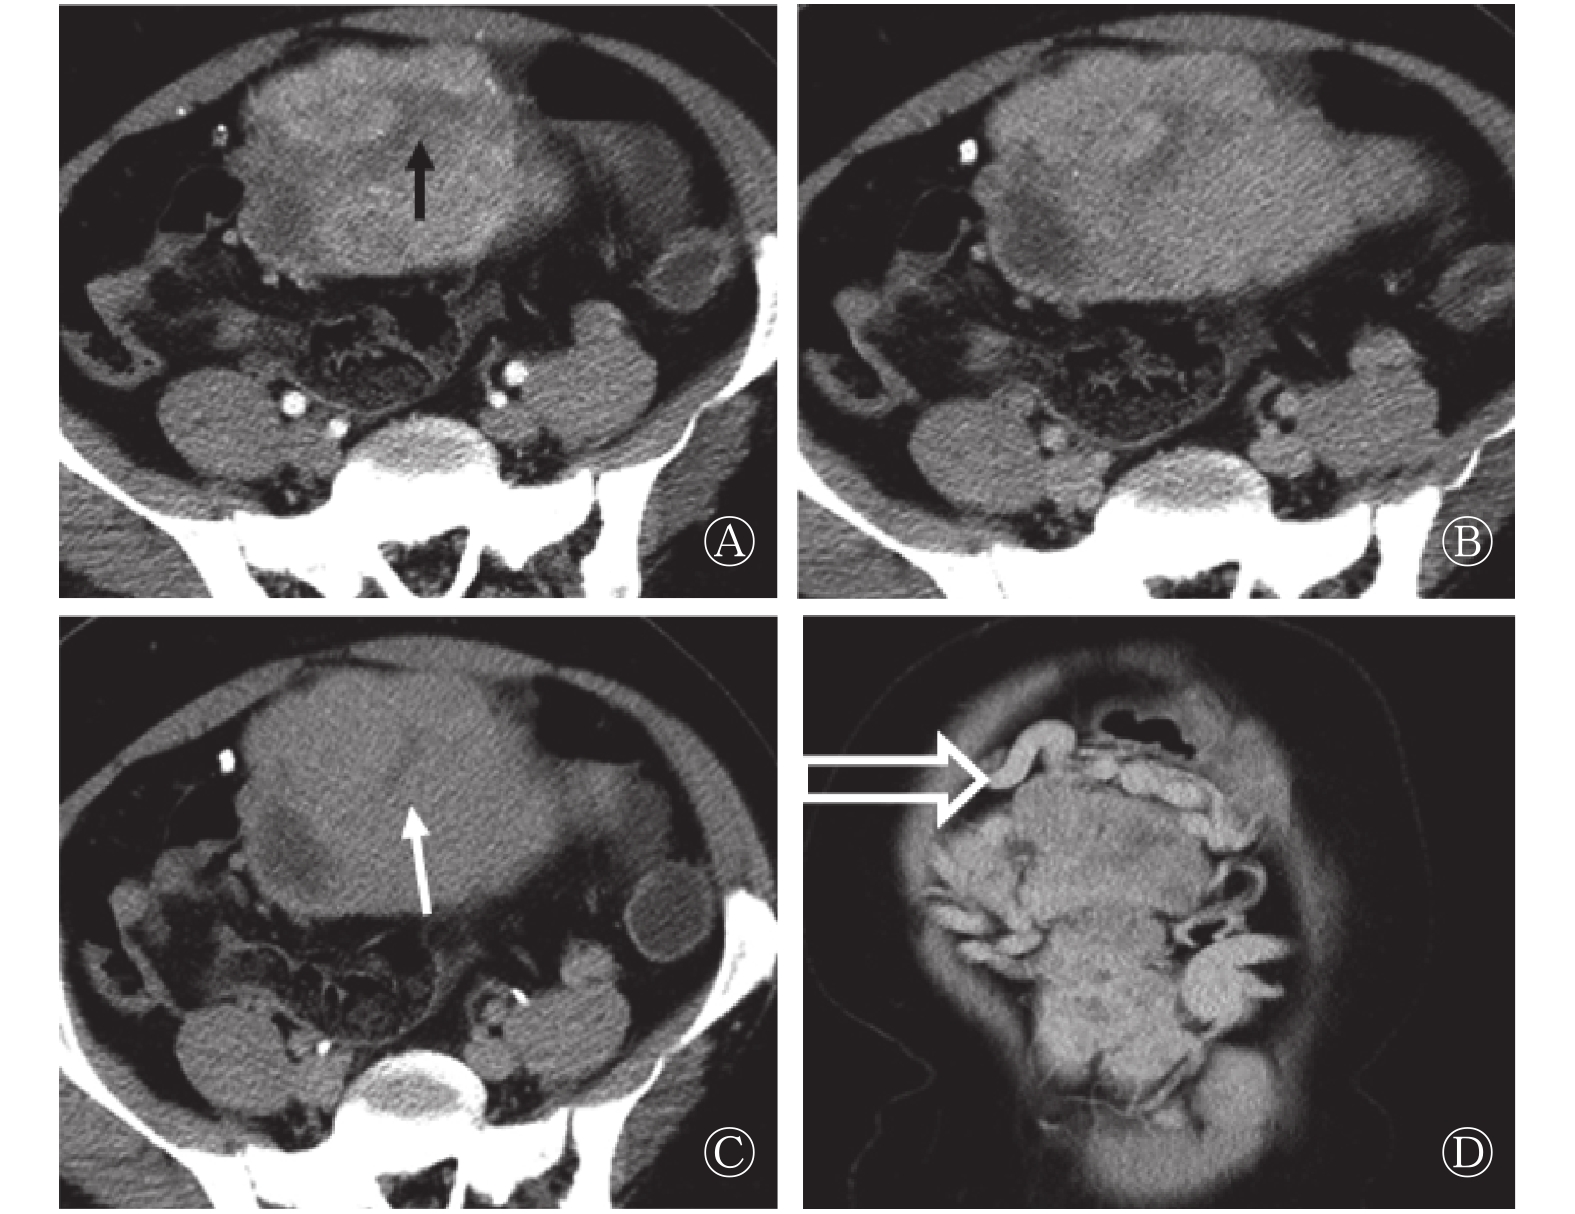
13例患者的肿瘤直径为(10.53±6.21) cm,最大直径为2.7~23.4 cm。12例患者的病灶边界清晰,与周围结构有明显分界,仅有1例发生于胃底的病灶,与周围胃壁结构界线不清。8例患者的病灶呈深浅不一的分叶状或类圆形。CT平扫表现为等密度或等低密度(相对于肌肉),7例患者的病灶内出现囊变,平扫密度不均匀,1例出现钙化灶。动态增强扫描后病灶强化各异,动脉期扫描有11例表现为明显不均匀强化,病灶边缘强化明显,8例病灶内见片状、裂隙状或瘢痕状低强化区(图1中A);静脉期或延迟期扫描向中心渐进性强化(图1中B、C),静脉期及延迟期表现为延迟强化,2例表现为轻中度强化,1例表现为明显均匀渐进性强化。除上述强化特征外,10例患者的病灶在动脉期内可见点状及线状明显强化血管(图1中A),均以病灶边缘分布为主;8例病灶周围可见迂曲血管(图1中D),血管扩张程度与病灶大小大致呈正比。
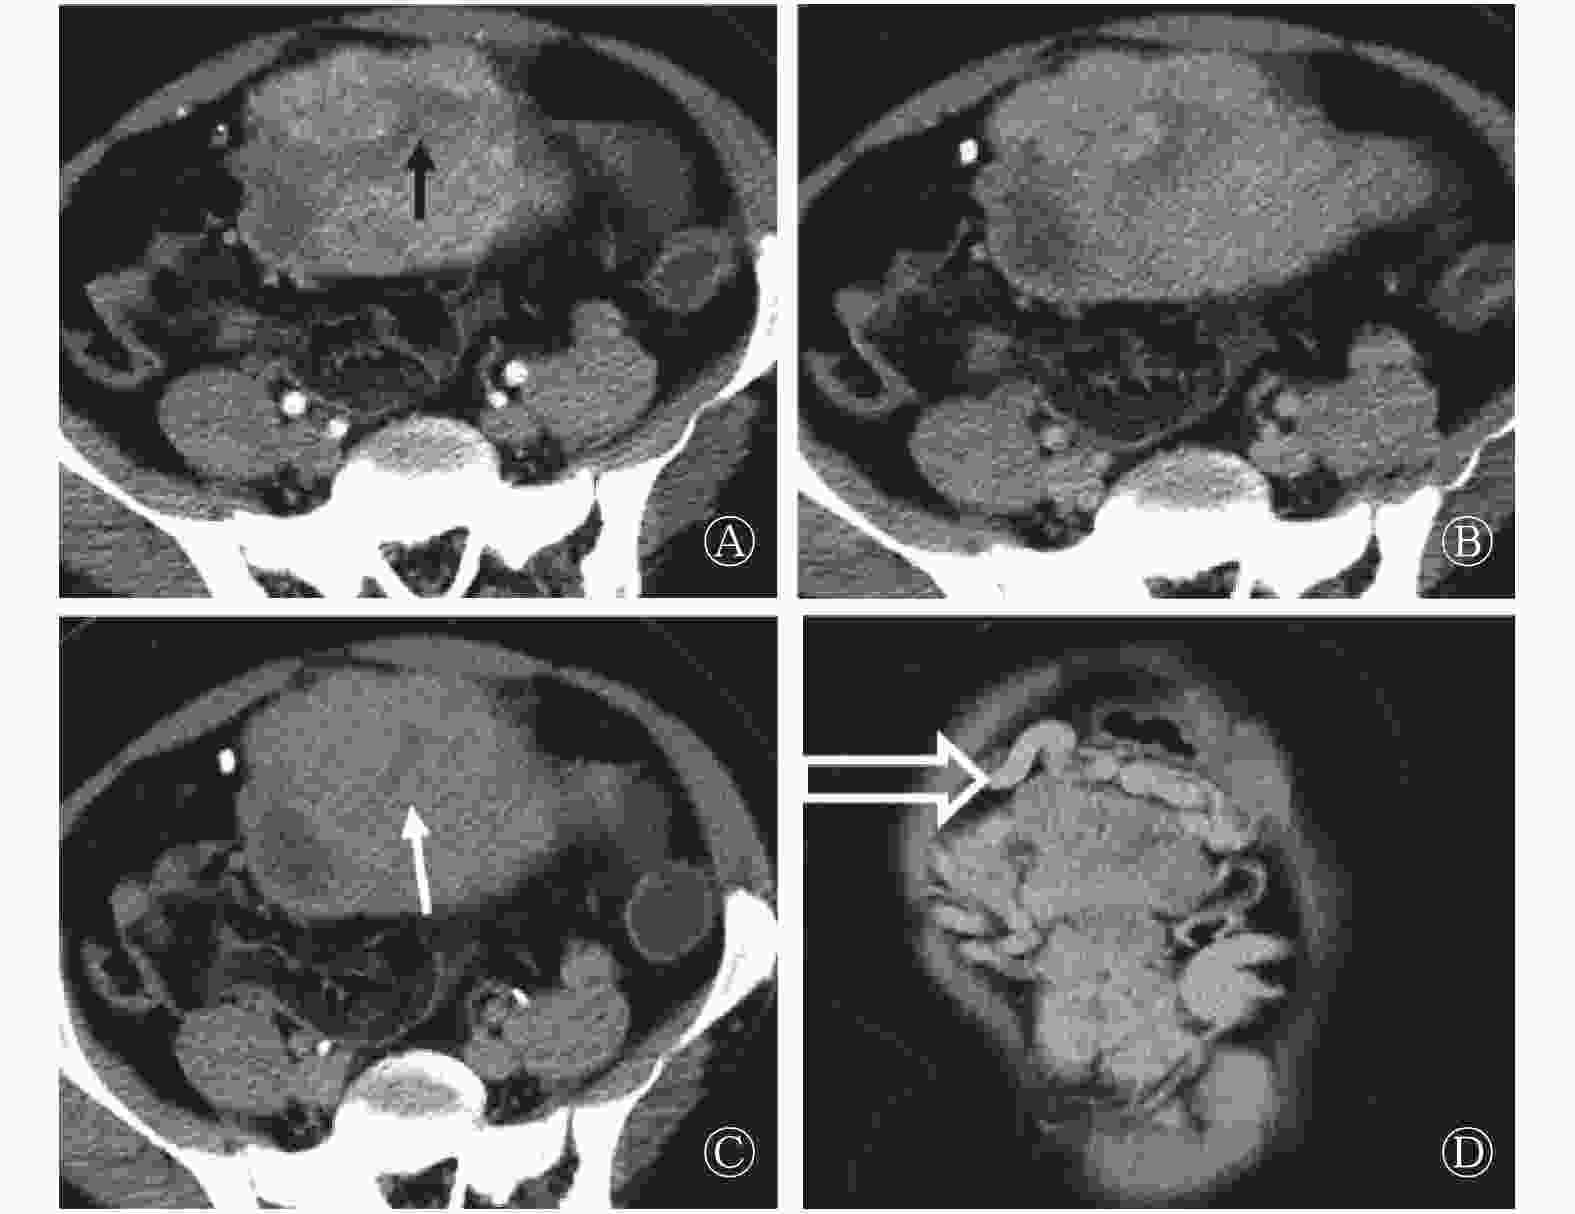
图 1 腹盆腔恶性孤立性纤维瘤患者 (女性,43岁) 的增强CT扫描图 图中,A~C:CT动态增强扫描动脉期、静脉期及延迟期轴位像,腹盆腔巨大肿块、边界清晰、分叶状,动脉期瘤体不均匀强化,中心见瘢痕状低密度区(黑箭头所示),边缘见点状血管样强化,静脉期及延迟期扫描中心低密度区延迟强化(白箭头所示),病灶边缘囊变区无强化;D:冠状位动脉期,可见瘤体周围增粗迂曲血管(空心箭头所示)。
Figure 1. CT image of pelvic malignant solitary fibrous tumors(female, 43 years old)
-
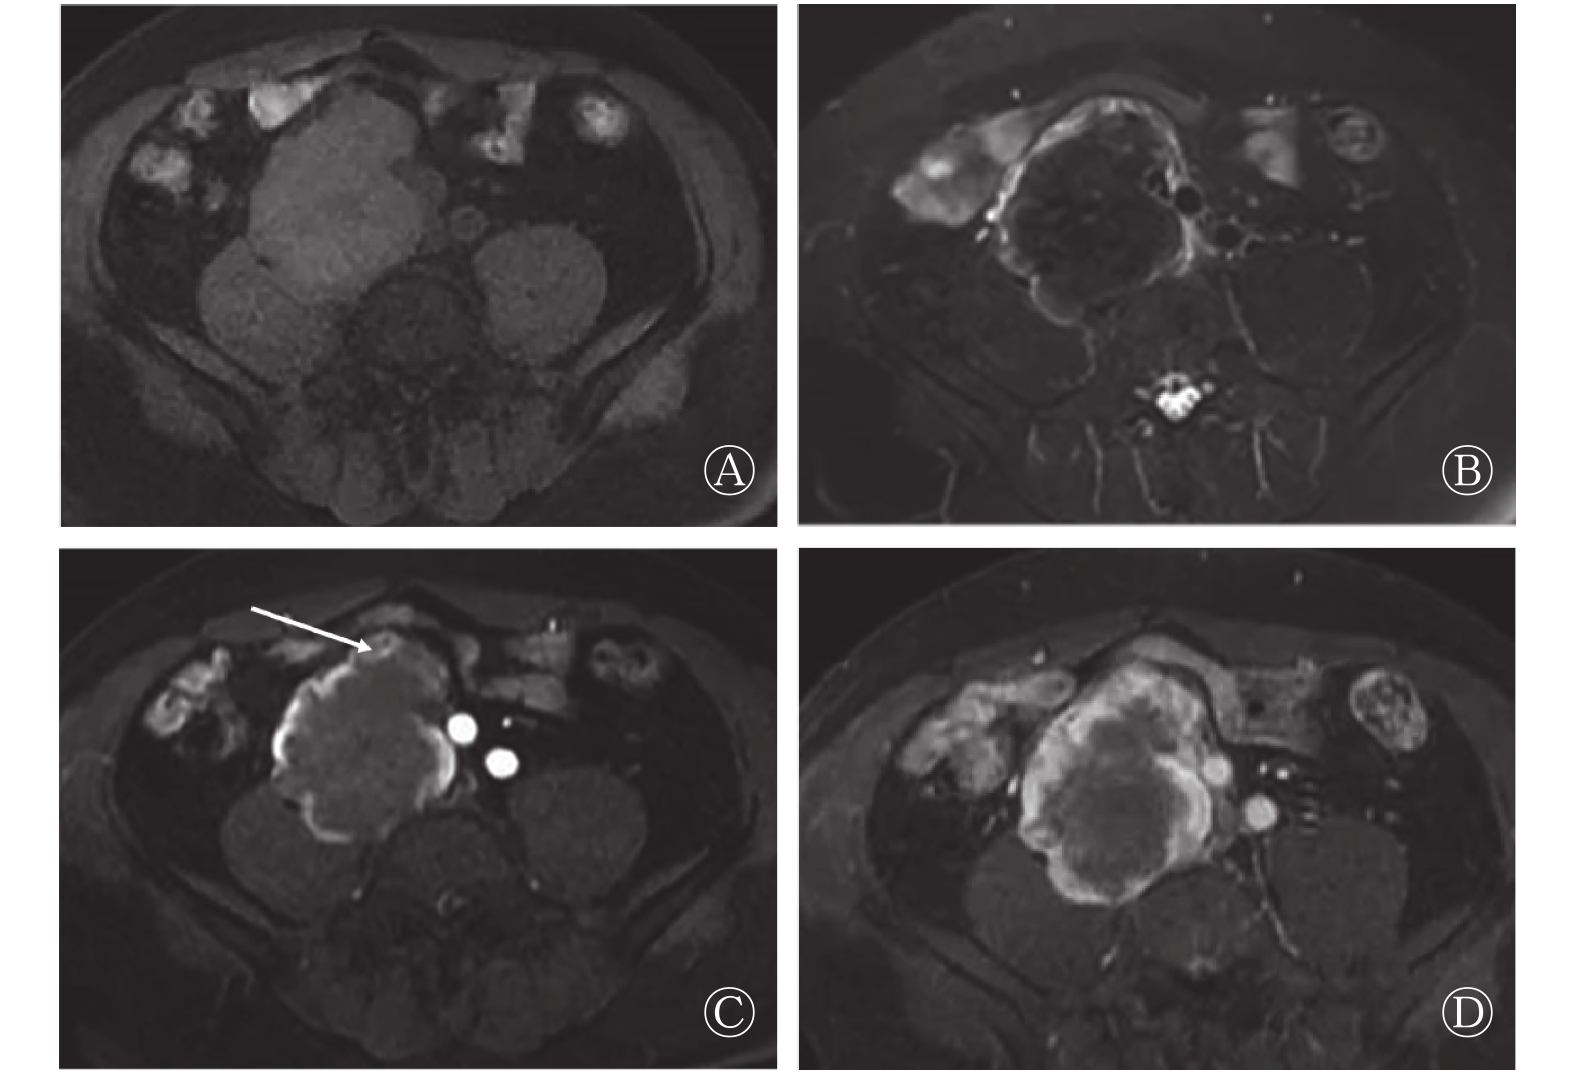
5例患者的肿瘤直径为(11.93±3.21) cm,最大直径为10.0~13.4 cm。5例患者的病灶边界均清晰,与周围结构有明显分界。4例病灶呈深浅不一的分叶状,T1加权成像呈均匀或不均匀低信号及等低信号(相对于肌肉)(图2中A),T2加权成像信号较为复杂,3例出现囊变表现为高信号,4例内见瘢痕状及片状低信号区(图2中B),其中2例既出现囊变高信号区又出现斑片状低信号区,病灶呈高、稍高及低混合信号;均匀等高信号1例。有5例患者的病灶内部均出现低信号流空血管影。动态增强扫描后病灶强化方式不同,动脉期扫描有4例表现为明显不均匀强化,病灶边缘强化明显,4例病灶内见片状、裂隙状或瘢痕状低强化区(图2中C);静脉期或延迟期扫描向中心渐进性强化(图2中D),病灶内部可见瘢痕状及片状动脉期低强化区。1例表现为均匀强化;5例病灶在动脉期内可见点状及线状明显强化血管(图2中C),以病灶边缘分布为主。

图 2 腹盆腔孤立性纤维瘤患者(男性,46岁)的MRI图 图中,A~B:T1、T2加权成像脂肪抑制序列轴位像,病灶边界清晰,呈分叶状,T1加权成像呈均匀等信号(A),T2加权成像呈内部均匀斑片状低信号,边缘环形高信号(B);C~D:动脉期和静脉期轴位动态增强像,增强动脉期呈环形强化,中心等低信号(C),肿块边缘见点状血管样强化(白箭头所示),静脉期可见动脉期低信号区域延迟强化(D)。
Figure 2. MRI images of pelvic solitary fibrous tumors(male, 43 years old)
-
18例SFT患者中,最终病理结果显示7例为恶性,11例为良性。对照病理结果详细分析良恶性病变影像学表现的差异性,良性病例中囊变7例,恶性病例中囊变5例;增强扫描中,呈明显不均匀强化方式的良性病例8例,恶性6例。对鉴别良恶性的3个指标(大小、边界、形态)进行统计学分析结果发现,恶性病变通常直径较大,7例恶性病变中,有5例大于平均值[(10.88±5.62) cm];而良性病变中仅有2例大于平均值,差异具有统计学意义(χ2=5.103,P=0.039)。本研究中只有1例病变边界不清,且为良性病例。由表1可知,在良恶性病变中,边界之间的比较差异无统计学意义(χ2=0.674,P=0.611)。肿瘤形态呈不规则分叶状的良恶性患者各有6例,规则无分叶的病例中良性5例、恶性1例,在良恶性病变中肿瘤形态的良恶性比较,差异无统计学意义,其他具体结果见表1。
病变性质 例数 大小 边界 形态 大于均值 小于均值 清晰 不清晰 不规则分叶 规则无分叶 良性 11 2 9 10 1 6 5 恶性 7 5 2 7 0 6 1 χ2值 5.103 0.674 1.870 P值 0.039 0.611 0.199 注:表中,肿瘤直径的均值为(10.88±5.62)cm。 表 1 18例孤立性纤维瘤患者良恶性病变的3个影像学征象分析(例)
Table 1. Analysis of three imaging features of pelvic solitary fibrous tumors of 18 case solitary fibrous tumors
-
本研究中的所有患者均行手术切除肿瘤,术中探查到肿瘤质韧,10例患者的肿瘤周围血管扩张迂曲,部分肿瘤表面布满迂曲血管,与影像学表现高度吻合。12例患者的肿瘤与周围脏器无浸润、黏连,影像学表现为边界清晰,2例病灶周围可探及子灶。病理结果显示,14例患者的肿瘤有完整包膜,边界清楚;肿瘤切面呈灰白色、质韧,肿瘤内血管丰富与动脉期影像学表现相似。光镜下显示,肿瘤均由疏密不均的梭形细胞组成,呈束状、波纹状排列,间质富于胶原伴玻璃样变性。12例肿瘤可见胶原纤维化结构,该结构与影像学延迟强化结构高度吻合。7例见细胞异型性及核分裂象,提示恶性。免疫组化结果显示,13例患者的CD34为(+)、4例为(++)、1例为(+++);12例患者的B淋巴细胞瘤2基因为(+)、6例为(–)。
-
病理结果显示SFT呈边界清晰的较大软组织肿块,切面呈黄褐色与白色相间的旋涡状切面,并可看见出血和囊变区。SFT典型的组织病理学表现为不同密度排列的梭行细胞、致密的胶原基质、多发鹿角状的薄壁血管混合组成。这些是SFT和血管外皮细胞瘤的共同病理学特征[6]。根据各成分在组织中所占比例不同,SFT可以是梭形细胞为主型,也可以是纤维成分为主的实体肿瘤。后者典型的特征是成纤维组织、胶原基质和透明的厚壁血管交替存在,在免疫组化分析中具有很强的CD34活性;细胞为主的肿瘤表现为单克隆梭形细胞及薄壁血管组成,在免疫组化分析中具有较弱的CD34活性[4]。恶性SFT通常表现以细胞为主型,免疫组化结果呈较弱的CD34活性,而p53和S100会过度表达。本研究中7例恶性SFT的CD34均表现为阳性或弱阳性。
-
CT是较早应用于腹盆腔SFT诊断的影像学方法之一。CT扫描通常表现为边界清晰的软组织肿块;增强扫描时,由于肿块明显强化而纤维包膜强化不明显,可更清楚地观察到肿瘤边界[6]。本研究中行CT扫描的13例患者中,仅有1例患者的肿瘤发生于胃壁SFT与周围胃壁界线不清,其余12例(93%)边界均较清晰。发生于腹膜后的SFT体积通常较大[7],较大的肿块可以压迫周围脏器及组织,如结肠,小肠、泌尿系统等,可使其移位变形。由于肿瘤所含成分不同,如富细胞成分、胶原纤维、黏液变性、坏死囊变区分布的影响,CT扫描平扫密度表现不一。病灶出现钙化较罕见,在较大的良性或恶性SFT中偶尔会出现[8],本研究仅有1例。
-
在MRI中,SFT的T1加权成像呈中等强度信号,T2加权成像表现为较特异性的不均匀低信号伴流空血管影[9],,病灶内部斑片状低信号,磁敏感序列小血管显示更明确。本研究行MRI的5例患者中,4例可见不同程度的低信号区,仅1例呈等高信号,流空血管均可以被观察到。
动态增强扫描SFT表现具有多样性[10],大多数肿瘤表现为血供丰富且持续强化病变[9],但依其所含不同成分的组织,而强化各异。在注入非特异性对比剂后,动脉期的肿瘤富血管区表现为明显强化伴点状、条状强化血管,富细胞区表现为中等程度强化,轻度强化区通常富含胶原基质或纤维基质,静脉期或延迟期的肿瘤富细胞区表现为持续中度程度强化,而富含胶原基质或纤维基质区域强化程度较动脉期明显增加[11]。囊变或坏死区始终不强化。本研究中13例呈现动脉期明显不均匀强化,延迟及静脉期持续强化,其中12例可见上述富含胶原基质或纤维基质成分,在动态增强中表现相对具有特征性。
腹部盆腔SFT特殊征象分析:①出现片状或瘢痕状延迟强化区,腹盆腔SFT多呈“地图样”不均匀渐进性强化[12]。在组织病理学中,富含胶原基质及纤维基质是SFT病理学特征之一[9],其结构致密,对比剂进入缓慢,流出亦缓慢。富含胶原基质及纤维基质肿瘤也可在腹部其他肿瘤内出现,诊断SFT还需结合其他影像学征象。② 增强动脉期肿瘤内出现强化的小血管,在SFT组织病理学中,有富含薄壁鹿角样小血管[9],富血管区血供丰富,动脉期强化明显,滋养动脉增多。依据上述①②两个征象可以诊断SFT。本研究有13例患者出现上述征象。③关于瘤体周围迂曲血管,有文献报道病灶周围出现迂曲的血管影有助于诊断[13-14]。病理上,SFT肿瘤呈富血供,存在侧支滋养血管,且侧支滋养血管与引流静脉之间形成动静脉瘘,在增强动脉期会出现部分引流静脉早期显示。以上征象在之前的国内文献中均有报道[10,15]。本研究有12例患者出现此征象,且肿瘤越大,迂曲血管越明显。
-
腹盆腔SFT是一种潜在的恶性肿瘤,准确诊断主要依靠组织病理学,如果出现细胞丰富、核多形性、细胞异型和多核分裂象则可能认为是恶性SFT。在影像学诊断中,当出现转移或局部复发则可明确诊断为恶性SFT[9];同时出现瘤体体积较大时也可提示恶性的可能。单艳等[14]报道的11例腹盆腔SFT,也提出了瘤体体积较大时,提示恶性SFT的可能。本研究7例恶性SFT中,有5例肿瘤直径超过瘤体最大直径的平均值。
综上所述,腹盆腔SFT的CT及MRI影像学表现呈多样性,同时也存在一些共同的表现。通常表现为体积较大,增强扫描呈现明显不均匀延迟强化,瘤体内出现片状、瘢痕状延迟强化结构,瘤体周围迂曲血管,瘤体内点、条状动脉期强化血管表现有助于诊断;MRI中T2加权成像呈现低信号时也具有一定的诊断价值。当肿瘤体积较大、且呈现不规则的分叶状时,提示有恶性的可能。
利益冲突 本研究由署名作者按以下贡献声明独立开展,不涉及任何利益冲突。
作者贡献声明 冯纪涛负责病例的收集、论文的设计、统计学的分析及论文的撰写;刘许慧负责论文的设计、修改及校对;徐青负责提供部分病例。
腹盆腔孤立性纤维瘤的CT和MRI表现及征象分析
CT and MRI features of solitary fibrous tumors in abdomen and pelvis
-
摘要:
目的 分析腹盆腔孤立性纤维瘤(SFT)的CT和MRI影像学表现及征象,提高对其的认识和诊断的准确性。 方法 回顾性分析2008年1月至2017年6月经手术病理证实的18例腹盆腔SFT患者[男性9例、女性9例,年龄41~71(53.0±10.6)岁]的影像学表现、临床及病理资料。18例患者中,13例行CT平扫和动态增强扫描,5例行MRI平扫和动态增强扫描,分析肿瘤的大小(最大径)、形态、密度或信号、动态增强特点、动脉期肿瘤体内血管及肿瘤周围有无血管等情况。采用卡方精确检验分析肿瘤大小、边界及形态与良恶性肿瘤的关系;Fisher检验比较三者在良恶性肿瘤中表现的差异性。 结果 ① CT影像学表现:13例患者的肿瘤直径为(10.53±6.21) cm,最大直径为2.7~23.4 cm。12例患者肿瘤的病灶边界清晰;8例呈分叶状,7例出现囊变,1例有钙化。CT动态增强扫描显示有11例呈不均匀明显强化;8例病灶内出现延迟强化区,2例表现为轻中度强化;10例动脉期病灶内显示强化血管;8例病灶周围出现迂曲血管。② MRI影像学表现:5例患者的肿瘤直径为(11.93±3.21) cm,最大直径为10.0~13.4 cm。5例患者的病灶边界均清晰;4例病灶呈分叶状;T2加权成像显示有3例出现囊变,4例病灶内见瘢痕状及片状低信号区,1例均匀等高信号;5例出现流空血管影。4例病灶表现为明显不均匀强化;4例病灶内出现延迟强化区;1例表现为均匀强化;5例动脉期在病灶内显示强化血管。③病理结果显示:18例SFT患者中,7例为恶性、11例为良性。7例恶性SFT患者中,有5例病灶最大直径超过平均直径[(10.88±5.62) cm],而良性SFT患者中仅有2例最大直径超过平均直径,差异有统计学意义(χ2=5.103,P=0.039)。 结论 腹盆腔SFT的CT及MRI表现呈多样性,当腹腔内出现丰富的血供伴瘢痕状、片状延迟强化肿瘤,同时瘤体周围出现迂曲血管及瘤体内出现点、条状动脉期强化血管的表现有助于诊断,且MRI中T2加权成像出现低信号也具有一定的诊断价值。 -
关键词:
- 孤立性纤维瘤 /
- X线计算机,体层摄影术 /
- 磁共振成像
Abstract:Objective To observe the CT and MRI results of solitary fibrous tumors(SFT) in the abdomen and pelvis, analyze their characteristic imaging, and improve the accuracy of diagnosis and understanding of the disease. Methods Retrospective analysis of 18 cases confirmed by pathology from January 2008 to June 2017[9 men, 9 women, age 41–71(53.0±10.6) years old] through imaging findings and clinical and pathological data of patients with pelvic SFT. Among the 18 patients, 13 received dynamic CT and 5 received dynamic MRI. The tumor size(maximum diameter), morphology, density or signal, dynamic enhancement characteristics, arterial tumor vessels, and tumors were mainly analyzed. Fisher's exact test was conducted to examine the relationship between tumor size, boundary, and morphology of benign and malignant tumors. The differences among the three characteristics in malignant tumors were determined by Fisher' s test. Results ① Characteristics of CT imaging: The maximum diameter of tumor lesions in the 13 patients with CT was(2.7–23.4) cm, and the mean diameter was(10.53±6.21) cm. Among the 13 cases, 8 were lobulated and 7 exhibited cystic degeneration. One patient showed calcification. Furthermore, 11 cases of nonuniform enhancement by dynamic enhancement was observed. Delayed enhancement was observed in 8 cases. Mild to moderate enhancement was observed in 2 cases. In 10 cases, pointy and linear enhancement of vessels could be seen at the arterial stage, and in 8 cases, tortuous vessels were observed around the lesions. The maximum diameter of the lesions was (10.0–13.4) cm and the mean diameter was(11.93±3.21) cm. ② Characteristics of MRI: The lesion boundaries of 5 patients were clear, and the lesions were lobulated in 4 of 5 patients. In T2 weighted imaging, cystic changes were observed in 3 patients. In 4 cases, scarlike or flaky low-signal areas were found in the lesions, 1 case showed uniform isobaemic signals, and 5 cases presented empty vascular shadows. Moreover, 4 cases indicated an obvious uneven enhancement. Delayed enhancement was observed in 4 cases, and uniform enhancement was observed in 1 case. In 5 cases, vessels were strengthened in the lesion at the arterial stage. ③ Pathology results showed that among the 18 SFT cases, 7 were malignant and 11 were benign. For the malignant SFT, 5 of 7 cases exceeded the average diameter[(10.88±5.62) cm], whereas for the benign SFT, only 2 of 11 cases exceeded the mean. The maximum diameter was different between the benign and malignant lesions(χ2=5.103, P=0.039), showing statistical significance. Conclusions Although radiological findings on abdomino-pelvic SFT vary between dynamic contrast enhanced CT and MRI, a hypervascular mass with delayed enhancement is the imaging feature. Peripheral tortuous vessels and filiform vessels in the lesion may reinforce the diagnosis. The low signal of T2 weighted imaging in MRI also has a certain diagnostic value. -
图 1 腹盆腔恶性孤立性纤维瘤患者 (女性,43岁) 的增强CT扫描图 图中,A~C:CT动态增强扫描动脉期、静脉期及延迟期轴位像,腹盆腔巨大肿块、边界清晰、分叶状,动脉期瘤体不均匀强化,中心见瘢痕状低密度区(黑箭头所示),边缘见点状血管样强化,静脉期及延迟期扫描中心低密度区延迟强化(白箭头所示),病灶边缘囊变区无强化;D:冠状位动脉期,可见瘤体周围增粗迂曲血管(空心箭头所示)。
Figure 1. CT image of pelvic malignant solitary fibrous tumors(female, 43 years old)
图 2 腹盆腔孤立性纤维瘤患者(男性,46岁)的MRI图 图中,A~B:T1、T2加权成像脂肪抑制序列轴位像,病灶边界清晰,呈分叶状,T1加权成像呈均匀等信号(A),T2加权成像呈内部均匀斑片状低信号,边缘环形高信号(B);C~D:动脉期和静脉期轴位动态增强像,增强动脉期呈环形强化,中心等低信号(C),肿块边缘见点状血管样强化(白箭头所示),静脉期可见动脉期低信号区域延迟强化(D)。
Figure 2. MRI images of pelvic solitary fibrous tumors(male, 43 years old)
表 1 18例孤立性纤维瘤患者良恶性病变的3个影像学征象分析(例)
Table 1. Analysis of three imaging features of pelvic solitary fibrous tumors of 18 case solitary fibrous tumors
病变性质 例数 大小 边界 形态 大于均值 小于均值 清晰 不清晰 不规则分叶 规则无分叶 良性 11 2 9 10 1 6 5 恶性 7 5 2 7 0 6 1 χ2值 5.103 0.674 1.870 P值 0.039 0.611 0.199 注:表中,肿瘤直径的均值为(10.88±5.62)cm。  下载: 导出CSV
-
[1] Gold JS, Antonescu CR, Hajdu C, et al. Clinicopathologic correlates of solitary fibrous tumors[J]. Cancer, 2002, 94(4): 1057−1068. DOI: 10.1002/(ISSN)1097−0142. [2] Fletcher CD. The evolving classification of soft tissue tumours: an update based on the new WHO classification[J]. Histopathology, 2006, 48(1): 3−12. DOI: 10.1111/j.1365−2559.2005.02284.x. [3] Koch M, Nielsen GP, Yoon SS. Malignant tumors of blood vessels: angiosarcomas, angiosarcomas, hemangioendotheliomas, and hemangioperictyomas[J]. Surg Oncol, 2008, 97(4): 321−329. DOI: 10.1002/jso.20973. [4] Gengler C, Guillou L. Solitary fibrous tumour and haemangiopericytoma: evolution of a concept[J]. Histopathology, 2006, 48(1): 63−74. DOI: 10.1111/j.1365−2559.2005.02290.x. [5] Brunnemann RB, Ro JY, Ordonez NG, et al. Extrapleural solitary fibrous tumor: a clinicopathologic study of 24 cases[J]. Mod Pathol, 1999, 12(11): 1034−1042. [6] 周彤, 纪清连, 刘吉华, 等. 腹部孤立性纤维瘤的CT表现和病理对照研究[J]. 齐鲁医学杂志, 2017, 32(3): 257−259, 262.
Zhou T, Ji QL, Liu JH, et al. CT findings and pathological comparison of solitary fibroma of abdomen[J]. Med J Qilu, 2017, 32(3): 257−259, 262.[7] Sun J, Yu XR, Shi BB, et al. CT features of retroperitoneal solitary fibrous tumor: report of three cases and review of the literature[J/OL]. World J Surgical Oncol, 2014, 12: 324 [2018−07−22]. http://www.ncbi.nlm.nih.gov/pmc/articles/PMC4282173. DOI: 10.1186/1477−7819−12−324. [8] Kinoshita T, Ishii K, Higashiiwai H, et al. Malignant solitary fibrous tumour of the peritoneum[J]. Clin Radiol, 2000, 55(2): 157−160. DOI: 10.1053/crad.1999.0078. [9] Shanbhogue AK, Prasad SR, Takahashi N, et al. Somatic and visceral solitary fibrous tumors in the abdomen and pelvis: cross-sectional imaging spectrum[J]. Radiographics, 2011, 31(2): 393−408. DOI: 10.1148/rg.312105080. [10] 杜二珠, 谭学君, 张宏凯, 等. 腹部和盆腔孤立性纤维瘤的影像学表现[J]. 中国医学影像学杂志, 2014, 22(5): 369−371, 374. DOI: 10.3969/j.issn.1005−5185.2014.05.013.
Du EZ, Tan XJ, Zhang HK, et al. Imaging Features of Solitary Fibrous Tumors in Abdomen and Pelvis[J]. Chin J Med Imaging, 2014, 22(5): 369−371, 374. DOI: 10.3969/j.issn.1005−5185.2014.05.013.[11] Rosado-de-Christenson ML, Abbott GF, McAdams HP, et al. From the archives of the AFIP: Localized fibrous tumor of the pleura[J]. RadioGraphics, 2003, 23(3): 759−783. DOI: 10.1148/rg.233025165. [12] 赵伟, 刘文广, 刘华平, 等. 肝癌微血管密度、微血管面积和Piezo1的表达与微血管侵犯的相关性[J]. 临床与病理杂志, 2017, 37(8): 1593−1600. DOI: 10.3978/j.issn.2095−6959.2017.08.008.
Zhao W, Liu WG, Liu HP, et al. The correlation between microvascular density, microvascular area, and Piezo1 expression in liver cancer and microvascular invasion was investigated[J]. J Clin Pathol Res, 2017, 37(8): 1593−1600. DOI: 10.3978/j.issn.2095−6959.2017.08.008.[13] Musyoki FN, Nahal A, Powell TI. Solitary fibrous tumor: an update on the spectrum of extrapleural manifestations[J]. Skeletal Radiol, 2012, 41(1): 5−13. DOI: 10.1007/s00256−010−1032−z. [14] 单艳, 曾蒙苏, 林江, 等. 腹盆部孤立性纤维瘤的CT和MRI征象分析[J]. 中国医学计算机成像杂志, 2015, 21(1): 43−47.
San Y, Zeng MS, Lin J, et al. Computed Tomography and Magnetic Resonance Imaging Findings of Solitary Fibrous Tumors in Abdomen and Pelvis[J]. Chin Computed Med Imaging, 2015, 21(1): 43−47.[15] 赵育英, 毛新峰, 姚丽娣, 等. 腹盆部孤立性纤维瘤的MSCT、MRI表现与病理对照分析[J]. 浙江实用医学, 2017, 22(5): 348−354. DOI: 10.3969/j.issn.1007−3299.2017.05.014.
Zhao YY, Mao XF, Yao LD, et al. The MSCT and MRI findings of solitary fibroma in abdomen and pelvis were compared with pathological analysis[J]. Zhejiang Pract Med, 2017, 22(5): 348−354. DOI: 10.3969/j.issn.1007−3299.2017.05.014. -

 点击查看大图
计量
- 文章访问数: 5676
- HTML全文浏览量: 4041
- PDF下载量: 14