


-
肺结节为小的局灶性、类圆形肉芽肿性疾病,其影像学表现为密度增高的阴影,可单发或多发,且不伴有肺不张、肺门肿大和胸腔积液。孤立性肺结节(solitary pulmonary nodule,SPN)无典型症状,常为单个、边界清楚、密度增高、直径≤3 cm且周围被含气肺组织包绕的软组织影[1-2]。CT可用于肺部小结节的检查。随着肺癌CT筛查的普及,检测到的结节数量逐渐增加。目前临床应用的定量预测模型可有助于辨别结节的良恶性。结合临床和CT对结节特征的描述,Brock University(简称Brock)、Mayo Clinic(简称Mayo)和Veterans Association(简称VA)等肺癌预测模型的应用为临床分析提供了极大的便利[3-5]。CT容易诊断具有良性钙化特征的结节,但对非钙化结节的诊断容易出现疑问,也不能反映SPN的代谢及病理生理学信息,PET/CT可同时进行PET和CT扫描,获得两者的融合图像,与单纯的PET相比,PET/CT可从解剖学方面对病变精确定位,既改善了PET图像的分辨率,又缩短了患者的检查时间,一次检查可同时获得CT解剖图像和PET功能图像,两种信息互补,提高了对SPN定性诊断的准确率。近年来,18F-FDG作为常用的肿瘤显像剂,能提供病灶部位代谢信息,可用于临床良恶性疾病鉴别诊断,具有良好的诊断效能,Herder预测模型是基于加入18F-FDG对正电子发射的亲合力进行18F-FDG PET/CT分析[5-7]。临床预测的不同模型适用的患者群体有所差异,Brock模型和Herder模型虽然被广泛应用,但各模型的优势缺乏相关实验的比较验证。因此,本研究重点比较不同模型在招募的患者群体中预测肺结节恶性风险的效能,为临床的合理应用提供依据。
-
回顾性分析2009年7月至2016年7月于本院经CT检查发现的肺结节患者120例,其中,经分析可能为恶性结节的患者有59例,行18F-FDG PET/CT检查其恶性程度。患者通过肺癌多学科综合治疗和特定结节随访确诊。其中男女患者各60例,患者年龄为30~81岁,中位年龄为61岁。120例患者中,86例(71.7%)患者为现在或之前吸烟者,18例(15.0%) 患者在近5年有胸外癌史,5例患者(4.2%)有超过5年的胸外癌史,3例(2.5%)患者有既往肺癌史,112例(93.3%)患者有单发结节,52例(43.3%)患者的最大结节的最大直径≤10 mm。所有患者均于检查前签署了知情同意书。
纳入标准:①均为SPN,不伴有胸腔积液、淋巴结肿大或转移性疾病;②结节直径为4~30 mm;③有明确的组织病理学诊断结果,所有恶性诊断均经组织病理学证实;④行CT增强扫描且无注射碘对比剂禁忌(无碘过敏,肾功能正常,无甲状腺功能亢进、心衰等)。
排除标准:①肺内结节直径>30 mm;②无检查记录或检查记录不完善;③肺内多发结节伴有肺炎、胸腔积液或纵隔淋巴结肿大;④最终诊断不确定的或依肺癌进行治疗的。
-
多层螺旋CT扫描:使用64层螺旋CT(德国Siemens公司 SOMATOM Sensation 64型)进行扫描,扫描参数分别为管电压120 kV、管电流110~160 mAs,层厚及层间隔1.25 mm。扫描结束后自动行常规层厚的肺和纵隔窗重建,然后对病灶行薄层CT重建,层厚1.0~2.0 mm。在工作站进行最大密度投影和容积再现等图像后处理,充分显示肺结节及其周围邻近组织结构改变的细节。
18F-FDG PET/CT检查:采用Discovery LS4 PET/CT一体扫描机(美国GE公司),患者于检查前禁食4~6 h,在安静、避光条件下平卧15 min后,静脉注射示踪剂18F-FDG,注射剂量按5.55 MBq/kg体重计算。在患者平静呼吸状态下行PET/CT检查,取仰卧位,双上臂置于头上,以减少胸部伪影。CT扫描参数:120 kV,60~80 mAs,0.8 s/帧,22.5 mm/s。PET扫描行二维数据采集。采用有序子集最大期望值法重建图像,层厚5 mm,层间隔4.25 mm。
将采集数据经迭代重建后传至工作站进行PET与CT图像的融合,分别获得横轴位、矢状位、冠状位的PET、CT以及PET/CT融合图像。此研究基于18F-FDG亲合力的半定量评估(SUVmax)对结节进行分类,即微弱摄取SUVmax≤2.5(良性病变)、适度摄取SUVmax 2.6~10.0(考虑有恶性病变可能)、强烈摄取SUVmax>10.0(恶性病变)。
-
VA模型主要基于患者的吸烟史、年龄、戒烟时间的长短和结节的大小来建立;Brock模型是目前收集样本例数最多、准确率最高的良恶性鉴别模型,具有非常高的诊断能力;Herder模型以患者临床特征和影像学参数为基础,分析SPN发生恶性肿瘤的概率[3-5]。
Brock模型排除标准:结节<5 mm且边缘规则,结节位于非上叶的位置,有既往肺癌史或近5年内有胸外癌病史。VA模型排除标准:极少的吸烟史(<5年),结节<4 mm,有既往肺癌史或近5年内有胸外癌病史。Herder模型排除标准:有先前的癌症史,结节边缘规则,位于非上叶的位置。
使用基于CT的Brock模型、VA模型和基于18F-FDG PET/CT的Herder模型,计算肺结节恶化的可能性。模型都通过恶性肿瘤概率=1/(1+e-x)求出相应的SPN恶性预测概率,其中,e为自然对数的底数,VA模型:x=-8.404+(2.061×吸烟史)+[0.779×年龄] + (0.112×直径)-[0.567×戒烟时间],Brock模型:x=-6.6144+(0.6467×性别)+ (-5.5537×直径)+(0.9309×毛刺征)+(0.6009×上叶),Herder模型:x=-6.827 2+(0.0391×年龄)+(0.7917×吸烟史)+(1.3388×肿瘤史)+(0.1274×直径)+ (1.0407×毛刺征)+(0.7838×上叶)[3-5]。上述公式中,有既往肿瘤史、肿瘤家族史则记为“1”,无则记为“0”;直径指CT测量的结节最大直径;有毛刺征、边界模糊以及胸膜牵拉征等影像学征象则记为“l”,无则记为“0”;上叶记为“l”,其他位置记为“0”。
根据每个模型的排除标准和所有患者的总队列,验证模型的准确性。通过受试者工作特征(receiver operating characteristic,ROC)曲线,计算曲线下面积(area under the curve,AUC)来评估每个模型的准确性。比较两个模型的效能时,每个模型的评分可用时患者才被收录。
-
采用SPSS 20.0软件对数据进行统计学分析,计算AUC的95%CI。采用MedCalc软件行Z检验,进行ROC曲线间的相关性分析,评价ROC曲线用于鉴别诊断肺结节良恶性的效能。采用DeLong方法进行两条ROC曲线的AUC的Z检验比较。P<0.05表示差异有统计学意义。
-
120例患者中,最终确诊49例(40.8%)患有恶性结节,其中38例为原发性肺癌、11例为转移性疾病;71例(59.2%)为良性病变为,其中61例根据放射学稳定性和监测尺寸减少确诊、另外10例通过组织病理学确诊。
每个模型的ROC曲线见图1。各模型在不同条件下ROC曲线的AUC值详见表1,在不受排除标准限制的总队列中,与受排除标准限制的队列相比,每个模型的AUC值(95%CI,n)均有所下降,但两类队列的AUC值比较差异无统计学意义(Z=21.357,P=0.121)。总队列的3种不同模型的恶性概率分布见图2,其中Herder模型的数据显示为接受18F-FDG PET/CT扫描的患者。
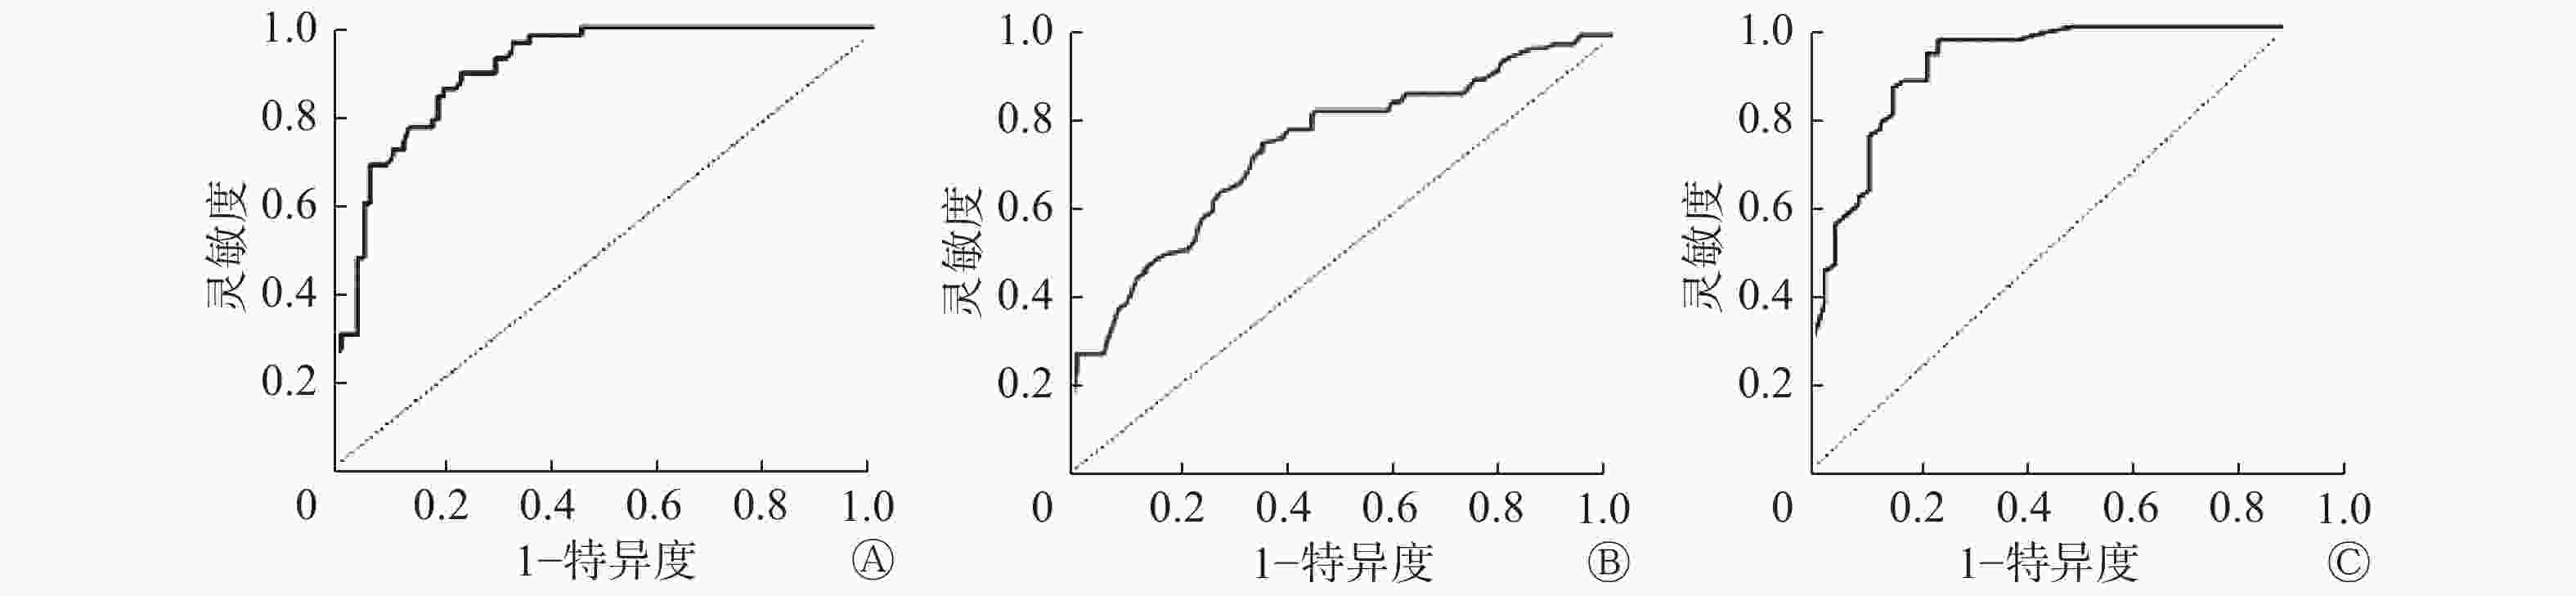
图 1 各模型对肺结节恶性风险预测的ROC曲线 图中,A:Brock University模型;B:Veterans Association模型;C:Herder模型。
Figure 1. The receiver operating characteristic curve of risk prediction for pulmonary nodules in various models
模型名称 AUC(95%CI,n) 受排除标准限值的队列中 不受排除标准限值的总队列中 结节≤10 mm的患者中 Brcok模型 0.887(0.845~0.931,n=84)a 0.869(0.818~0.908,n=120)b 0.846(0.758~0.912,n=52)d VA模型 0.772(0.652~0.801,n=89) 0.758(0.643~0.795,n=120) 0.536(0.387~0.728,n=52) Herder模型 0.937(0.869~0.962,n=47) 0.923(0.870~0.968,n=59)c − 注:表中,ROC:受试者工作特征;AUC:曲线下面积;Brock:Brock University;VA:Veterans Association;−:无此项数据;a:与VA模型相比,Brock模型预测效能更优(Z=6.483,P=0.006),与Herder模型相比,Herder模型的预测效能更优(Z=10.645,P=0.023);b:与VA模型相比,Brock模型预测效能更优(Z=6.483,P=0.006);c:与Brock模型和VA模型相比,Herder模型的预测效能更优(Z=9.860、6.694,均P=0.070);d:与VA模型相比,Brock模型的预测效能更优(Z=8.768,P=0.0026)。 表 1 各模型在不同条件下ROC曲线的AUC结果
Table 1. The areas under the receiver operating characteristic curve of risk prediction for pulmonary nodules in various models

图 2 各模型预测肺结节恶性风险的癌变概率 图中,Brock模型:Brock University模型;VA模型:Veterans Association模型。
Figure 2. Prediction of cancer probability of malignant risk of pulmonary nodules by various models
此外,我们还比较了52例结节≤10 mm的患者(不受排除标准限制)基于CT预测模型的分析效能(表1)。
-
CT对SPN的诊断安全、迅速且无创伤性,有较高的准确率,可对肺癌的早期发现提供可靠依据。目前国内外学者对关于SPN良恶性病变的影响因素开展了一系列研究,欧美学者侧重于将患者的年龄、吸烟史、肿瘤史等个人临床资料作为主要研究热点[8-9]。诊断SPN的关键是确定或排除恶性结节,合理评价,使恶性病变得到及时、准确地诊断及治疗。因而临床上迫切需要能预测肺结节良恶性的模型,这种模型将综合考虑患者的临床资料和影像学特征,具有全面有效及定量化地评估结节的性质。
临床上对于不同预测模型的招募方法是不同的:Mayo模型患者来自胸部X线片基础上检测到的结节,而Brock模型患者来自CT筛查的患者群体,包含更大比例的亚厘米结节,亚厘米结节具有低恶性率[10]。此外,模型的群体受到各种排除标准的限制,进而限制其普遍性。Brock和VA模型均排除了既往肺癌患者或近5年内有胸外癌病史的患者,虽然预测风险率较低,但临床医师和患者仍需要有关恶性风险的指导,以便为后期监测和治疗方案的制定提供信息。Brock模型是目前收集样本例数最多、准确率最高的良恶性鉴别模型,建立时共收集了1871例患者,7008个结节参与模型建立,且其验证数据集样本量达1090例[10]。VA模型建立时数据是不平衡的,有98%的患者为男性,有94%的患者以前或是现在吸烟,吸烟在VA模型中占有较高的比重,如果评估的患者不吸烟者居多,那么该模型的适用性可能会较差[11]。Herder等[5]建立的预测模型以患者临床特征和影像学参数为基础分析SPN发生恶性肿瘤的概率,把流行病学特点(恶性SPN的发病率)、临床因素(年龄、吸烟状态和癌症病史)、传统的解剖影像学特征(病灶位置、大小和边缘毛刺)和代谢或功能影像学特征四者有机地渗透并形成综合体,最大限度地反映SPN的各种信息,准确地预测SPN的性质(恶性或良性)[12-13]。
本研究结果显示,常规临床实验的结节队列中(剔除不符合相应入选标准的病例),Brock模型的表现明显优于VA模型;对于使用18F-FDG PET/CT检查评估的患者,Herder模型在研究中具有最高的准确率(AUC为0.937,95%CI为0.869~0.962)。当分析扩展到整个结节队列(即包括不符合相应入选标准的病例)时,每个模型的准确率都降低,但Brock和Herder模型的AUC值仍然很高(分别为0.869和0.923)。当考虑结节≤10 mm时,Brock模型的AUC值(0.846)相对较高,这表明预测的准确率较高。本研究对不同模型预测肺结节的恶性风险的准确率进行验证比较,提示在使用临床预测模型评估风险之前,临床医师应首先确定适用患者群体的有效模型。
总之,Brock模型在表征常规临床预测肺小结节的恶性概率方面的AUC值高,这表明其准确率较高。本研究结果证实,即使在不受纳入标准限制的队列中使用Brock模型,预测的准确率也较高。当患者接受PET/CT进行结节评估时(通常用于较大的结节,恶性程度较高),Herder模型结合了结节对18F-FDG的亲合力信息,具有最高的预测准确率。但本研究属于单中心回顾性研究,有一定局限性,后期还需要在相应前瞻性试验中进一步验证。
利益冲突 本研究由署名作者按以下贡献声明独立开展,不涉及任何利益冲突。
作者贡献声明 丁辉负责方法建立、实验设计、数据采集、建模、论文撰写及修改;胡传贤负责指导实验设计、结论讨论、论文审阅与修订;黄苏和潘全华负责数据处理和论文的修改。
基于CT和18F-FDG PET/CT的肺癌风险预测模型对肺结节恶性风险的验证研究
Verification of malignant risk of pulmonary nodules based on CT and 18F-FDG PET/CT prediction model
-
摘要:
目的 比较基于CT的Brock模型、VA模型和基于18F-FDG PET/CT的Herder模型预测肺结节恶性风险的效能,验证模型的预测准确率。 方法 回顾性分析2009年7月至2016年7月行CT检查并经病理确诊或随访确诊的120例肺结节患者,其中可能为恶性的59例患者接受了18F-FDG PET/CT检查。绘制3种模型的受试者工作特征(ROC)曲线并计算曲线下面积(AUC)。测算肺结节(直径4~30 mm)的恶性风险。根据每个模型基于排除标准的队列和所有患者总队列的AUC,验证模型的准确性。采用MedCalc软件进行相关性分析,DeLong方法进行两条ROC的比较。 结果 120例肺结节患者中,49例患者(40.8%)患有恶性结节(31.6%原发性肺癌、8.2%转移性疾病)。在受排除标准限制的队列中,Brock和VA模型的AUC分别为 0.887和0.758,两者间的差异有统计学意义(Z=6.483,P=0.006)。 在接受18F-FDG PET/CT检查的患者中,Herder模型的AUC为0.937。当对队列中的所有患者(即包括原模型纳入标准之外的患者)测试模型时,每个模型的AUC值均有所降低,但两类队列比较差异无统计学意义(Z=21.357,P=0.121)。 对于≤10 mm的结节,Brock和VA 模型的AUC值分别为0.846和0.536,Brock模型明显优于VA 模型(Z=8.768,P=0.0026)。 结论 Brock模型可预测CT扫描中检测到的肺结节恶变的可能性,在接受18F-FDG PET/CT进行肺结节评估的患者中,Herder模型的预测效能最高。 -
关键词:
- 孤立性肺结节 /
- 正电子发射断层显像术 /
- 体层摄影术,X线计算机 /
- 肺癌风险预测模型
Abstract:Objective To compare the efficacy of the CT and 18F-FDG PET/CT models in predicting the malignant risk of pulmonary nodules and to verify the predictive accuracy of model. Methods A retrospective analysis of 120 patients with pulmonary nodules confirmed by pathological diagnosis or follow-up were conducted in this study. Among these patients, 59 patients with suspected malignancy received 18F-FDG PET/CT. The corresponding receiver operating characteristic curve for each model was plotted, and the area under the curve(AUC) was calculated. The malignant risk of patients with pulmonary nodules(4–30 mm in diameter) was measured. Model accuracy was verified based on the exclusion criteria for each model and the total cohort of all patients. MedCalc software was used for correlation analysis, and DeLong method was used for two-way comparison. Results All 120 patients with pulmonary nodules were examined. Among them, 49(40.8%) had malignant nodules(31.6% primary lung cancer and 8.2% metastatic disease). The AUC of the Brock and VA models were 0.887 and 0.758, respectively, the difference was statistically significant(Z=6.483, P=0.006). In patients receiving 18F-FDG PET/CT, the AUC of the Herder model was 0.937, which was significantly more accurate than those of the other two models. When testing the model for all patients in the cohort(i.e., patients including the original model’s inclusion criteria), the AUC value decreased but was not significant. For the Herder model, the AUC was 0.923, and the two types of cohorts were not significant(Z=21.357, P=0.121). For subcentimeter nodules, the AUC values for the Brock and VA models were 0.846 and 0.536, respectively, and the Brock model was significantly better than the VA model(Z=8.768, P=0.0026). Conclusion The Brock model showed good accuracy and was used to predict the likelihood of malignancy in nodules detected by CT scan. The Herder model was the most accurate for patients who underwent 18F-FDG PET/CT for nodule evaluation. -
图 1 各模型对肺结节恶性风险预测的ROC曲线 图中,A:Brock University模型;B:Veterans Association模型;C:Herder模型。
Figure 1. The receiver operating characteristic curve of risk prediction for pulmonary nodules in various models
图 2 各模型预测肺结节恶性风险的癌变概率 图中,Brock模型:Brock University模型;VA模型:Veterans Association模型。
Figure 2. Prediction of cancer probability of malignant risk of pulmonary nodules by various models
表 1 各模型在不同条件下ROC曲线的AUC结果
Table 1. The areas under the receiver operating characteristic curve of risk prediction for pulmonary nodules in various models
模型名称 AUC(95%CI,n) 受排除标准限值的队列中 不受排除标准限值的总队列中 结节≤10 mm的患者中 Brcok模型 0.887(0.845~0.931,n=84)a 0.869(0.818~0.908,n=120)b 0.846(0.758~0.912,n=52)d VA模型 0.772(0.652~0.801,n=89) 0.758(0.643~0.795,n=120) 0.536(0.387~0.728,n=52) Herder模型 0.937(0.869~0.962,n=47) 0.923(0.870~0.968,n=59)c − 注:表中,ROC:受试者工作特征;AUC:曲线下面积;Brock:Brock University;VA:Veterans Association;−:无此项数据;a:与VA模型相比,Brock模型预测效能更优(Z=6.483,P=0.006),与Herder模型相比,Herder模型的预测效能更优(Z=10.645,P=0.023);b:与VA模型相比,Brock模型预测效能更优(Z=6.483,P=0.006);c:与Brock模型和VA模型相比,Herder模型的预测效能更优(Z=9.860、6.694,均P=0.070);d:与VA模型相比,Brock模型的预测效能更优(Z=8.768,P=0.0026)。  下载: 导出CSV
-
[1] Harzheim D, Eberhardt R, Hoffmann H, et al. The Solitary Pulmonary Nodule[J]. Respiration, 2015, 90(2): 160−172. DOI: 10.1159/000430996 [2] 张晓辉, 陈成, 曾辉, 等. 孤立性肺结节恶性概率估算临床预测模型的建立[J]. 实用癌症杂志, 2016, 31(1): 59−62. DOI: 10.3969/j.issn.1001−5930.2016.01.018
Zhang XH, Chen C, Zeng H, et al. Establishment of Clinical Prediction Model to Estimate the Probability of Malignancy in Patients with Solitary Pulmonary Nodules[J]. Pract J Cancer, 2016, 31(1): 59−62. DOI: 10.3969/j.issn.1001−5930.2016.01.018[3] Gould MK, Ananth L, Barnett PG. A clinical model to estimate the pretest probability of lung cancer in patients with solitary pulmonary nodules[J]. Chest, 2007, 131(2): 383−388. DOI: 10.1378/chest.06−1261 [4] Mc Williams A, Tammemagi MC, Mayo JR, et al. Probability of cancer in pulmonary nodules detected on first screening CT[J]. N Engl J Med, 2013, 369(10): 910−919. DOI: 10.1056/NEJMoa1214726 [5] Herder GJ, van Tinteren H, Golding RP, et al. Clinical prediction model to characterize pulmonary nodules: validation and added value of 18F-fluorodeoxyglucose positron emission tomography[J]. Chest, 2005, 128(4): 2490−2496. DOI: 10.1378/chest.128.4.2490 [6] Chandarana H, Heacock L, Rakheja R, et al. Pulmonary nodules in patients with primary malignancy: comparison of hybrid PET/MR and PET/CT imaging[J]. Radiology, 2013, 268(3): 874−881. DOI: 10.1148/radiol.13130620 [7] Li W, Pang H, Liu Q, et al. The role of 18F-FDG PET or 18F-FDG PET/CT in the evaluation of solitary pulmonary nodules[J]. Eur J Radiol, 2015, 84(10): 2032−2037. DOI: 10.1016/j.ejrad.2015.06.008 [8] Ma ZJ, Yang GZ, Wang J. Analysis of 96 cases of solitary pulmonary nodule diagnosed by MSCT[J]. Chinese-German J Clin Oncol, 2014, 13(3): 115−118. [9] Rauscher I, Eiber M, Fürst S, et al. PET/MR imaging in the detection and characterization of pulmonary lesions: technical and diagnostic evaluation in comparison to PET/CT[J]. J Nucl Med, 2014, 55(5): 724−729. DOI: 10.2967/jnumed.113.129247 [10] Quint LE, Park CH, Iannettoni MD. Solitary pulmonary nodules in patients with extrapulmonary neoplasms[J]. Radiology, 2000, 217(1): 257−261. DOI: 10.1148/radiology.217.1.r00oc20257 [11] Mehta HJ, Ravenel JG, Shaftman SR, et al. The utility of nodule volume inthe context of malignancy prediction for small pulmonary nodules[J]. Chest, 2014, 145(3): 464−472. DOI: 10.1378/chest.13−0708 [12] Al-Ameri A, Malhotra P, Thygesen H, et al. Risk of malignancy in pulmonary nodules: A validation study of four prediction models[J]. Lung Cancer, 2015, 89(1): 27−30. DOI: 10.1016/j.lungcan.2015.03.018 [13] Zhao M, Chang B, Wei Z, et al. The role of 18F-FDG uptake features in the differential diagnosis of solitary pulmonary lesions with PET/CT[J]. World J Surg Oncol, 2015, 13: 271. DOI: 10.1186/s12957−015−0679−2 -

 点击查看大图

图(2)表(1)
计量
- 文章访问数: 10119
- HTML全文浏览量: 9161
- PDF下载量: 24