


-
弥散加权成像(diffusion weighted imaging,DWI)作为目前唯一能监测活体组织内水分子扩散运动的无创性方法,在检出肝脏小病灶的应用中得到了充分的认可。钆塞酸二钠(gadolinium-ethoxibenzyl-diethylene triaminepentaacetic acid,Gd-EOB-DTPA)具有非特异性细胞外对比剂和肝胆特异性对比剂双重特性,其动态增强与延迟肝实质期扫描能提供病变形态、血供、细胞来源及肝功能等更多信息[1-2]。
我们对肝脏病变患者行Gd-EOB-DTPA增强前、后DWI检查,比较同一病灶不同时相表观弥散系数(apparent diffusion coefficient,ADC)值的变化情况,评估在肝脏增强扫描后行DWI的可行性。
-
收集2013年1月至2015年12月由我院收治的96例肝脏病变患者,均经临床或病理证实,另选30名例行体检的健康志愿者,共126例,其中,男性66例、女性60例,年龄36~70岁,平均(50.2±5.6)岁。96例肝脏病变患者中原发性肝癌25例、转移性肝癌20例、肝血管瘤28例、肝囊肿23例。所有受检者检查项目均经我院医学伦理会同意,并于检查前签署了知情同意书。
-
采用荷兰Philips公司Achieva 1.5T双梯度超导MR成像系统,梯度场强为66 mT/m和33 mT/m,梯度切换率为90 mT/(m·s)和180 mT/(m·s),SENSE Body线圈。
平扫包括:①轴位同相位T1快速场回波序列(T1-FFE-IP),重复时间(time of repeat,TR)137 ms、回波时间(time of echo,TE)4.6 ms、层数25、层厚6 mm、层间距1 mm、激励次数1、扫描时间26 s,二次闭气扫描;②轴位正反相位快速场回波序列(dual-FFE),TR 101 ms、TE 4.6和2.3 ms、层数25、层厚6 mm、层间距1 mm、激励次数1、扫描时间26 s,二次闭气扫描;③轴位呼吸门控多b值弥散加权序列(DWI-4b-RT)。
增强扫描采用闭气高分辨率各向同性容积激发序列(e-THRIVE-BH),TR 3.4 ms、TE 1.6 ms、层数25、层厚6 mm、层间距1 mm、激励次数1、扫描时间14 s。分别行动脉期、静脉期、3 min期、10 min期、20 min期、30 min期轴位扫描。在5 min期,行轴位呼吸门控T2加权精准频率反转恢复序列(T2W-SPAIR)扫描,TR 1128 ms、TE 85 ms、反转时间180 ms、层数25、层厚6 mm、层间距1 mm、激励次数1、扫描时间210 s;在15 min期,行轴位呼吸门控序列DWI-4b-RT扫描,接着行冠状位T2加权快速自旋回波闭气扫描序列(T2W-TSE-BH)扫描,TR 3.3 ms、TE 1.7 ms、层数18、层厚5 mm、层间距1 mm、激励次数1、扫描时间15 s;在25 min期,行轴位呼吸门控序列DWI-4b-RT扫描。
DWI-4b-RT为单次激发自旋回波-平面回波成像(SE-EPI)序列,TR 1137 ms、TE 59 ms、层数25、层厚6 mm、层间距1 mm、激励次数2,在频率编码、相位编码及层面选择3个方向上同时施加扩散敏感梯度场,b值取0、50、300、600 s/mm2,扫描时间196 s。
平扫DWI后,采用美国Medrad公司AVA 500 DCOV高压注射器由肘静脉向患者注射0.025 mmol/kg剂量的Gd-EOB-DTPA,再用20 ml生理盐水冲管。在高压注射器注射后约20~25 s,启动动脉期轴位e-THRIVE-BH。
-
在Philips EWS工作站上,通过ADC分析函数,把b值为50、300、600 s/mm2的DWI像与b值为0的DWI像相减,生成该b值在平扫期、15 min期及25 min期的ADC图。在ADC图上,健康志愿者取不同区域5个ROI进行ADC值测量,取平均值作为正常肝脏的ADC值;原发性肝癌、转移性肝癌、肝血管瘤、肝囊肿患者取最具代表性的病灶勾画ROI,测量并作为该疾病的ADC值。
-
采用SPSS 17.0统计学软件进行分析,同一b值下同一病灶在平扫期、15 min期、25 min期的ADC值符合正态性分布及方差齐性要求,进一步行t检验。P<0.05表示差异具有统计学意义。
-
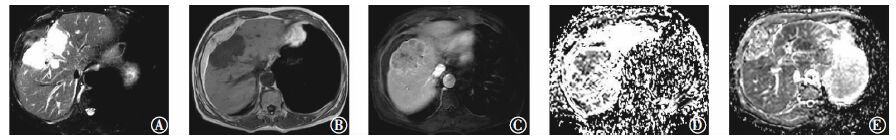
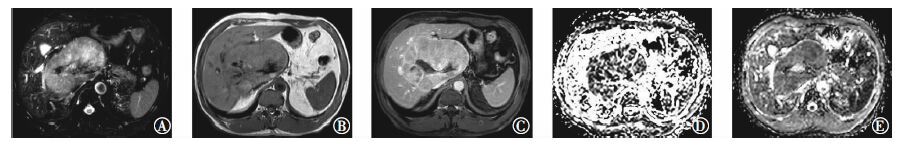
在DWI像上,30名健康志愿者肝实质为等信号,胆管及血管为低信号。25例原发性肝癌患者大多数病灶表现为混杂信号,b值增大,病灶信号强度稍有降低,但仍高于肝实质(图 1)。20例转移性肝癌患者中原发灶有10例肺癌、4例鼻咽癌、4例前列腺癌、2例乳腺癌,其中11例肝脏病灶中心为低信号,b值越大,信号强度越低(图 2)。28例肝血管瘤患者病灶表现为均匀等或稍高信号,b值越大,病灶信号强度越低(图 3)。23例肝囊肿患者b值越大,病灶信号强度下降越明显(图 4)。

图 1 原发性肝癌患者(女性,56岁)的T2加权像、T1加权像和ADC图。图中,T2加权像(A)、平扫T1加权像(B)、静脉期T1加权像(C)可见肝门部并累及肝尾叶S8段大小约13.2 cm×8.1 cm巨大肿块,T1加权像呈低信号,T2加权像呈稍高信号,动脉期明显不均匀强化,静脉期持续强化,延迟期呈低信号;D、E为25 min期在b=50、600 s/mm2下的ADC图,ADC值分别为1.26×10-3 mm2/s和1.18×10-3 mm2/s;ADC:表观弥散系数。
Figure 1. The T2 weighted images,T1 weighted images and apparent diffusion coefficient images of primary liver cancer patient

图 2 转移性肝癌患者(男性,47岁)的T2加权像、T1加权像和ADC图。图中,T2加权像(A)、平扫T1加权像(B)、3 min期T1加权像(C)可见右肝内侧S8段大小约4.90 cm×7.56 cm肿块,T1加权像呈低信号、T2加权像呈高信号,肿块强化不均匀,呈边缘环状强化;D、E为25 min期在b=50、600 s/mm2下的ADC图,ADC值分别为1.41×10-3 mm2/s和1.31×10-3 mm2/s;ADC:表观弥散系数。
Figure 2. The T2 weighted images,T1 weighted images and apparent diffusion coefficient images of metastatic liver cancer patient

图 3 肝血管瘤患者(男性,51岁)的T2加权像、T1加权像和ADC图。图中,T2加权像(A)、平扫T1加权像(B)、10 min期T1加权像(C)可见肝右叶前S7段直径约1.1 cm的结节,边界清楚,T1加权像呈低信号、T2加权像呈高信号,信号均匀,动脉期结节边缘强化,静脉期、5 min期结节强化明显,10 min期、20 min期及30 min期强化逐渐减低;D、E为15 min期在b=50、600 s/mm2下的ADC图,ADC值分别为2.12×10-3 mm2/s和1.96×10-3 mm2/s;ADC:表观弥散系数。
Figure 3. The T2 weighted images,T1 weighted images and apparent diffusion coefficient images of hepatic hemangioma patient

图 4 肝囊肿患者(女性,44岁)的T2加权像、T1加权像和ADC图。图中,T2加权像(A)、平扫T1加权像(B)、20 min期T1加权像(C)可见肝右叶后S7段直径约1.0 cm的结节,T1加权像呈低信号、T2加权像呈高信号,增强扫描后,结节未见明显强化;D、E为15 min期在b=50、600 s/mm2下的ADC图,ADC值分别为2.61×10-3 mm2/s和2.45×10-3 mm2/s;ADC:表观弥散系数。
Figure 4. The T2 weighted images,T1 weighted images and apparent diffusion coefficient images of hepatic cyst patient
正常肝脏ADC图,肝实质为等信号,胆管和血管为高信号。原发性肝癌、转移性肝癌、肝血管瘤、肝囊肿在ADC图的信号强度与DWI像上的表现正好相反。同一性质病灶在同一b值下,ADC值为平扫期>25 min期>15 min期,但差异无统计学意义(t=0.25~1.29,均P>0.05);同一性质病灶在同一时相下,ADC值随b值增大而减小(b=50时>b=300时>b=600时),但差异亦无统计学意义(t=0.34~1.21,均P>0.05)。原发性肝癌、转移性肝癌的ADC值明显低于肝血管瘤、肝囊肿和正常肝脏,且差异具有统计学意义(t=5.28~10.24,均P<0.05),肝血管瘤、肝囊肿的ADC值低于正常肝脏,但差异无统计学意义(t=0.41~1.09,均P>0.05)(表 1)。
从表 1数据中发现,同一b值时,ADC最大降幅[即:(平扫期ADC值-15 min期ADC值)/平扫期ADC值]在正常肝脏中小于5.9%,在原发性肝癌中小于7.3%,在转移性肝癌中小于9.0%,在肝血管瘤中小于5.6%,在肝囊肿中小于5.2%。
b值/(s/mm2) 时相 原发性肝癌(n=25) 转移性肝癌(n=20) 肝血管瘤(n=28) 肝囊肿(n=23) 正常肝脏(n=30) 50 平扫期 1.28±O.22 1.43±O.28 2.14±O.24 2.7O±O.26 2.95±O.22 15 min期 1.19±O.25a 1.34±O.28a 2.O2±O.22a 2.56±O.2Oa 2.79±O.22a 25 min期 1.26±O.27b 1.4O±O.2Ob 2.1O±O.26b 2.65±O.29b 2.89±O.24b 300 平扫期 1.23±O.24 1.38 ±O.26 2.O8±O.24 2.62±O.26 2.88±O.22 15 min期 1.14±O.26a 1.29±O.28a 1.97±O.22a 2.49±O.26a 2.71±O.25a 25 min期 1.21±O.28b 1.35±O.2Ob 2.O4±O.24b 2.58±O.28b 2.79±O.26b 600 平扫期 1.2O±O.26 1.34±O.32 2.O2±O.22 2.5O±O.28 2.78±O.31 15 min期 1.12±O.22a 1.22±O.34a 1.92±O.23a 2.38±O.26a 2.63±O.27a 25 min期 1.18±O.24b 1.3O±O.28b 1.98 ±O.24b 2.44±O.3Ob 2.72±O.32b 注:表中,a为同一疾病在同一时相,b=300与50 s/mm2下的ADC值比较(t=0.41~1.07,P均>0.05);b为同一疾病在同一时相,b=600与50 s/mm2下的ADC值比较(t=0.09~0.39,均P>0.05);ADC:表观弥散系数。 表 1 不同b值下各类肝脏疾病在不同时相的ADC值(×10-3 mm2/s)
Table 1. Apparent diffusion coefficient values of various liver diseases under different b values at different time(×10-3 mm2/s)
-
DWI的扩散敏感度常用b值来表示,在高b值情况下,扩散速度快慢的差异能够得到最佳地显示,指定b值的DWI像与b值为0时的DWI像相减,便是该b值下组织的ADC图。扩散速度快的组织具有较高的ADC值,在DWI像上表现为较低的信号,据此可以对不同病变进行鉴别。
Kenis等[3]和Golfieri等[4]的研究结果显示,在对肝转移瘤的检出上,DWI的灵敏度显著高于T2加权像,与动态对比增强相比无显著差异。Hardie等[5]和Lee等[6]的研究结果显示,在对直径≤1.0 cm的转移瘤的检出率上,DWI高于动态对比增强,但在对直径>1.0 cm的转移瘤的检出率上,二者无明显差异。荣凡令等[7]发现,在b=150 s/mm2时,肝血管瘤、肝囊肿信号强度很高,明显高于肝细胞癌和肝转移瘤,在b=800 s/mm2 时,信号明显下降,但仍高于正常肝脏组织。
在体内,Gd-EOB-DTPA一半由肾脏排泄,一半由肝胆道系统排泄,产生的肝脏强化是双期的,在静脉团注早期,产生类似Gd-DTPA动态增强效果。5 min后,肝脏T1信号强度呈现快速上升趋势,此后肝细胞对造影剂的摄取和滞留,使肝脏T1信号仍持续上升,但速度已减慢,约20 min后达到肝脏强化高峰,大约持续2 h,最后胆汁开始排泄,肝脏T1信号缓慢下降,胆道系统出现强化。
关于静脉注射Gd-EOB-DTPA对DWI的影响,国内外研究存在争论,多数研究结果显示静脉注射Gd-EOB-DTPA不会影响ADC值的测量,可以在增强扫描后行DWI扫描[3-5]。Purysko等[8]通过对63例肝脏肿瘤患者行多时相多b值DWI,发现Gd-EOB-DTPA对增强前后的ADC值没有影响,在增强后行DWI是可行的。Katsube等[9]在注射Gd-EOB-DTPA后,行肝脏5 min期、15 min期、25 min期DWI,发现增强后各期的ADC值与平扫期对比差异不大,认为对比剂的顺磁性效应对肝脏的扩散运动影响有限。Gulani等[10]通过观察平扫以及静脉注射Gd-EOB-DTPA后1~13 min肝脏、肾脏、脾脏DWI的信号强度及ADC值的变化,发现增强扫描后肝脏、肾脏的DWI信号强度及ADC值显著降低。
我们对肝脏行DWI后,发现原发性肝癌、转移性肝癌的ADC值最低,远低于肝血管瘤、肝囊肿及正常肝脏;肝血管瘤和肝囊肿的ADC值低于正常肝脏,但差异不大。同一病灶在相同的b值下,各个时相的ADC值不尽相同,平扫期ADC值最大,15 min期最小,25 min期居中,ADC值在注射Gd-EOB-DTPA后不断下降,15 min后再缓慢恢复,大约25 min后基本上与平扫期ADC值一致。b值越小,ADC值下降的幅度越大;b值越大,降幅越小。从总体降幅上看,正常肝脏<5.9%,原发性肝癌<7.3%,转移性肝癌<9.0%,肝血管瘤<5.6%,肝囊肿<5.2%。原因可能在于Gd-EOB-DTPA为小分子,对细胞外间隙的影响不明显,另外还有可能是Gd-EOB-DTPA的黏滞度与血浆的黏滞度接近,对水分子的扩散产生不了明显的影响。
肝脏DWI的信噪比较低,在与肺、含气肠道等气体交界面上有明显的磁敏感伪影。ADC 值的大小与b 值有关,低b值时,信噪比较高,DWI图像清晰,但受部分微循环血流灌注的影响,测得的ADC 值偏高;高b 值时,图像信噪比较低,磁敏感伪影较大,但可忽略血流灌注的影响,测得的ADC 值较接近肝脏的扩散系数值,更能反映组织的扩散特性[11]。要想获得清晰而又受血流灌注影响小的DWI像,须根据机器及参数选择合适的b 值,通过查阅资料,结合所分析的患者资料,我们认为选择b=600 s/mm2比较合适,既能获得清晰的图像,又能很好地反映组织的扩散特性。
静脉注射Gd-EOB-DTPA后,肝脏平扫与增强后的ADC值无明显差异,说明增强后行DWI获得的效果与平扫DWI一致。
Gd-EOB-DTPA对多b值肝脏DWI中表观弥散系数值的影响
Effect of Gd-EOB-DTPA on apparent diffusion coefficient values in multi-b value model of liver diffusion weighted imaging
-
摘要:
目的 通过行肝脏多b值弥散加权成像(DWI),观察注射钆塞酸二钠(Gd-EOB-DTPA)前、后不同时相表观弥散系数(ADC)值的变化,探讨增强后行DWI的可行性。 方法 收集行Gd-EOB-DTPA肝脏增强的受检者126例,其中,例行体检的健康志愿者30名,肝脏病变患者96例(原发性肝癌25例、转移性肝癌20例、肝血管瘤28例、肝囊肿23例),均经临床或病理证实。在Philips Achieva 1.5T双梯度超导MR成像系统上,行同相与正反相T1加权像闭气轴位平扫及轴位呼吸门控DWI。通过肘静脉向受检者注射0.025 mmol/kg Gd-EOB-DTPA,行动脉期、静脉期、3 min期、10 min期、20 min期、30 min期闭气轴位T1加权高分辨率各向同性容积激发序列(THRIVE)扫描,在5 min期,行轴位T2加权像脂肪抑制呼吸门控扫描,在15 min期,行轴位呼吸门控DWI后,接着行冠状位T2加权闭气扫描,在25 min期,行轴位呼吸门控DWI。平扫期、15 min期、25 min期的DWI参数完全一致,为单次激发自旋回波-平面回波成像(SE-EPI)序列,b值依次取0、50、300、600 s/mm2,扫描时间196 s。在EWS工作站上,通过ADC分析函数生成平扫期、15 min期、25 min期在b=50、300、600 s/mm2时的ADC图,测出正常肝脏、原发性肝癌、转移性肝癌、肝血管瘤、肝囊肿的ADC值,对同一b值下同一疾病在平扫期、15 min期及25 min期的ADC值进行t检验,分析是否存在统计学差异。 结果 同一b值下同一疾病的ADC值在平扫期时最大,随着Gd-EOB-DTPA的注入,ADC值开始下降,然后上升,到了25 min期,ADC值与平扫期时基本一致,15 min期的ADC值最低,平扫期、15 min期、25 min期的ADC值差异无统计学意义(t=0.25~1.29,P均>0.05)。同一疾病同一时相的DWI中,随着b值的增加,ADC值不断下降,b值越小,ADC值越大。 结论 静脉注射Gd-EOB-DTPA后,肝脏ADC值下降十分有限,增强后行DWI是可行的。 Abstract:Objective To observe the variation of apparent diffusion coefficient(ADC) and sum up the feasibility of diffusion weighted imaging(DWI) after enhancement by employing the multi-b value model of liver DWI before and after injection of gadolinium-ethoxibenzyl-diethylene triaminepentaacetic acid(Gd-EOB-DTPA). Methods Data from 126 patients with Gd-EOB-DTPA were collected. Among these patients, 30 had normal liver, 25 had liver cancer, 20 had metastatic carcinoma, 28 had hemangioma, and 23 had cysts, as confirmed by clinical and pathological examination. Philips Achieva 1.5T dual-gradient superconducting magnetic resonance scanner was used for in-phase, in-and-out phase T1 weighted breath hold axial scan, and axial respiratory gated DWI. 0.025 mmol/kg dose of Gd-EOB-DTPA was injected into the patients, temporal high resolution isotropic volume examination(THRIVE) and T1 weighted breath hold axial scan were conducted at arterial phase, venous phase and 3, 10, 20, and 30 min phases. Axial T2 weighted fat saturation respiratory gated scan was conducted at 5 min phase. Axial respiratory gated DWI was conducted at 15 min phase, followed by coronal T2 weighted breath hold scan. Axial respiratory gated DWI was conducted at 25 min phase. The plain, 15 min phase and 25 min phase scan had the same DWI parameter which was single-excitation spin echo-echo planar imaging sequence, the b value was 0, 50, 300, 600 s/mm2, respectively, with a scan time of 196 s. The b=50, 300, and 600 s/mm2 ADC diagram of plain scan, 15 and 25 min scan were generated on an EWS workstation by ADC analysis function. The ADC values of normal liver, liver cancer, metastasis, hemangioma, and cyst were measured. At the same b values, the ADC values of the same type of disease were statistically analyzed by t test at plain scan, 15 and 25 min scan. Results For the same b value and disease, the ADC values of the plain scan were the largest. The ADC values began to decrease and finally increase with the injection of Gd-EOB-DTPA. These values at the 25 min scan were consistent with the result of the plain scan, and the 15 min scan were the lowest. The ADC values had no significant difference in the plain scan, 15 min scan and 25 min scan(t=0.25~1.29, all P>0.05). For the DWI of the same disease and phase, the b value increased and the ADC values decreased; the smaller the b value, the greater the ADC values. Conclusion After intravenous injection of Gd-EOB-DTPA, the decrease of the ADC values in the liver was minimal, and DWI was feasible after enhancement. -
图 1 原发性肝癌患者(女性,56岁)的T2加权像、T1加权像和ADC图。图中,T2加权像(A)、平扫T1加权像(B)、静脉期T1加权像(C)可见肝门部并累及肝尾叶S8段大小约13.2 cm×8.1 cm巨大肿块,T1加权像呈低信号,T2加权像呈稍高信号,动脉期明显不均匀强化,静脉期持续强化,延迟期呈低信号;D、E为25 min期在b=50、600 s/mm2下的ADC图,ADC值分别为1.26×10-3 mm2/s和1.18×10-3 mm2/s;ADC:表观弥散系数。
Figure 1. The T2 weighted images,T1 weighted images and apparent diffusion coefficient images of primary liver cancer patient
图 2 转移性肝癌患者(男性,47岁)的T2加权像、T1加权像和ADC图。图中,T2加权像(A)、平扫T1加权像(B)、3 min期T1加权像(C)可见右肝内侧S8段大小约4.90 cm×7.56 cm肿块,T1加权像呈低信号、T2加权像呈高信号,肿块强化不均匀,呈边缘环状强化;D、E为25 min期在b=50、600 s/mm2下的ADC图,ADC值分别为1.41×10-3 mm2/s和1.31×10-3 mm2/s;ADC:表观弥散系数。
Figure 2. The T2 weighted images,T1 weighted images and apparent diffusion coefficient images of metastatic liver cancer patient
图 3 肝血管瘤患者(男性,51岁)的T2加权像、T1加权像和ADC图。图中,T2加权像(A)、平扫T1加权像(B)、10 min期T1加权像(C)可见肝右叶前S7段直径约1.1 cm的结节,边界清楚,T1加权像呈低信号、T2加权像呈高信号,信号均匀,动脉期结节边缘强化,静脉期、5 min期结节强化明显,10 min期、20 min期及30 min期强化逐渐减低;D、E为15 min期在b=50、600 s/mm2下的ADC图,ADC值分别为2.12×10-3 mm2/s和1.96×10-3 mm2/s;ADC:表观弥散系数。
Figure 3. The T2 weighted images,T1 weighted images and apparent diffusion coefficient images of hepatic hemangioma patient
图 4 肝囊肿患者(女性,44岁)的T2加权像、T1加权像和ADC图。图中,T2加权像(A)、平扫T1加权像(B)、20 min期T1加权像(C)可见肝右叶后S7段直径约1.0 cm的结节,T1加权像呈低信号、T2加权像呈高信号,增强扫描后,结节未见明显强化;D、E为15 min期在b=50、600 s/mm2下的ADC图,ADC值分别为2.61×10-3 mm2/s和2.45×10-3 mm2/s;ADC:表观弥散系数。
Figure 4. The T2 weighted images,T1 weighted images and apparent diffusion coefficient images of hepatic cyst patient
表 1 不同b值下各类肝脏疾病在不同时相的ADC值(×10-3 mm2/s)
Table 1. Apparent diffusion coefficient values of various liver diseases under different b values at different time(×10-3 mm2/s)
b值/(s/mm2) 时相 原发性肝癌(n=25) 转移性肝癌(n=20) 肝血管瘤(n=28) 肝囊肿(n=23) 正常肝脏(n=30) 50 平扫期 1.28±O.22 1.43±O.28 2.14±O.24 2.7O±O.26 2.95±O.22 15 min期 1.19±O.25a 1.34±O.28a 2.O2±O.22a 2.56±O.2Oa 2.79±O.22a 25 min期 1.26±O.27b 1.4O±O.2Ob 2.1O±O.26b 2.65±O.29b 2.89±O.24b 300 平扫期 1.23±O.24 1.38 ±O.26 2.O8±O.24 2.62±O.26 2.88±O.22 15 min期 1.14±O.26a 1.29±O.28a 1.97±O.22a 2.49±O.26a 2.71±O.25a 25 min期 1.21±O.28b 1.35±O.2Ob 2.O4±O.24b 2.58±O.28b 2.79±O.26b 600 平扫期 1.2O±O.26 1.34±O.32 2.O2±O.22 2.5O±O.28 2.78±O.31 15 min期 1.12±O.22a 1.22±O.34a 1.92±O.23a 2.38±O.26a 2.63±O.27a 25 min期 1.18±O.24b 1.3O±O.28b 1.98 ±O.24b 2.44±O.3Ob 2.72±O.32b 注:表中,a为同一疾病在同一时相,b=300与50 s/mm2下的ADC值比较(t=0.41~1.07,P均>0.05);b为同一疾病在同一时相,b=600与50 s/mm2下的ADC值比较(t=0.09~0.39,均P>0.05);ADC:表观弥散系数。  下载: 导出CSV
-
[1] Goshima S, Kanematsu M, Watanabe H, et al.Gd-EOB-DTPA-enhanced MR imaging:prediction of hepatic fibrosis stages using liver contrast enhancement index and liver-to-spleen volumetric ratio[J].J Magn Reson Imaging, 2012, 36(5):1148-1153.DOI:10.1002/jmri.23758. [2] Kudo M.Will Gd-EOB-MRI change the diagnostic algorithm in hepatocellular carcinoma?[J].Oncology, 2010, 78(Suppl 1):S87-S93.DOI:10.1159/000315235. [3] Kenis C, Deckers F, De Foer B, et al.Diagnosis of liver metastases:can diffusion-weighted imaging(DWI) be used as a stand alone sequence?[J].Eur J Radiol, 2012, 81(5):1016-1023.DOI:10.1016/j.ejrad.2011.02.019. [4] Golfieri R, Renzulli M, Lucidi V, et al.Contribution of the hepatobiliary phase of Gd-EOB-DTPA-enhanced MRI to Dynamic MRI in the detection of hypovascular small(≤2 cm) HCC in cirrhosis[J].Eur Radiol, 2011, 21(6):1233-1242.DOI:10.1007/s00330-010-2030-1. [5] Hardie AD, Naik M, Hecht EM, et al.Diagnosis of liver metastases:value of diffusion-weighted MRI compared with gadolinium-enhanced MRI[J].Eur Radiol, 2010, 20(6):1431-1441.DOI:10.1007/s00330-009-1695-9. [6] Lee SA, Lee CH, Jung WY, et al.Paradoxical high signal intensity of hepatocellular carcinoma in the hepatobiliary phase of Gd-EOB-DTPA enhanced MRI:initial experience[J].Magn Reson Imaging, 2011, 29(1):83-90.DOI:10.1016/j.mri.2010.07.019. [7] 荣凡令, 徐青, 徐田勇.低b值DWI在肝左叶小病灶中的应用价值[J].中国中西医结合影像学杂志, 2015, 13(1):4-6.DOI:10.3969/j.issn.1672-0512.2015.01.002.
Rong FL, Xu Q, Xu TY.Application value of lower b-value DWI to small lesions in the left liver lobe[J].Chin Imaging J Integr Tradit West Med, 2015, 13(1):4-6. doi: 10.3969/j.issn.1672-0512.2015.01.002[8] Purysko AS, Remer EM, Veniero JC.Focal liver lesion detection and characterization with GD-EOB-DTPA[J].Clin Radiol, 2011, 66(7):673-684.DOI:10.1016/j.crad.2011.01.014. [9] Katsube T, Okada M, Kumano S, et al.Estimation of liver function using T1 mapping on Gd-EOB-DTPA-enhanced magnetic resonance imaging[J].Invest Radiol, 2011, 46(4):277-283.DOI:10.1097/RLI.0b013e318200f67d. [10] Gulani V, Willatt JM, Blaimer M, et al.Effect of contrast media on single-shot echo planar imaging:implications for abdominal diffusion imaging[J].J Magn Reson Imaging, 2009, 30(5):1203-1208.DOI:10.1002/jmri.21945. [11] Kinner S, Umutlu L, Blex S, et al.Diffusion weighted MR imaging in patients with HCC and liver cirrhosis after administration of different Gadolinium contrast agents:is it still reliable?[J/OL].Eur J Radiol, 2012, 81(4):e625-e628[2016-08-25].http://www.sciencedirect.com/science/article/pii/S0720048-X12000228.DOI:10.1016/j.ejrad.2011.12.042. -

 点击查看大图
计量
- 文章访问数: 2544
- HTML全文浏览量: 1563
- PDF下载量: 3