


-
孤立性肺病变是常见的胸部影像学表现,包括孤立性肺结节和肺肿块。孤立性肺结节指发生于肺部,直径≤3 cm的孤立性单发病灶,周围为正常肺组织,无相关的肺炎、肺不张,淋巴结肿大或其他肺部病变等[1];病变直径>3 cm则定义为肿块。尽管有多种影像学方法用于肺部病变的诊断,但孤立性肺部病变的诊断仍存在一定困难,提高诊断准确率,可以指导临床制定诊疗策略,避免不必要的侵入性检查(如穿刺活检)和手术切除等。
本研究回顾性分析经病理学确诊或临床随访证实的112例孤立性肺部病变患者的PET/CT和HRCT影像学资料,对多项PET及CT征象进行综合评分,初步建立孤立性肺部病变的量化分级系统,以评估孤立性肺病变的良恶性。
-
收集2012年12月至2016年6月期间行PET/CT检查的孤立性肺病变患者112例,其中男性63例,女性49例,年龄24~81岁,平均年龄(58.9±11.3)岁。所有病例均经组织病理学、细胞学或临床随访证实。恶性病变68例,其中腺癌59例、鳞癌8例、神经内分泌癌1例;确诊方法包括手术(胸腔镜手术、肺叶切除、楔形切除、根治术等)40例、穿刺活检18例、纤支镜活检10例。良性病变44例,其中炎性或肉芽肿性病变20例(手术病理证实5例,穿刺活检7例,抗炎治疗后短期复查病灶消失或明显缩小8例),错构瘤3例(手术病理证实),硬化性血管瘤1例(手术病理证实),长期定期随访(≥两年)病灶无明显变化20例。临床表现无特异性,主要表现为咳嗽、咳痰、胸痛等,部分患者为体检时发现肺部病变。所有患者中经手术确诊的病例共49例,其影像检查与手术间隔的时间不超过两周。本研究经本院医学伦理委员会批准。
-
采用美国GE公司 Discovery VCT 64型PET/CT扫描设备,18F-FDG由广州原子高科有限公司提供(放化纯度>95%)。检查前患者禁食至少6 h,空腹血糖水平控制在8.1 mmol/L以下,18F-FDG注射剂量为3.70~5.55 MBq/kg体重(0.15 mCi/kg体重),注射后患者于暗室内安静平卧休息60 min,PET/CT检查前排空小便。图像采集从颅底至股骨中段。CT扫描参数:管电压120 kV,自动管电流跟踪技术(80~200 mA),转速0.6 s,螺距0.516:1。PET扫描参数:采用三维方式采集5~7个床位,每个床位3 min,层厚3.75 mm,采用标准重建法进行图像重建,矩阵512×512,重建层厚1.25 mm。采集完成后利用CT数据对PET图像进行衰减校正,重建横断位、冠状位及矢状位图像。对于肺部孤立性病变采用薄层高分辨率CT(high-resolution computed tomography,HRCT)扫描,扫描层厚0.625 mm,扫描范围为肺部病变所在肺叶。注射显像剂2 h后行肺部病灶局部延迟显像,检查条件同首次显像,早期显像和延迟显像的时间间隔为1 h。
-
由两名核医学科高年资医师分别对PET/CT、HRCT图像进行单独阅读,意见不一致时协商达成一致。在PET图像上,根据病变位置勾画ROI后由工作站软件自动计算肺部病灶早期SUVmax和延迟显像SUVmax,计算SUVmax差值,即ΔSUVmax=延迟SUVmax-早期SUVmax;双时相滞留指数(retention index,RI)=ΔSUVmax/早期SUVmax×100%。HRCT图像记录内容包括病变大小、边界、密度、结构成分、有无分叶、毛刺、胸膜牵拉、空泡征等,病变大小采用平均直径(横断面为最大层面长径和垂直径的均值)。恶性诊断标准:以SUVmax≥2.5或RI≥15%[2],并结合CT征象综合考虑。
-
利用 SPSS 20.0 统计学软件进行分析,符合正态分布的计量资料采用均数±标准差(x±s)表示;孤立性病变良恶性组之间,定量资料包括年龄、大小、早期SUVmax、延迟SUVmax、ΔSUVmax、RI的比较,采用两独立样本t检验分析;定性资料包括性别、病变的影像特征(密度、结构成分、边界、分叶、毛刺、胸膜牵拉、空泡征)之间的比较采用χ2检验分析,评估孤立性肺病变良恶性组之间差异有统计学意义的指标,并计算其比值比(odds ratio,OR)。OR≤0.3时与恶性无关联、0.3~3.0时与恶性无明显关联、≥3.0且<10.0时与恶性有强关联、≥10.0时与恶性有极强关联,赋值分别为0、1、2、3分[3]。根据每个病变的征象进行综合量化评分,初步建立一个量化分级系统,采用受试者工作特征(receiver operating characteristic,ROC)曲线进行分析,得到良、恶性病变的最佳临界值,计算灵敏度、特异度。P<0.05为差异有统计学意义。
-
恶性病变68例,病变大小平均值(2.3±1.1)cm。病变部位:右肺上叶19例,中叶3例,下叶14例;左肺上叶20例,下叶12例。代谢情况:早期SUVmax为0.4~32.8,平均早期SUVmax为7.8±6.9,其中48例患者早期SUVmax≥2.5,病变延迟SUVmax为0.6~35.5,平均延迟SUVmax为9.5±7.8;ΔSUVmax为0~5.3,平均ΔSUVmax为1.7±1.3;RI为0~175%,平均RI为(27.5±24.9)%(图 1)。

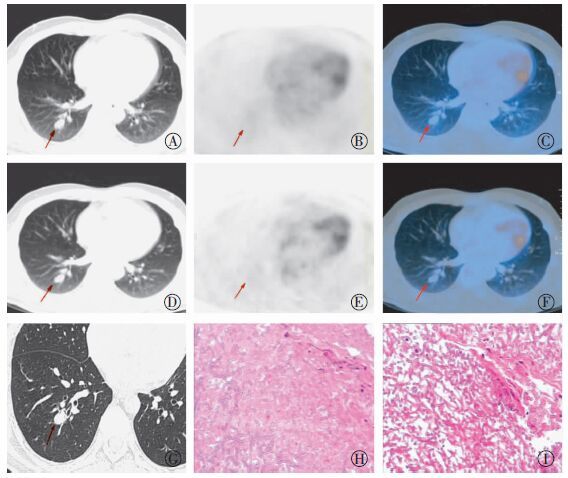
图 1 右肺下叶恶性孤立性肺结节的PET/CT、高分辨率CT和病理图 患者女性,68岁,胸痛、咳嗽1月余。图中,A~C:分别为CT、PET和PET/CT显像。PET/CT显像示右肺下叶后基底段糖代谢轻度增高的结节影,大小为2.2 cm×1.6 cm,SUVmax约为2.5;D~F:分别为1 h后CT、PET和PET/CT延迟显像,PET/CT显像示右肺下叶后基底段结节糖代谢较前增高,SUVmax约为3.3,ΔSUVmax为0.8,滞留指数为32%。G:高分辨率CT图,图中显示右肺下叶结节,边界清楚,周边见分叶、毛刺征,局部胸膜牵拉,结合PET/CT影像特点,根据各项指标进行评分,总分值为18分,4级,考虑恶性病变。H~I:术后病理图(苏木精-伊红染色 ×200,×100): (右下肺)浸润性腺癌,腺泡为主型。
Figure 1. The high-resolution computed tomography CT,PET/CT and pathology of the right lower lobe malignant solitary pulmonary lesion
良性病变44例,病变大小平均值(1.4±0.8)cm。病变部位:右肺上叶11例,中叶7例,下叶11例;左肺上叶6例,下叶9例。代谢情况:早期SUVmax为0.5~12.6,平均早期SUVmax为2.1±2.3,其中12例患者SUVmax≥2.5;延迟SUVmax为0.5~16.1,平均延迟SUVmax为2.5±2.9;ΔSUVmax为 -0.2~3.5,平均ΔSUVmax为0.4±0.7;RI范围为-14.3%~52.9%,平均RI为(12.2±16.0)%(图 2)。

图 2 右肺下叶良性孤立性肺结节的PET/CT、高分辨率CT和病理图 患者男性,45岁,咳嗽、咳痰10余天。图中,A~C:分别为CT、PET和PET/CT显像。PET/CT显像示右肺下叶后基底段无糖代谢异常增高的结节,大小为1.9 cm×1.3 cm,SUVmax约为1.2;D~F:分别为1 h后CT、PET和PET/CT延迟显像,图中PET/CT示右肺下叶后基底段结节未见糖代谢进一步增高,SUVmax约为1.1,ΔSUVmax为-0.1,滞留指数为-8.3%。G:高分辨率CT图,图中显示右肺下叶结节,边界清楚,无分叶、毛刺、胸膜牵拉及空泡征,结合PET/CT影像特点,根据各项指标进行评分,总分值为3分,1级,考虑良性病变可能性大。H~I:术后病理图(苏木精-伊红染色 ×200,×200):镜检肺泡内及间质见大量菌丝及孢子,病变符合真菌感染。
Figure 2. The PET/CT,high-resolution computed tomography CT and pathology of the right lower lobe benign solitary pulmonary lesion
恶性组在年龄、病变大小、早期SUVmax、延迟期SUVmax、ΔSUVmax、RI方面均大于良性组,两组之间的差异均具有统计学意义(均P<0.05)。见表 1。
组别 年龄/岁 大小/cm 早期SUVmax 延迟SUVmax ΔSUVmax RI/% 良性 54.9±12.9 1.4±0.8 2.1±2.3 2.5±2.9 0.4±0.7 12.2±16.0 恶性 61.4±9.3 2.3±1.1 7.8±6.9 9.5±7.8 1.7±1.3 27.5±24.9 t值 -2.900 -4.837 -6.331 -6.726 -6.275 -3.624 P值 0.005 0.000 0.000 0.000 0.000 0.000 注:表中,RI:双实相滞留指数;ΔSUVmax:延迟SUVmax与早期SUVmax的差值。 表 1 孤立性肺部良恶性病变在年龄、病变大小、SUV中的比较
Table 1. Comparison of benign and malignant solitary pulmonary lesions in different age,size and SUV groups
良恶性组在病变密度、边界、分叶、毛刺、胸膜牵拉、空泡征方面差异均具有统计学意义(均P<0.05);两组在性别、病变结构成分方面差异无统计学意义(χ2=0.238,2.023,P=0.626,0.364)。见表 2。
参数 恶性/例 良性/例 χ2 P值 性别 男 37 26 女 31 18 0.238 0.626 密度 均匀 26 31 不均匀 42 13 11.096 0.001 结构成分 实性 46 35 部分实性 13 6 非实性 9 3 2.023 0.364 边界 清晰 45 19 模糊 23 25 5.768 0.016 分叶 有 63 6 无 5 38 70.507 0.000 毛刺 有 62 10 无 6 34 54.516 0.000 胸膜牵拉 有 44 6 无 24 38 28.193 0.000 空泡征 有 56 3 无 12 41 61.143 0.000 表 2 孤立性肺部良恶性肺部病变在性别、CT征象方面的比较
Table 2. Comparison of benign and malignant solitary pulmonary lesions in different gender and HRCT feature groups
-
采用单因素分析评估孤立性肺病变良恶性组之间差异有统计学意义的指标,计算其OR,并进行赋值,结果见表 3。年龄分为≥60岁和<60岁;病变大小分为≥1.0 cm和<1.0 cm;早期SUVmax分为≥2.5和<2.5;ΔSUVmax分为≥1.0和<1.0;RI分为≥15%和<15%。
参数 恶性/例 良性/例 OR 赋值 年龄/ ≥60 46 16 3.658 2 <60 22 28 0.273 0 大小/cm ≥1.0 63 25 9.582 2 <1.0 5 19 0.104 0 密度 均匀 26 31 0.260 0 不均匀 42 13 3.851 2 边界 清晰 45 19 2.574 1 模糊 23 25 0.389 0 早期SUVmax ≥2.5 48 12 6.400 2 <2.5 20 32 0.156 0 △SUVmax ≥1.0 44 7 9.686 2 <1.0 24 37 0.103 0 RI ≥15T 44 14 3.929 2 <15% 24 30 0.255 0 分叶 有 63 6 79.545 3 无 5 38 0.013 0 毛刺 有 62 10 35.227 3 无 6 34 0.028 0 胸膜牵拉 有 44 6 11.603 3 无 24 38 0.086 0 空泡征 有 56 3 63.709 3 无 12 41 0.016 0 注:表中,RI:双实相滞留指数;ΔSUVmax:延迟SUVmax与早期SUVmax的差值。 表 3 PET/CT、HRCT诊断指标在良恶性孤立性肺部病变中的OR及赋值
Table 3. The OR and assignment of PET/CT, HRCT diagnostic index in benign and malignant solitary pulmonary lesions
-
根据孤立性肺病变各项PET/CT、HRCT诊断指标的赋值,计算分值的结果见表 4。由此表可知,分值越高,恶性比例逐渐增高。
根据以上结果,建立一个分级系统,共分为5级:1级:≤5分(恶性率0);2级:6~10分(恶性率0~40%);3级:11~15分(恶性率41%~70%);4级:16~20分(恶性率71%~95%);5级:≥21分(恶性率>95%)。
参数 恶性/例 良性/例 恶性构成比/% ≤5 0 26 0 6~10 5 8 38.5 11-15 14 7 66.7 16-20 36 3 92.3 ≥21 13 0 100.0 表 4 孤立性肺部良恶性病变评分系统中的恶性构成比
Table 4. The malignant percentage in scoring system in benign and malignant solitary pulmonary lesion
-
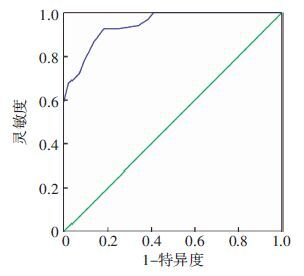
根据ROC曲线分析评分系统对良、恶性肺病变的诊断价值,曲线下面积(area under the curve,AUC)为0.946,标准误为0.019,P<0.001,95%置信区间为0.909~0.983,评分系统对良、恶性肺病变诊断价值较高,最佳诊断临界点是12分,其灵敏度为92.6%,特异度为81.8%(图 3)。

图 3 孤立性肺部良恶性病变评分系统的受试者工作特征曲线图
Figure 3. Receiver operating characteristic curve of scoring system of benign and malignant solitary pulmonary lesions
-
18F-FDG PET/CT显像区分孤立性肺病变的良恶性主要取决于18F-FDG的摄取程度,恶性肿瘤由于葡萄糖运转、摄取、分解显著增高,在显像上表现为18F-FDG摄取增高的高代谢灶[4]。Gould等[5]报道PET对孤立性肺结节和肿块(<4 cm)的诊断灵敏度为94%,特异度为86%。Kim等[6]采用SUV和CT得分综合评估孤立性肺结节发现,PET/CT诊断肺部恶性结节的灵敏度和准确率分别为97%和93%。为了更好地量化并更客观地评价孤立性肺病变,有研究将HRCT影像征象、PET/CT代谢特征、肺癌相关因素等纳入Logistic回归模型,建立孤立性肺结节的诊断模型,用以指导临床[7]。但是基于PET/CT的量化评分系统评估肺部病变的文献报道较少。本研究将患者的临床资料、肺部病变的PET/CT代谢参数、HRCT影像特征进行综合分析,根据有统计学意义的各项指标OR及其赋值评分,建立量化评分系统评价孤立性肺病变良恶性。ROC曲线的 AUC为0.946,评分系统稳定。在最高值为25分的情况下,分值大于12分为诊断孤立性肺部恶性病变的最佳临界值。
孤立性肺病变是多种良、恶性病变的共同表现,临床上常常无明显的特殊症状,常见的有周围型肺癌、炎性结节、肉芽肿性炎、错构瘤等,影像表现复杂,定性诊断常常较难。孤立性肺部病变径线大于3 cm恶性程度明显增高[8]。本组病例中径线大于3.0 cm有20例,其中恶性率为85%。Li和Wang[9]研究报道,预测孤立性肺结节的恶性程度相关因素有年龄、吸烟史、肿瘤病史、结节大小、毛刺征、上叶位置。本研究取病灶大小为最大层面长径和垂直径的均值,恶性组病灶的大小为(2.3±1.1)cm,大于良性组(1.4±0.8)cm,差异有统计学意义(表 1),与文献报道[9]一致。薄层CT扫描中HRCT影像征象如分叶征、毛刺征、胸膜牵拉征、空泡征等对诊断孤立性肺部病变具有重要的临床价值。周莹等[10]对临床IA期周围型肺腺癌病理性脉管浸润与其薄层CT征象进行了研究,发现毛刺征及异常静脉是病理性脉管浸润的独立危险因素。本研究中良恶性组间HRCT相关征象如分叶征、毛刺征、胸膜牵拉征、空泡征,差异均具有统计学意义(表 1),OR为3,因此均纳入评分系统中;而本研究中良恶性组之间肺部病灶的结构成分,差异无统计学意义(χ2=2.023,P=0.364),故未纳入评分系统中,可能由于两组间实性病灶所占比例较高所致,良恶性分别为35例(79.5%)、46例(67.6%),而部分实性和非实性结节较少。
Martins等[11]前瞻性分析了53例18F-FDG PET/CT 肺部病变检查,认为SUVmax≥2.5为预测肺部恶性病变的最佳临界值,诊断准确率为81%。本研究良恶性病变早期SUVmax分别为2.1±2.3和7.8±6.9,差异有统计学意义(t=-6.331,P=0.000)。以SUVmax≥2.5为临界值,恶性病例48例,明显多于良性病变12例。Alkhawaldeh 等[12]研究分析265例肺部孤立性病变,均接受18F-FDG PET/CT双期显像,以SUV≥2.5为临界值,使用早期SUVmax、SUVmax、ΔSUVmax3种方法诊断,准确率分别为85%、89%、91%,结果表明双时相显像能够提高肺部结节影像学诊断的准确性,可以作为肺结节病变的常规扫描方案。本研究病例中良性病变ΔSUVmax为0.4±0.7,恶性病变ΔSUVmax为1.7±1.3,后者高于前者,两者间差异有统计学意义(t=-6.275,P<0.000),与文献报道相符[12]。Suga 等[13]对比76例非小细胞肺癌(non-small cell lung cancer,NSCLC)患者和57例肺部良性病变患者的18F-FDG PET/CT 检查,检查时间为注射药物后60 min和120 min,NSCLC组IR为(21.9±18.9)%,肺部良性病变组IR为(11.3± 26.0)%(P<0.01)。本研究采用的延迟显像扫描时间与其相同,恶性病变IR明显高于良性病变IR(27.5%±24.9% vs. 12.2%±16.0%)。Chen等[14]研究发现,ΔSUVmax是NSCLC预后评估的重要指标,IR越高,提示预后效果越差。肺腺癌IR>25%的预后差于IR<25%。本研究中恶性组腺癌比例为86.8%,IR为(28.4±26.4)%,将IR纳入评分系统中,作为评价孤立性肺病变恶性度的指标,OR为2。
van Gómez López等[15]研究发现评估孤立性肺结节,预测模型联合SUVmax、年龄是最佳的预测方式,其中SUVmax为独立预测指标,良性组、恶性组平均年龄分别为(58±9.1)岁、(64.2±11.1)岁(P=0.045)。本研究中恶性组平均年龄为(61.4±9.3)岁,良性组平均年龄为(54.9±12.9)岁,两组间差异具有统计学意义(t=-2.900,P=0.005)。我们以≥60岁及<60岁分为两组,良恶性组间OR为2。李兰涛等[16]将PET/CT联合HRCT诊断孤立性肺结节,准确率、特异度分别为96.59%和97.72%,而PET/CT单独诊断的准确率、特异度分别为87.50%和81.82%,HRCT单独诊断的准确率、特异度分别为85.23%和86.36%,结果表明,PET/CT联合HRCT更具优势。Al-Ameri等[17]收集研究244例患者的临床和CT资料,99例最后确诊为肺癌患者,139例接受了PET/CT检查,使用3种诊断模型依靠临床和HRCT资料来预测肺癌风险,第4种诊断模型依靠临床、HRCT 和PET/CT,结果显示联合PET/CT后诊断准确率高于前3种,AUC分别为0.924、0.895、0.902、0.735。本研究建立的诊断模型AUC 为0.946。
本研究尚存在一些局限性:①本研究为回顾性研究;②部分良性病例通过随访临床证实,没有病理组织学结果;③样本量有限。接下来的研究我们要增加样本量,并通过前瞻性研究来验证评分系统,以病理结果为金标准,计算基于PET/CT、HRCT征象量化评分分类系统诊断孤立性肺部病变良恶性的灵敏度、特异度、阳性预测值、阴性预测值和准确率,评价其诊断效能。总之,通过综合分析肺部孤立性病变的PET/CT、HRCT影像学特征,可以建立客观、可靠的量化评分系统,对鉴别孤立性肺部良恶性病变具有很高的诊断价值。
基于PET/CT、HRCT特征的评分系统鉴别诊断孤立性肺部病变的临床研究
Clinical study on diagnosis of solitary pulmonary lesions by scoring system based on PET/CT and high-resolution computed tomography features
-
摘要:
目的 探讨基于PET/CT、HRCT影像学特征的评分系统对孤立性肺部良恶性病变的诊断价值。 方法 回顾性分析行PET/CT检查的孤立性占位性肺病变112例,其中良性病变44例,恶性病变68例。对孤立性肺病变的12项PET/CT及HRCT影像特征进行评估,初步建立量化分级系统,采用受试者工作特征(ROC)曲线分析良恶性病变的最佳诊断评分临界值。 结果 PET/CT及HRCT预测孤立性肺部病变的指标包括年龄≥60岁(2分)、病灶大小≥1.0 cm(2分)、密度不均匀(2分)、边界清楚(1分)、SUVmax≥2.5(2分)、ΔSUVmax≥1.0(2分)、滞留指数≥15%(2分)、分叶征(3分)、毛刺征(3分)、胸膜牵拉征(3分)、空泡征(3分)。根据各项指标建立评分系统,随着评分增加,恶性率逐渐增高,通过ROC曲线得出12分为区分良、恶性病变的最佳临界点,灵敏度为92.6%,特异度为81.8%。 结论 基于PET/CT、HRCT影像学特征的量化分级系统有助于鉴别孤立性肺部良恶性病变。 -
关键词:
- 孤立性肺病变 /
- 正电子发射断层显像术 /
- 体层摄影术,X线计算机
Abstract:Objective To explore a quantitative scoring system based on PET/CT and high-resolution computed tomography(HRCT) characteristics for differentiating benign and malignant solitary pulmonary lesions. Methods A total of 112 patients with solitary pulmonary lesions detected by 18F-FDG PET/CT were enrolled and reviewed retrospectively. Of these cases, 44 were benign lesions and 68 were malignant. PET/CT and HRCT imaging features were recorded and evaluated. A quantitative scoring system was established. The best cut-off score was calculated by analysis of receiver operating characteristics(ROC) in differentiating benign and malignant lesions. Results The indicators of malignant solitary pulmonary lesions by PET/CT and HRCT included age≥60 years(2 points), diameter of the lesion≥1 cm(2 points), heterogeneous density(2 points), clear boundary(1 point), SUVmax≥2.5(2 points), ΔSUVmax≥1.0(2 points), retention index(RI)≥15%(2 points), lobular sign(3 points), spiculation sign(3 points), pleural traction sign(3 points), and vacuole sign(3 points). A quantitative scoring system was established according to risk factors. Moreover, score 12 was the best cut-off by ROC analysis in differentiating benign and malignant lesions. The sensitivity and specificity rates were 92.6% and 81.8%, respectively. Conclusion The quantitative scoring system based on PET/CT and HRCT features exhibited a good capacity for differentiating malignant lesions from benign solitary pulmonary lesions. -
图 1 右肺下叶恶性孤立性肺结节的PET/CT、高分辨率CT和病理图 患者女性,68岁,胸痛、咳嗽1月余。图中,A~C:分别为CT、PET和PET/CT显像。PET/CT显像示右肺下叶后基底段糖代谢轻度增高的结节影,大小为2.2 cm×1.6 cm,SUVmax约为2.5;D~F:分别为1 h后CT、PET和PET/CT延迟显像,PET/CT显像示右肺下叶后基底段结节糖代谢较前增高,SUVmax约为3.3,ΔSUVmax为0.8,滞留指数为32%。G:高分辨率CT图,图中显示右肺下叶结节,边界清楚,周边见分叶、毛刺征,局部胸膜牵拉,结合PET/CT影像特点,根据各项指标进行评分,总分值为18分,4级,考虑恶性病变。H~I:术后病理图(苏木精-伊红染色 ×200,×100): (右下肺)浸润性腺癌,腺泡为主型。
Figure 1. The high-resolution computed tomography CT,PET/CT and pathology of the right lower lobe malignant solitary pulmonary lesion
图 2 右肺下叶良性孤立性肺结节的PET/CT、高分辨率CT和病理图 患者男性,45岁,咳嗽、咳痰10余天。图中,A~C:分别为CT、PET和PET/CT显像。PET/CT显像示右肺下叶后基底段无糖代谢异常增高的结节,大小为1.9 cm×1.3 cm,SUVmax约为1.2;D~F:分别为1 h后CT、PET和PET/CT延迟显像,图中PET/CT示右肺下叶后基底段结节未见糖代谢进一步增高,SUVmax约为1.1,ΔSUVmax为-0.1,滞留指数为-8.3%。G:高分辨率CT图,图中显示右肺下叶结节,边界清楚,无分叶、毛刺、胸膜牵拉及空泡征,结合PET/CT影像特点,根据各项指标进行评分,总分值为3分,1级,考虑良性病变可能性大。H~I:术后病理图(苏木精-伊红染色 ×200,×200):镜检肺泡内及间质见大量菌丝及孢子,病变符合真菌感染。
Figure 2. The PET/CT,high-resolution computed tomography CT and pathology of the right lower lobe benign solitary pulmonary lesion
图 3 孤立性肺部良恶性病变评分系统的受试者工作特征曲线图
Figure 3. Receiver operating characteristic curve of scoring system of benign and malignant solitary pulmonary lesions
表 1 孤立性肺部良恶性病变在年龄、病变大小、SUV中的比较
Table 1. Comparison of benign and malignant solitary pulmonary lesions in different age,size and SUV groups
组别 年龄/岁 大小/cm 早期SUVmax 延迟SUVmax ΔSUVmax RI/% 良性 54.9±12.9 1.4±0.8 2.1±2.3 2.5±2.9 0.4±0.7 12.2±16.0 恶性 61.4±9.3 2.3±1.1 7.8±6.9 9.5±7.8 1.7±1.3 27.5±24.9 t值 -2.900 -4.837 -6.331 -6.726 -6.275 -3.624 P值 0.005 0.000 0.000 0.000 0.000 0.000 注:表中,RI:双实相滞留指数;ΔSUVmax:延迟SUVmax与早期SUVmax的差值。  下载: 导出CSV
表 2 孤立性肺部良恶性肺部病变在性别、CT征象方面的比较
Table 2. Comparison of benign and malignant solitary pulmonary lesions in different gender and HRCT feature groups
参数 恶性/例 良性/例 χ2 P值 性别 男 37 26 女 31 18 0.238 0.626 密度 均匀 26 31 不均匀 42 13 11.096 0.001 结构成分 实性 46 35 部分实性 13 6 非实性 9 3 2.023 0.364 边界 清晰 45 19 模糊 23 25 5.768 0.016 分叶 有 63 6 无 5 38 70.507 0.000 毛刺 有 62 10 无 6 34 54.516 0.000 胸膜牵拉 有 44 6 无 24 38 28.193 0.000 空泡征 有 56 3 无 12 41 61.143 0.000
下载: 导出CSV
表 3 PET/CT、HRCT诊断指标在良恶性孤立性肺部病变中的OR及赋值
Table 3. The OR and assignment of PET/CT, HRCT diagnostic index in benign and malignant solitary pulmonary lesions
参数 恶性/例 良性/例 OR 赋值 年龄/ ≥60 46 16 3.658 2 <60 22 28 0.273 0 大小/cm ≥1.0 63 25 9.582 2 <1.0 5 19 0.104 0 密度 均匀 26 31 0.260 0 不均匀 42 13 3.851 2 边界 清晰 45 19 2.574 1 模糊 23 25 0.389 0 早期SUVmax ≥2.5 48 12 6.400 2 <2.5 20 32 0.156 0 △SUVmax ≥1.0 44 7 9.686 2 <1.0 24 37 0.103 0 RI ≥15T 44 14 3.929 2 <15% 24 30 0.255 0 分叶 有 63 6 79.545 3 无 5 38 0.013 0 毛刺 有 62 10 35.227 3 无 6 34 0.028 0 胸膜牵拉 有 44 6 11.603 3 无 24 38 0.086 0 空泡征 有 56 3 63.709 3 无 12 41 0.016 0 注:表中,RI:双实相滞留指数;ΔSUVmax:延迟SUVmax与早期SUVmax的差值。
下载: 导出CSV
表 4 孤立性肺部良恶性病变评分系统中的恶性构成比
Table 4. The malignant percentage in scoring system in benign and malignant solitary pulmonary lesion
参数 恶性/例 良性/例 恶性构成比/% ≤5 0 26 0 6~10 5 8 38.5 11-15 14 7 66.7 16-20 36 3 92.3 ≥21 13 0 100.0
下载: 导出CSV
-
[1] Soubani AO.The evaluation and management of the solitary pulmonary nodule[J].Postgrad Med J, 2008, 84(995):459-466.DOI:10.1136/pgmj.2007.063545. [2] 姚稚明, 屈婉莹, 刘甫庚, 等.18F-FDG PET/CT双时相显像对孤立性肺结节的诊断价值[J].中华核医学杂志, 2007, 27(1):5-7.DOI:10.3760/cma.j.issn.2095-2848.2007.01.002.
Yao ZM, Qu WY, Liu FG, et al.The clinical value of dual time point 18F-FDG PET/CT in diagnosis of solitary pulmonary nodule[J].Chin J Nucl Med, 2007, 27(1):5-7. doi: 10.3760/cma.j.issn.2095-2848.2007.01.002[3] 耿贯一.流行病学[M].2版.北京:人民卫生出版社, 1997:221.
Geng GY.Epidemiolog[M].2nd ed.Beijing:People's Medical Publishing House, 1997:221.[4] 陈聪霞, 李旭, 姚稚明.18F-FDG PET/CT诊断孤立性肺结节良恶性的研究进展[J].国际放射医学核医学杂志, 2012, 36(6):344-347.DOI:10.3760/ema.j.issn.1673-4114.2012.06.006.
Chen CX, Li X, Yao ZM.The development of 18F-FDG PET-CT in the diagnosis of benign and malignant solitary pulmonary nodules[J].Int J Radiat Med Nucl Med, 2012, 36(6):344-347. doi: 10.3760/ema.j.issn.1673-4114.2012.06.006[5] Gould MK, Maclean CC, Kuschner WG, et al.Accuracy of positron emission tomography for diagnosis of pulmonary nodules and mass lesions:a meta-analysis[J].JAMA, 2001, 285(7):914-924. doi: 10.1001/jama.285.7.914 [6] Kim SK, Allen-Auerbach M, Goldin J, et al.Accuracy of PET/CT in characterization of solitary pulmonary lesions[J].J Nucl Med, 2007, 48(2):214-220. [7] Zhang X, Yan HH, Lin JT, et al.Comparison of three mathematical prediction models in patients with a solitary pulmonary nodule[J].Chin J Cancer Res, 2014, 26(6):647-652.DOI:10.3978/j.issn.1000-9604.2014.11.02. [8] Truong MT, Sabloff BS, Ko JP.Multidetector CT of solitary pulmonary nodules[J].Radiologic Clinics North America, 2010, 48(1):141-155.DOI:10.1016/j.rcl.2009.09.005. [9] Li Y, Wang J.A mathematical model for predicting malignancy of solitary pulmonary nodules[J].World J Surg, 2012, 36(4):830-835.DOI:10.1007/s00268-012-1449-8. [10] 周莹, 刘士远, 李琼, 等.临床IA期周围型肺腺癌病理性脉管浸润与其薄层CT征象的相关性研究[J].中华放射学杂志, 2015, 49(4):259-263.DOI:10.3760/cma.j.issn.1005-1201.2015.04.006.
Zhou Y, Liu SY, Li Q, et al.Correlation of thin-section CT morphologic features and pathological vascular invasion in the clinical stage IA peripheral lung adenocarcinoma[J].China Radiol, 2015, 49(4):259-263. doi: 10.3760/cma.j.issn.1005-1201.2015.04.006[11] Martins Rde C, Almeida SA, Siciliano AA, et al.Value of[18F]-FDG-PET/CT as a predictor of cancer in solitary pulmonary nodule[J].J Bras Pneumol, 2008, 34(7):473-480. doi: 10.1590/S1806-37132008000700007 [12] Alkhawaldeh K, Bural G, Kumar R, et al.Impact of dual-time-point(18)F-FDG PET imaging and partial volume correction in the assessment of solitary pulmonary nodules[J].Eur J Nucl Med Mol Imaging, 2008, 35(2):246-252.DOI:10.1007/s00259-007-0584-1. [13] Suga K, Kawakami Y, Hiyama A, et al.Dual-time point 18F-FDG PET/CT scan for differentiation between 18F-FDG-avid non-small cell lung cancer and benign lesions[J].Ann Nucl Med, 2009, 23(5):427-435.DOI:10.1007/s12149-009-0260-6. [14] Chen HH, Lee BF, Su WC, et al.The increment in standardized uptake value determined using dual-phase 18F-FDG PET is a promising prognostic factor in non-small-cell lung cancer[J].Eur J Nucl Med Mol Imaging, 2013, 40(10):1478-1485.DOI:10.1007/s00259-013-2452-5. [15] van Gómez López O, García Vicente AM, Honguero Martínez AF, et al.18F-FDG PET/CT in the assessment of pulmonary solitary nodules:comparison of different analysis methods and risk variables in the prediction of malignancy[J].Transl Lung Cancer Res, 2015, 4(3):228-235.DOI:10.3978/j.issn.2218-6751.2015.05.07. [16] 李兰涛, 林红雨, 王海燕, 等.HRCT与PET/CT联合诊断孤立性肺结节[J].中国医学影像技术, 2013, 29(3):425-428.
Li LT, Lin HY, Wang HY, et al.HRCT combining with PET/CT in diagnosis of solitary pulmonary nodules[J].Chin J Med Imaging Technol, 2013, 29(3):425-428.[17] Al-Ameri A, Malhotra P, Thygesen H, et al.Risk of malignancy in pulmonary nodules:A validation study of four prediction models[J].Lung Cancer, 2015, 89(1):27-30.DOI:10.1016/j.lungcan.2015.03.018. -

 点击查看大图

计量
- 文章访问数: 3089
- HTML全文浏览量: 2075
- PDF下载量: 5