


-
MRI技术在临床疾病的诊断和疗效评价中日益得到广泛应用。但MR扫描速度慢、检查效率低,往往难以满足临床需求。用户一般通过减少信号平均次数(number of signals averaged,NSA)和(或)重复时间(time of repeation,TR)等修改扫描参数的方法加快扫描速度,但往往随意性大,也缺乏必要的修改扫描参数前、后所得成像结果的比较评价;而扫描序列的合理应用和参数的最优化选择又是影响图像质量进而影响诊断结果的重要因素[1]。尤其对于新购设备,应根据MRI信噪比(signal-to-noise ratio,SNR)等理论进行各种扫描条件优化实验,以寻找合理的扫描参数[2]。鉴于MRI技术的复杂性,把握扫描参数的合理性和最优化并不容易,需要在所用扫描序列本身构成参数和影响图像质量的其他共用参数之间进行折中。就修改扫描参数以加快MR扫描速度而言,应当在不改变序列图像性质并确保图像质量符合诊断要求的前提下,进行扫描参数的合理修改和验证,否则将存在导致不当显像结果的可能。本研究选择临床广泛应用的自旋回波(spin-echo,SE)序列,通过模型模拟和图像质量比较,探讨修改扫描参数以加速MR扫描的方法,以期为用户提供参考。
-
采用荷兰Philips Achieva 1.5T MRI系统、16通道相控阵Neuro Vascular线圈(NV线圈)、系统专用质量控制模型。系统软件版本为Release 3.2.3。
-
用专用模型托将模型置于NV线圈中,激光定位视野(field of view,FOV)中心,模型纵轴平行于检查床纵轴,左右对称。实验过程中保持模型位置不变,扫描范围包括整个模型。先在横轴位(transverse,Tra)定位图上将扫描FOV调整到刚好包含模型(210 mm×210 mm),并以仪器制造商提供的颈部软组织Tra SE平扫T1加权、T2加权原始序列扫描模型,层厚5 mm,层间距0.5,共扫描18层。然后复制上述序列,在数据采集界面的“Geometry、Contrast”等选项中分别进行参数修改。每修改一项的同时观察其他参数和扫描时间的变化情况。记录修改后有扫描时间变化的对应参数,并分别扫描模型,直到出现冲突(conflicts)提示或目测观察图像视觉效果明显变差为止。T1加权、T2加权序列扫描参数修改前、后比较分别见表 1、表 2。
项目 修改前 修改后 Min.TR/ms 628 572 TE/ms 8.6 16 ACQ Matrix 232×199 264×208 Voxel size(AP/RL)/mm 0.9/1.05 0.8/1.0 Refocusing control no yes(140deg)b TE spacing/ms - 8 Profile order low_high asymmetric SENSE no yes(RL 1.3)c NSA 4 4 TSD/(min:s) 02:30.6a 01:52.1a 注:表中,Min.TR:最小重复激励时间;TE:回波时间;ACQ Matrix:采集矩阵;Voxel size(AP/RL):体素大小(前后/左右);Refocusing control:重聚控制;TE spacing:回波时间间隔;Profile order:相位编码顺序;SENSE:并行采集;NSA:信号平均次数;TSD:总扫描时间;a:02:30.6和01:52.1分别表示T1加权序列参数修改前、后的总扫描时间,单位表示为min:s,即150.6 s和112.1 s;b:deg是degree的缩写,表示重聚控制角度为140°,是参数选项中的原始表示形式;c:RL表示方向,是指右向左并行采集的加速因子为1.3,也是参数选项中的原始表示形式。 表 1 T1加权序列扫描参数修改前、后比较
Table 1. Comparison of the scanning parameters of T1-weighted sequences before and after the modification
项目 修改前 修改后 Act TR/ms 2500a 2500a Min.TR/ms 1596 1445b TE/ms 80 71 ACQ Matrix 232×187 232×188 Voxel size(RL/AP)/mm 0.9/1.1 0.9/1.05 Refocusing control no yes(120deg) TSE factor 22 29 Water-fat shift 2 pixels maximum DRIVE no yes NSA 4 4 TSD/(min:s) 03:00.0c 02:20.0c 注:表中,Act TR:实际重复激励时间;Min.TR:最小重复激励时间;TE:回波时间;ACQ Matrix:采集矩阵;Voxel size(RL/AP):体素大小(左右/前后);Refocusing control:重聚控制;TSE factor:快速自旋回波因子;Water-fat shift:水/脂肪位移;DRIVE:驱动平衡;NSA:信号平均次数;TSD:总扫描时间;a:修改前、后的实际扫描重复时间均为2500;b:修改后的Min.TR较修改前减小,可能说明其选择的范围较修改前大;c:03:00.0和02:20.0分别表示T2加权序列参数修改前、后的总扫描时间,单位表示为min:s,即:180.0 s和140.0 s。 表 2 T2加权序列扫描参数修改前、后比较
Table 2. Comparison of the scanning parameters of T2-weighted sequences before and after the modification
-
以参数修改前的均匀区Tra图像为基础,目测比较参数修改后各组图像的视觉效果。选择修改后无明显差异,且扫描时间最短的一组扫描参数作为与修改前进行对比分析的对象。分别记录参数修改前、后T1加权、T2加权序列的总扫描时间(total scan duration,TSD)。
-
采用T1加权、T2加权原始序列和1.2.2中选定的修改后对应序列,分别于Tra方向以相同层数、层厚、层间距扫描模型相同区域。每个序列扫描3次,每次间隔1周。
-
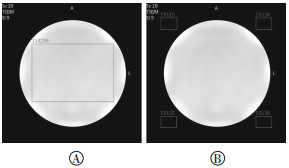
(1)由3位高年资MR医师或技师以“没有差异、稍有差异”2个等级分别目测评价图像视觉效果和定量评价实验结果。当结论不一致时,采纳2人一致者。(2)将图像大小、窗宽、窗位调整到相同标准,分别目测比较1.2.3中对应序列相同层面均匀区和线性区Tra图像的均匀性、清晰度和图像畸变情况等。(3)采用仪器自带profile技术,分别对1.2.3中对应序列、层面、位置的Tra图像作均匀区和线性区X轴方向profile,比较参数修改前、后对应序列图像内部像素的信号变化情况。(4)采用仪器自带ROI技术,分别定量分析1.2.3中对应序列、层面、位置和面积的ROI在参数修改前、后均匀区Tra图像的SNR和非均匀性(non-uniformity,NU)。ROI的位置、大小分别如图 1中A、B所示。采用一幅图像测量方法测量SNR[3]:SNR=(S-Sb)/SD,式中,S为中央区域信号强度,Sb为背景区域信号强度,SD为中央区域标准偏差,即噪声。然后取SNR测量时像素计数的最大值(Smax)和最小值(Smin)用以下公式计算NU:NU=[1-(Smax-Smin)/(Smax+Smin)]×100%[4]。(5)记录并比较1.2.3中对应序列3次Tra图像的SNR、NU平均值。
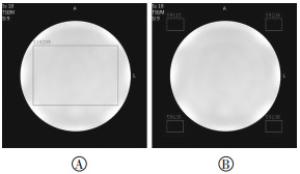
图 1 测量SNR、NU和Sb的ROI
Figure 1. ROIs for the SNR, NU and Sb measurement
-
用SPSS17.0统计学软件对定量数据的均值分别进行参数修改前、后的配对t检验分析。P<0.05表示差异有统计学意义。
-
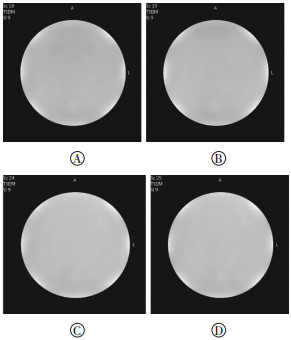
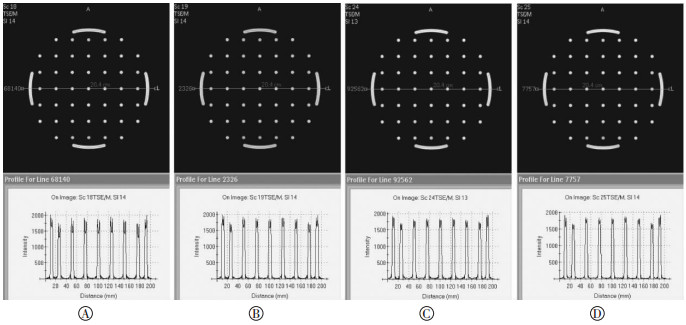
3位评价者均认为相应序列模型均匀区和线性区图像的视觉效果和profile曲线的形态、宽度和振幅在扫描参数修改前、后没有差异,如图 2~图 4所示。
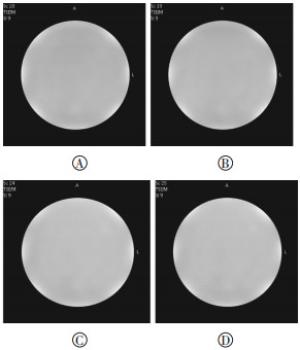
图 2 参数修改前、后均匀区Tra图像视觉效果比较
Figure 2. Visual effect comparison of the transverse images in the uniform regions before and after the parameters were modified
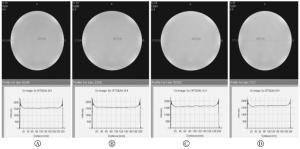
图 3 参数修改前、后均匀区profile曲线比较
Figure 3. Comparison of profile curves in the uniform regions before and after the parameters were modified
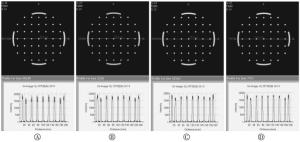
图 4 参数修改前、后线性区profile曲线比较
Figure 4. Comparison of profile curves in the linear regions before and after the parameters were modified
-
T1加权、T2加权序列参数修改后的SNR均值分别为83.17、81.79,较修改前(77.89、79.58)小幅上升,但差异无统计学意义(t=-1.891,P=0.199;t=-1.474,P=0.278);修改后的NU均值分别为6.03、6.89,较修改前(6.99、6.99)小幅下降,但差异亦无统计学意义(t=0.802,P=0.507;t=0.168,P=0.882);而参数修改后的TSD较修改前显著减少,T1加权、T2加权序列分别减少了38.5 s(25.56%)和40.0 s(22.22%)(表 3)。
组别 T1加权 T2加权 SNR/% NU/% TSD/sa SNR/% NU/% TSD/sa 修改前 77.89 6.99 150.6 79.58 6.99 180.0 修改后 83.17 6.03 112.1 81.79 6.89 140.0 差值 -5.28 0.96 38.5 -2.21 0.10 40.0 t值 -1.891 0.802 -b -1.474 0.168 -b P值 0.199 0.507 -b 0.278 0.882 -b 注:表中,SNR:信噪比;NU:非均匀性;TSD:总扫描时间;a:为便于比较,分别将表 1、表 2中最后一行以分钟:秒(min:s)为单位的02:30.6、01:52.1和03:00.0、02:20.0换算成表 3中以秒(s)为单位的数值150.6、112.1和180.0、140.0;b:扫描序列设定后,如果不作修改,每次扫描时间不变,故未对TSD作统计学分析。 表 3 扫描参数修改前、后SNR均值、NU均值、TSD的变化情况
Table 3. Changes in mean SNR, mean NU, and TSD before and after the scanning parameters were modified
-
一般而言,用户修改扫描参数以加速MR扫描的目的主要有以下几方面:①减少扫描过程中患者移动和组织器官生理性搏动或蠕动造成的伪影;②增加体内流动液体或注射对比剂动态显像时的追踪速度或增加周期;③腹部等动态扫描时,缩短患者憋气时间,提高患者的依从性和舒适度;④进一步提高仪器的利用率。但无论出于哪些目的,必须确保扫描参数修改后所得的MR图像、定量数据真实可靠。
根据MRI技术原理,在不考虑仪器硬件因素的情况下,笔者认为影响MR扫描速度的因素主要包括两个方面:其一,所用扫描序列本身的基本构成参数。不同序列的构成参数差异较大,扫描速度差别明显,这也是得到不同性质图像的物理学基础。改变序列构成参数可以改变扫描速度,但也可能改变图像信号成分,图像性质和定量指标会随之变化,最终可能达不到原序列设计的目的。不同人体组织具有不同的T1、T2特性,TR/TE等是构成T1加权、T2加权扫描序列的基本参数。在一定范围内缩小TR/TE可以加快扫描速度,但可能降低组织间图像的对比度,也可能得不到相关组织的真实T1、T2图像。其二,不同序列的共用扫描参数,如扫描层数(Slices)/层厚(Slice Thickness)/间隔(Gap)、NSA、FOV/Matrix/Voxel、扫描范围覆盖率(Scan Persentage)、SENSE、流动补偿(Flow Compensation)、水/脂肪位移(Water-fat shift)/带宽(Bandwidth)、饱和带(REST)、编码方向(Fold Over)等,它们可以是扫描速度的独立影响因素,也可能如FOV/Matrix/Voxel之间具有关联性。改变这些参数均有可能改变扫描速度,但不会改变图像信号构成和性质,只是图像质量(视觉效果和定量数据)可能受到影响。因此,笔者认为对于不熟悉序列构成参数的用户,以不改变原有序列的设计用途并确保图像信号成分不变为前提,对共用扫描参数进行修改,以期在保障图像质量的前提下加快扫描速度,是比较安全的途径。但研究表明,Voxel、SENSE、TE、扩散敏感系数(b值)和扩散梯度方向数等与扩散张量成像时各向异性分数的测量值明显相关[5-6]。因此,如果不对扫描参数修改前、后所得图像及定量指标进行客观评价,一般用户难以控制修改幅度,也不能明确其是否影响诊断结果等。这样就失去了加快扫描速度的意义。
比较表 1、表 2的“项目”栏,影响T1加权、T2加权序列扫描速度的参数有一定差异。通常情况下,NSA对扫描速度影响最为明显:减少NSA即减少了数据采集次数,可以明显加快扫描速度,但同时将显著降低图像的SNR。而MR扫描参数的设置要在保证一定的SNR前提下进行[7],否则可能影响图像的对比度、清晰度、定量数据的可靠性等。可见,以减少NSA来加速MR扫描的方法应当慎重。故本研究力求在不减少原始NSA的基础上,通过修改其他参数如FOV/Matrix/Voxel等来加速MR扫描。Voxel尺寸通常由FOV和Matrix共同确定。就本研究机型而言,FOV与扫描速度呈正相关。将FOV大小调整到刚好全部包含模型,并保持所有扫描序列不变,然后修改Matrix/Voxel来观察扫描速度与图像质量的变化。其他关联参数也以类似方法进行修改、比较,以期获得理想的组合。
图像SNR、NU是评价MR图像质量的常用指标。SNR主要反映图像信号强度与噪声强度的比值,NU反映相同组织图像中信号水平的差异,可用于描述MR系统对均匀物质在图像上表现的均匀一致的程度[8]。由图像计算得到的SNR、NU可综合反映整个MR系统的性能状态;此外,通过图像作profile,可以反映MR系统硬、软件等原因造成的图像内部像素信号分布差异等情况[8]。因此,本研究应用相同模型和图像显示标准,以Tra图像的SNR、NU和X轴方向profile曲线来比较扫描参数修改前、后的图像质量。结果表明,对应序列均匀区和线性区图像以及profile曲线视觉效果均没有差异,SNR、NU的变化差异也没有统计学意义,但参数修改后明显加快了扫描速度(TSD减少)。可见,本研究以忠于原有序列的设计用途为标准,在不改变原有序列图像性质的前提下完成实验,所提供的方法在一定程度上避免了MR扫描参数修改的随意性和盲目性。通过比较参数修改前、后两组模型图像的视觉效果,以及SNR、NU等定量参数的异同,基本证明了修改参数加快MR扫描速度是可行的。
然而,影响MR扫描速度的参数众多,需要反复修改、比较,过程非常复杂。根据笔者的经验,应注意分别平衡FOV/Matrix/Voxel、水/脂肪位移/带宽等关联参数,合理设定Min.TR、DRIVE、SENSE、TSE factor等,并根据参数设置的冲突提示来进行调整,这样可以在确保图像质量的同时加速MR扫描。但是由于篇幅限制,笔者未对表 1、表 2中的单项及关联参数之间的变动对扫描速度的影响,以及表 3中修改后的SNR、NU变化原因等展开讨论。此外,本研究测量SNR时发现FOV内背景区域信号强度并不一致,故采用如图 1中B所示4个区域的平均值。其原因需进一步测试分析。值得注意的是,本研究的实验机型单一、序列较少、实验模型体积较小,虽然模拟临床条件下加速扫描后,模型的图像质量与原始者具有可比性,但与在临床患者中的实际应用可能仍存在差距。因此,尚需不同体型受检者的临床应用比较结果等来进一步验证本研究所提供方法的可靠性。
模型模拟修改部分扫描参数加速MR扫描的方法可行性探讨
Feasibility of accelerating MR scan by modifying part of scanning parameters:a phantom simulation study
-
摘要:
目的 探讨修改部分扫描参数加速MR扫描的方法。 方法 先以仪器制造商提供的颈部软组织横轴位(Tra)自旋回波(SE)平扫T1加权、T2加权序列扫描Philips Achieva 1.5T MRI系统的质量控制模型;然后在数据采集界面的“Geometry、Contrast”等选项中修改视野(FOV)/矩阵(Matrix)/体素(Voxel)、并行采集(SENSE)、最小重复时间(Min.TR)、回波时间(TE)、快速自旋回波因子(TSE factor)等参数,并分别对模型相同区域进行扫描;比较参数修改前、后相应序列的总扫描时间(TSD)、图像视觉效果,并以Tra图像ROI内信噪比(SNR)、非均匀性(NU)和X轴方向profile曲线评价图像质量;采用SPSS17.0软件对相应序列定量数据进行配对t检验分析。 结果 参数修改后T1加权、T2加权序列的TSD比修改前分别减少了38.5 s(25.56%)和40.0 s(22.22%)。目测相应序列均匀区、线性区Tra图像和profile曲线在扫描参数修改前、后没有差异。参数修改前T1加权、T2加权的SNR均值分别为77.89、79.58,修改后为83.17、81.79,较修改前均有上升,但差异无统计学意义(t=-1.891,P=0.199;t=-1.474,P=0.278);参数修改前T1加权、T2加权的NU均值分别为6.99、6.99,修改后为6.03、6.89,较修改前均有下降,但差异无统计学意义(t=0.802,P=0.507;t=0.168,P=0.882)。 结论 模型模拟研究显示,合理修改扫描参数可以在确保图像质量的同时加速MR扫描。 Abstract:Objective To investigate the feasibility of accelerating MR scan by modifying the scanning parameters. Methods First, the spine cho(SE) T1-weighted and T2-weighted sequences of neck soft tissue were used to scan the transverse(Tra) slices of the special quality control phantom of the Philips Achieva 1.5T system. The FOV/Matrix/Voxel, SENSE, Min.TR, TE, and TSE factor were modified in the "Geometry, Contrast" mode of the data acquisition interface to accelerate the scanning speed. The phantom was scanned at the same time the scanning parameters were modified. Finally, the total scan duration(TSD) of the corresponding sequences was compared. The signal-to-noise ratio(SNR), non-uniformity(NU) in the ROI, and profile curve in the X-direction of the Tra images were used to evaluate image quality before and after the scanning parameters were modified. Paired t-test was used to analyze the quantitative data. Results Approximately 38.5 s(25.56%) and 40.0 s(22.22%)were saved corresponded to the T1-weighted and T2-weighted sequences, respectively, after the scanning parameters were modified. Visual differences in the images and profile curves of the corresponding sequences were not found between before and after the modification of scanning parameters. The mean SNRs of the T1-weighted and T2-weighted sequences increased slightly after the modification, but the differences were not significant(t=-1.891, P=0.199;t=-1.474, P=0.278). The mean NUs slightly decreased after the modification, but the differences were also not significant(t=0.802, P=0.507;t=0.168, P=0.882). Conclusion The phantom test showed that the MR scan speed was accelerated and image quality was ensured by modifying the scanning parameters. -
Key words:
- Magnetic resonance imaging /
- Quality control /
- Signal-to-noise ratio /
- Non-uniformity /
- Scan parameter
-
图 2 参数修改前、后均匀区Tra图像视觉效果比较
Figure 2. Visual effect comparison of the transverse images in the uniform regions before and after the parameters were modified
图 3 参数修改前、后均匀区profile曲线比较
Figure 3. Comparison of profile curves in the uniform regions before and after the parameters were modified
图 4 参数修改前、后线性区profile曲线比较
Figure 4. Comparison of profile curves in the linear regions before and after the parameters were modified
表 1 T1加权序列扫描参数修改前、后比较
Table 1. Comparison of the scanning parameters of T1-weighted sequences before and after the modification
项目 修改前 修改后 Min.TR/ms 628 572 TE/ms 8.6 16 ACQ Matrix 232×199 264×208 Voxel size(AP/RL)/mm 0.9/1.05 0.8/1.0 Refocusing control no yes(140deg)b TE spacing/ms - 8 Profile order low_high asymmetric SENSE no yes(RL 1.3)c NSA 4 4 TSD/(min:s) 02:30.6a 01:52.1a 注:表中,Min.TR:最小重复激励时间;TE:回波时间;ACQ Matrix:采集矩阵;Voxel size(AP/RL):体素大小(前后/左右);Refocusing control:重聚控制;TE spacing:回波时间间隔;Profile order:相位编码顺序;SENSE:并行采集;NSA:信号平均次数;TSD:总扫描时间;a:02:30.6和01:52.1分别表示T1加权序列参数修改前、后的总扫描时间,单位表示为min:s,即150.6 s和112.1 s;b:deg是degree的缩写,表示重聚控制角度为140°,是参数选项中的原始表示形式;c:RL表示方向,是指右向左并行采集的加速因子为1.3,也是参数选项中的原始表示形式。  下载: 导出CSV
表 2 T2加权序列扫描参数修改前、后比较
Table 2. Comparison of the scanning parameters of T2-weighted sequences before and after the modification
项目 修改前 修改后 Act TR/ms 2500a 2500a Min.TR/ms 1596 1445b TE/ms 80 71 ACQ Matrix 232×187 232×188 Voxel size(RL/AP)/mm 0.9/1.1 0.9/1.05 Refocusing control no yes(120deg) TSE factor 22 29 Water-fat shift 2 pixels maximum DRIVE no yes NSA 4 4 TSD/(min:s) 03:00.0c 02:20.0c 注:表中,Act TR:实际重复激励时间;Min.TR:最小重复激励时间;TE:回波时间;ACQ Matrix:采集矩阵;Voxel size(RL/AP):体素大小(左右/前后);Refocusing control:重聚控制;TSE factor:快速自旋回波因子;Water-fat shift:水/脂肪位移;DRIVE:驱动平衡;NSA:信号平均次数;TSD:总扫描时间;a:修改前、后的实际扫描重复时间均为2500;b:修改后的Min.TR较修改前减小,可能说明其选择的范围较修改前大;c:03:00.0和02:20.0分别表示T2加权序列参数修改前、后的总扫描时间,单位表示为min:s,即:180.0 s和140.0 s。
下载: 导出CSV
表 3 扫描参数修改前、后SNR均值、NU均值、TSD的变化情况
Table 3. Changes in mean SNR, mean NU, and TSD before and after the scanning parameters were modified
组别 T1加权 T2加权 SNR/% NU/% TSD/sa SNR/% NU/% TSD/sa 修改前 77.89 6.99 150.6 79.58 6.99 180.0 修改后 83.17 6.03 112.1 81.79 6.89 140.0 差值 -5.28 0.96 38.5 -2.21 0.10 40.0 t值 -1.891 0.802 -b -1.474 0.168 -b P值 0.199 0.507 -b 0.278 0.882 -b 注:表中,SNR:信噪比;NU:非均匀性;TSD:总扫描时间;a:为便于比较,分别将表 1、表 2中最后一行以分钟:秒(min:s)为单位的02:30.6、01:52.1和03:00.0、02:20.0换算成表 3中以秒(s)为单位的数值150.6、112.1和180.0、140.0;b:扫描序列设定后,如果不作修改,每次扫描时间不变,故未对TSD作统计学分析。
下载: 导出CSV
-
[1] 倪萍, 陈自谦.磁共振质量保证和质量控制若干问题的探讨[J].中国医疗设备, 2008, 23(6):87-89.DOI:10.3969/j.issn.1674-1633.2008.06.035.
NiP, Chen ZQ.Discussion on quality assurance and quality control of MRI[J].China Med Equip, 2008, 23(6):87-89. doi: 10.3969/j.issn.1674-1633.2008.06.035.[2] 康立丽, 卢广文, 余晓锷, 等.MRI扫描参数与信噪比关系的实验研究[J].中华放射学杂志, 2003, 37(3):225-227.DOI:10.3760/j.issn:1005-1201.2003.03.007.
Kang LL, Lu GW, Yu XE, et al.Experimental research of the relationship between signal-to-noise ratio and scan parameters of MRI[J].Chin J Radiol, 2003, 37(3):225-227. doi: 10.3760/j.issn:1005-1201.2003.03.007.[3] Price RR, Axel L, Morgan T, et al.Quality assurance methods and phantoms for magnetic resonance imaging:report of AAPM nuclear magnetic resonance Task Group No.1[J].Med Phys, 1990, 17(2):287-295. doi: 10.1118/1.596566 [4] National Electrical Manufacturers Association.MS 3-2008(R2014).American National Standard for Determination of Image Uniformity in Diagnostic Magnetic Resonance Images[S].Rosslyn: NEMA, 2008. [5] Santarelli X, Garbin G, Ukmar M, et al.Dependence of the fractional anisotropy in cervical spine from the number of diffusion gradients, repeated acquisition and voxel size[J].Magn Reson Imaging, 2010, 28(1):70-76.DOI:10.1016/j.mri.2009.05.046. [6] Kim SJ, Choi CG, Kim JK, et al.Effects of MR parameter changes on the quantification of diffusion anisotropy and apparent diffusion coefficient in diffusion tensor imaging:evaluation using a diffusional anisotropic phantom[J].Korean J Radiol, 2015, 16(2):297-303.DOI:10.3348/kjr.2015.16.2.297. [7] 杨镜全, 高明勇, 罗素玲, 等.吞咽过程动态MRI的可行性探讨[J].国际放射医学核医学杂志, 2012, 36(1):52-55.DOI:10.3760/cma.j.issn.1673-4114.2012.01.013.
Yang JQ, Gao MY, Luo SL, et al.The feasibility of magnetic resonance imaging of the dynamic swallowing[J].Int J Rad Med Nucl Med, 2012, 36(1):52-55. doi: 10.3760/cma.j.issn.1673-4114.2012.01.013.[8] 陈武凡, 康立丽.MRI原理与技术[M].北京:科学出版社, 2012:96-97.
Chen WF, Kang LL.Magnetic resonance imaging principle and technology[M].Beijing:Science Press, 2012:96-97. -

 点击查看大图
计量
- 文章访问数: 2519
- HTML全文浏览量: 1112
- PDF下载量: 3