


-
扩散峰度成像(diffusion kurtosis imaging,DKI)是基于扩散张量成像(diffusion tensor imaging,DTI)技术上的延伸,为描述组织内非正态分布水分子扩散的一种新的MRI方法。相对于DTI技术,DKI更适于反映组织微观结构的变化[1]。目前关于正常成人视通路DTI的研究可见少量报道[2]。而通过DKI技术可以把水扩散研究从高斯水延伸至非高斯水领域,从而解决了DTI无法解决的多神经纤维交叉问题,能够更加真实地反映组织微观结构的变化[3]。目前,应用DKI技术进行正常成人视通路的研究尚未见报道。视通路的主要结构包括:视神经、视交叉、外侧膝状体、视放射和视皮层等。由于扫描技术的限制,DKI图像中视交叉结构显示不清,本研究将其排除。本研究选择正常成人志愿者进行视通路的不同区域DKI研究,以明确正常成人视通路不同区域随年龄增大的变化规律,为后续对视通路的临床和疾病诊断等研究提供参考。
-
选取我院30名进行颅脑常规MRI检查和视通路DKI检查的正常成人志愿者,其中,男性17名、女性13名,年龄22~73岁,平均年龄(50.6±3.0)岁;按年龄段分为3组:20~39岁组、40~59岁组和60岁以上组,每组10名。所有志愿者均无眼眶疾病或眼部不适症状,临床神经系统检查未见明显阳性体征。颅脑常规MRI的T1加权、T2加权、T2水抑制序列、弥散加权成像等序列图像均未发现明显异常征象。
-
采用美国GE公司Signa EXCITE HD 3.0T超导型MRI仪,常规MR序列包括轴位T1加权、T2加权、T2水抑制序列、弥散加权成像和矢状位T2加权。DKI采用平面回波序列,扫描参数:重复时间6500 ms,回波时间115 ms,视野24 cm,层厚4.0 mm,25个扩散敏感梯度场,b值分别为0、1000、2000 s/mm2。
-
采用美国GE公司Advantage Workstation 4.4工作站的Functool软件进行后处理。在双侧视神经、外侧膝状体、视放射和视皮层区域设置椭圆形ROI。由于视交叉结构在周围脑脊液信号的干扰下,DKI图像显示不清,故排除在本研究之外。ROI均采用软件自带的镜面对称方式放置两侧,双侧ROI面积相同;分别测量每个ROI的平均峰度(mean kurtosis,MK)值、部分各向异性(fractional anisotropy,FA)值和平均扩散率(mean diffusivity,MD),每个ROI重复测量3次,取其平均值。得到ROI区域MK值、FA值和MD。
-
应用SPSS15.0统计学软件处理,计量资料以均数±标准差(x±s)表示,采用单因素方差分析及多组样本均数两两比较和Pearson相关分析。P < 0.05表示差异有统计学意义。
-
本组30名正常成人志愿者均成功完成MRI常规和DKI序列检查,测量并分析了视通路不同部位DKI参数值与年龄的相关性。结果显示:①年龄与视神经区域MK值呈负相关,而与MD呈正相关(图 1);②年龄与外侧膝状体区域MK、FA值均呈负相关,而与MD呈正相关;③年龄与视放射区域FA、MK值呈负相关(图 2);④年龄与视皮层MK值呈负相关(表 1)。

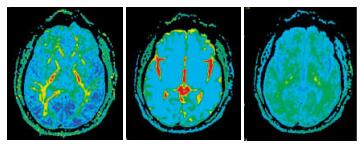
图 1 43岁正常男性志愿者视神经平面部分各向异性值、平均扩散率值、平均峰度值图像
Figure 1. Optic planar figures of fractional anisotropy, mean diffusivity, and mean kurtosis of a 43-year-old male volunteer

图 2 36岁正常女性志愿者视放射平面部分各向异性值、平均扩散率值、平均峰度值图像
Figure 2. Optic radiation planar figures of fractional anisotropy, mean diffusivity, and mean kurtosis of a 36-year-old female volunteer
部位 FA值 MK值 MD r P值 r P值 r P值 视神经 0.331 0.074 -0.634 0.000 0.388 0.034 外侧膝状体 -0.501 0.005 -0.451 0.012 0.424 0.020 视放射 -0.375 0.041 -0.433 0.017 0.355 0.055 视皮层 -0.153 0.420 -0.375 0.041 0.259 0.167 表中,FA:部分各向异性值;MK:平均峰度值;MD:平均扩散率。 表 1 30名正常成人视通路不同部位FA值、MK值、MD与年龄的相关性比较
Table 1. Correlations of age and FA, MD, MK values in different parts of the visual pathway in 30 normal adults
-
20~39岁组和60岁以上组在外侧膝状体、视放射区域的FA值差异均有统计学意义;20~39岁组和40~59岁组在外侧膝状体、视皮层区域的FA值差异也有统计学意义(表 2)。
组别 人数 视神经 外侧膝状体 视放射 视皮层 20~39岁组 10 0.48±0.12 0.53±0.15 0.55±0.09 0.17±0.07 40~59岁组 10 0.46±0.08 0.45±0.06 0.49±0.08 0.11±0.06 60岁以上组 10 0.45±0.05 0.41±0.08 0.43±0.06 0.14±0.04 F值 0.365 6.893 3.995 5.508 P值 0.698 0.004 0.030 0.014 P1值 0.724(0.170) 0.027(0.075) 0.127(0.067) 0.004(0.066) P2值 0.625(0.190) 0.192(0.043) 0.224(0.053) 0.135(0.032) P3值 0.403(0.036) 0.001(0.118) 0.009(0.120) 0.113(0.034) 表中,P值为3组之间比较结果:P1、P2、P3分别为20~39岁组与40~59岁组、40~59岁组与60岁以上组、20 ~39岁组与60岁以上组之间的比较结果,括号中数据为对应的t值。 表 2 30名正常成人各年龄组间视通路不同部位的部分各向异性值比较(x±s)
Table 2. Comparison of fractional anisotropy values in different parts of the visual pathway among each age groups in 30 normal adults(x±s)
-
20~39岁组和60岁以上组在视神经、外侧膝状体、视放射和视皮层区域的MK值差异均有统计学意义。40~59岁组和60岁以上组在视神经、外侧膝状体区域的MK值差异也有统计学意义(表 3)。
组别 人数 视神经 外侧膝状体 视放射 视皮层 20~39岁组 10 0.81±0.12 0.89±0.18 0.98±0.16 0.74±0.09 40~59岁组 10 0.72±0.28 0.85±0.15 0.93±0.29 0.72±0.16 60岁以上组 10 0.60±0.16 0.73±0.10 0.88±0.18 0.68±0.29 F值 10.074 6.413 4.123 2.263 P值 0.001 0.005 0.027 0.123 P1值 0.073(0.089) 0.410(0.038) 0.159(0.052) 0.460(0.020) P2值 0.015(0.124) 0.015(0.118) 0.167(0.051) 0.118(0.036) P3值 0.000(0.213) 0.002(0.156) 0.008(0.103) 0.045(0.056) 表中,P值为3组之间比较结果:P1、P2、P3分别为20~39岁组与40~59岁组、40~59岁组与60岁以上组、20 ~39岁组与60岁以上组之间的比较结果,括号中数据为对应的t值。 表 3 30名正常成人各年龄组间视通路不同部位的平均峰度值比较(x±s)
Table 3. Comparison of mean kurtosis values in different parts of the visual pathway among each age groups in 30 normal adults(x±s)
-
20~39岁组和60岁以上组在视神经、外侧膝状体区域的MD差异有统计学意义。40~59岁组和60岁以上组在外侧膝状体区域的MD差异有统计学意义(表 4)。
组别 人数 视神经 外侧膝状体 视放射 视皮层 20~39岁组 10 0.94±0.16 0.90±0.16 0.81±0.26 1.05±0.24 40~59岁组 10 1.05±0.22 0.87±0.22 0.83±0.15 1.03±0.18 60岁以上组 10 1.09±0.30 1.08±0.33 0.88±0.33 1.17±0.36 F值 3.123 7.760 2.115 2.360 P值 0.060 0.002 0.140 0.114 P1值 0.089(0.075) 0.527(0.036) 0.637(0.015) 0.892(0.129) P2值 0.520(0.046) 0.001(0.207) 0.148(0.047) 0.058(0.145) P3值 0.023(0.065) 0.005(0.171) 0.059(0.062) 0.089(0.016) 表中,P值为3组之间比较结果:P1、P2、P3分别为20~39岁组与40~59岁组、40~59岁组与60岁以上组、20 ~39岁组与60岁以上组之间的比较结果,括号中数据为对应的t值。 表 4 30名正常成人各年龄组间视通路不同部位的平均扩散率比较[(x±s)×10-3 mm2/s]
Table 4. Comparison of mean diffusivity values in different parts of the visual pathway among each age groups in 30 normal adults[(x±s)×10-3 mm2/s]
-
DKI技术作为DTI技术的拓展,是反映组织内非正态分布水分子扩散的一种新方法。与传统的DTI技术比较,DKI的技术优势在于不依赖于组织结构的空间方向,其MK值作为一个反映扩散受限程度的参数,对于探测脑组织灰质和白质微观结构的改变更加灵敏[4]。目前,DKI主要用于中枢神经系统的临床研究,在脑肿瘤、退行性疾病、脱髓鞘疾病和脑血管疾病等方面的研究均取得了初步成果,在体部肿瘤的研究方面也取得了一些初步结果,如前列腺、乳腺方面[5],因此DKI技术具有广阔的临床应用前景[6]。
目前国内外关于正常人大脑DKI的研究表明,MK值随年龄增长逐渐下降,二者呈负相关,可能与组织微观结构,如组织密度、方向、细胞膜完整程度、髓鞘层等的改变有关[7]。有文献应用直方图分析正常成人大脑MK值与年龄的相关性,发现从青年人到老年人的所有白质和灰质峰值均随年龄呈逐渐下降趋势[8]。目前,关于正常成人视通路DKI所得参数与年龄的相关性研究尚未见报道。
本研究结果表明,20~39岁组和60岁以上组相比,视神经、外侧膝状体、视放射和视皮层区域MK值的差异均有统计学意义,表明随着年龄增加,MK值在这些区域均有明显的逐渐下降趋势。20~39岁组和60岁以上组相比,外侧膝状体和视放射区域的FA值差异均有统计学意义,且随着年龄增加,FA值有逐渐下降趋势。可见,FA值与年龄呈负相关(视神经、视皮层区域除外);由于视皮层区灰质结构属于各向同性结构,FA值相当低,所以并不是该区域的敏感指标。本研究中,视放射区FA值的变化与孙鑫等[9]的研究结果存在差异,其研究中视放射区FA值随年龄的变化差异无统计学意义。分析其结果,可能是由于研究对象的年龄差异跨度较小所致,而本研究中研究对象的年龄跨度较大。此外,本研究20~39岁组和60岁以上组相比,视神经、外侧膝状体区域的MD差异有统计学意义,且随着年龄增加,MD与之呈正相关(视放射、视皮层区域除外),表明随着年龄增加,MD在视神经、外侧膝状体区域呈逐渐上升趋势。
本研究探讨了正常成人视通路中MK值与年龄之间的相关性,并初步建立了各年龄组视通路各区域MK值的大致范围,反映了视通路各区域随年龄增加微观结构的改变,为将来研究视通路病变中各区域结构的微观变化及定量分析打下了初步的基础,在定量评估疗效等方面将有更广泛的研究空间。
综上所述,本研究利用DKI技术定量研究视通路与年龄之间的相关性,进一步证明了MK值在检测各向同性组织(如灰质)中的重要作用[10]和高灵敏度,较FA值、MD具有更为显著的优势,后二者在视皮层区域研究中的差异无统计学意义;相信DKI作为一项新技术必将在视通路病变的诊断和鉴别诊断中发挥重要的作用。
扩散峰度成像在正常成人视通路中的应用研究
Application study of diffusion kurtosis imaging in normal adult visual pathway
-
摘要:
目的 应用扩散峰度成像(DKI)定量测量正常成人视通路各区域的平均峰度(MK)值、部分各向异性(FA)值和平均扩散率(MD), 探讨DKI技术在正常成人视通路研究中的应用价值。 方法 按区组随机化选择30名正常成人志愿者, 按年龄分为3组:20~39岁组、40~59岁组和60岁以上组, 每组10名, 均行常规颅脑MR和DKI序列扫描, 并测量视通路不同区域的MK值、FA值和MD, 采用SPSS15.0统计学软件分析MK值、FA值和MD的正常范围, 及其随年龄递增的变化规律。 结果 视神经、外侧膝状体、视放射和视皮层区域MK值与年龄呈负相关; 外侧膝状体、视放射区域FA值与年龄呈负相关; 视神经、外侧膝状体区域MD与年龄呈正相关。 结论 DKI所得参数可以无创性地反映正常成人视通路随年龄增长的微观结构的变化。 Abstract:Objective To explore the application value of diffusion kurtosis imaging(DKI) in normal adult visual pathway in the change of mean kurtosis(MK), fractional anisotropy(FA), and mean diffusion(MD) coefficient. Methods DKl was used to measure MK, FA and MD in different regions of the normal adult visual pathway of 10 young adults(20 years to 39 years), 10 middle-aged adults(40 years to 59 years), and 10 senior adults(> 60 years). The normal range of MK, FA and MD values and its variation with increasing age were analyzed using SPSS 15.0 statistical analysis software. Results The MK values of the optic nerve, lateral geniculate nucleus, optic radiation, and optic cortex were significantly different and negatively correlated. The FA values of the lateral geniculate nucleus and optic radiation were significantly different and negatively correlated. The MD values of the optic nerve and lateral geniculate nucleus were significantly different and positively correlated. Conclusion The DKI parameters can non-invasively reflect the changes in the microstructure of the normal adult visual pathway. -
Key words:
- Diffusion kurtosis imaging /
- Mean kurtosis /
- Fractional anisotropy /
- Mean diffusivity
-
图 1 43岁正常男性志愿者视神经平面部分各向异性值、平均扩散率值、平均峰度值图像
Figure 1. Optic planar figures of fractional anisotropy, mean diffusivity, and mean kurtosis of a 43-year-old male volunteer
图 2 36岁正常女性志愿者视放射平面部分各向异性值、平均扩散率值、平均峰度值图像
Figure 2. Optic radiation planar figures of fractional anisotropy, mean diffusivity, and mean kurtosis of a 36-year-old female volunteer
表 1 30名正常成人视通路不同部位FA值、MK值、MD与年龄的相关性比较
Table 1. Correlations of age and FA, MD, MK values in different parts of the visual pathway in 30 normal adults
部位 FA值 MK值 MD r P值 r P值 r P值 视神经 0.331 0.074 -0.634 0.000 0.388 0.034 外侧膝状体 -0.501 0.005 -0.451 0.012 0.424 0.020 视放射 -0.375 0.041 -0.433 0.017 0.355 0.055 视皮层 -0.153 0.420 -0.375 0.041 0.259 0.167 表中,FA:部分各向异性值;MK:平均峰度值;MD:平均扩散率。  下载: 导出CSV
表 2 30名正常成人各年龄组间视通路不同部位的部分各向异性值比较(x±s)
Table 2. Comparison of fractional anisotropy values in different parts of the visual pathway among each age groups in 30 normal adults(x±s)
组别 人数 视神经 外侧膝状体 视放射 视皮层 20~39岁组 10 0.48±0.12 0.53±0.15 0.55±0.09 0.17±0.07 40~59岁组 10 0.46±0.08 0.45±0.06 0.49±0.08 0.11±0.06 60岁以上组 10 0.45±0.05 0.41±0.08 0.43±0.06 0.14±0.04 F值 0.365 6.893 3.995 5.508 P值 0.698 0.004 0.030 0.014 P1值 0.724(0.170) 0.027(0.075) 0.127(0.067) 0.004(0.066) P2值 0.625(0.190) 0.192(0.043) 0.224(0.053) 0.135(0.032) P3值 0.403(0.036) 0.001(0.118) 0.009(0.120) 0.113(0.034) 表中,P值为3组之间比较结果:P1、P2、P3分别为20~39岁组与40~59岁组、40~59岁组与60岁以上组、20 ~39岁组与60岁以上组之间的比较结果,括号中数据为对应的t值。
下载: 导出CSV
表 3 30名正常成人各年龄组间视通路不同部位的平均峰度值比较(x±s)
Table 3. Comparison of mean kurtosis values in different parts of the visual pathway among each age groups in 30 normal adults(x±s)
组别 人数 视神经 外侧膝状体 视放射 视皮层 20~39岁组 10 0.81±0.12 0.89±0.18 0.98±0.16 0.74±0.09 40~59岁组 10 0.72±0.28 0.85±0.15 0.93±0.29 0.72±0.16 60岁以上组 10 0.60±0.16 0.73±0.10 0.88±0.18 0.68±0.29 F值 10.074 6.413 4.123 2.263 P值 0.001 0.005 0.027 0.123 P1值 0.073(0.089) 0.410(0.038) 0.159(0.052) 0.460(0.020) P2值 0.015(0.124) 0.015(0.118) 0.167(0.051) 0.118(0.036) P3值 0.000(0.213) 0.002(0.156) 0.008(0.103) 0.045(0.056) 表中,P值为3组之间比较结果:P1、P2、P3分别为20~39岁组与40~59岁组、40~59岁组与60岁以上组、20 ~39岁组与60岁以上组之间的比较结果,括号中数据为对应的t值。
下载: 导出CSV
表 4 30名正常成人各年龄组间视通路不同部位的平均扩散率比较[(x±s)×10-3 mm2/s]
Table 4. Comparison of mean diffusivity values in different parts of the visual pathway among each age groups in 30 normal adults[(x±s)×10-3 mm2/s]
组别 人数 视神经 外侧膝状体 视放射 视皮层 20~39岁组 10 0.94±0.16 0.90±0.16 0.81±0.26 1.05±0.24 40~59岁组 10 1.05±0.22 0.87±0.22 0.83±0.15 1.03±0.18 60岁以上组 10 1.09±0.30 1.08±0.33 0.88±0.33 1.17±0.36 F值 3.123 7.760 2.115 2.360 P值 0.060 0.002 0.140 0.114 P1值 0.089(0.075) 0.527(0.036) 0.637(0.015) 0.892(0.129) P2值 0.520(0.046) 0.001(0.207) 0.148(0.047) 0.058(0.145) P3值 0.023(0.065) 0.005(0.171) 0.059(0.062) 0.089(0.016) 表中,P值为3组之间比较结果:P1、P2、P3分别为20~39岁组与40~59岁组、40~59岁组与60岁以上组、20 ~39岁组与60岁以上组之间的比较结果,括号中数据为对应的t值。
下载: 导出CSV
-
[1] Hui ES, Cheung MM, Qi LQ, et al.Towards better MR characterization of neural tissues using directional diffusion kurtosis analysis[J].Neuroimage, 2008, 42(1):122-134.DOI:10.1016/j.neuroimage.2008.04.237. [2] 宛四海, 张雪林, 孙鑫, 等.正常成人视放射的磁共振扩散张量成像和扩散张量纤维束成像研究[J].南方医科大学学报, 2008, 28(3):396-398.DOI:10.3321/j.issn:1673-4254.2008.03.047.Wan
SH, Zhang XL, Sun X, et al.Optic radiation in normal adults:a study using magnetic resonance diffusion tensor imaging and diffusion tensor tractography[J].J South Med Univ, 2008, 28(3):396-398. doi: 10.3321/j.issn:1673-4254.2008.03.047.Wan[3] Raab P, Hattingen E, Franz K, et al.Cerebral gliomas:diffusional kurtosis imaging analysis of microstructural differences[J].Radiology, 2010, 254(3):876-881.DOI:10.1148/radiol.09090819. [4] Falangola MF, Jensen JH, Babb JS, et al.Age-related non-Gaussian diffusion patterns in the prefrontal brain[J].J Magn Reson Imaging, 2008, 28(6):1345-1350.DOI:10.1002/jmri.21604. [5] 刘慧婷.乳腺病变的扩散峰度模型研究[J].国际医学放射学杂志, 2014, 37(4):97-98.
Liu HT.Diffusion kurtosis imaging model of breast lesions[J].Int J Med Radiol, 2014, 37(4):97-98.[6] 曾丁巳, 肖新兰.扩散峰度成像(DKI)在中枢神经系统的应用[J].临床放射学杂志, 2011, 30(9):1400-1402.
Zeng DS, Xiao XL.Application of diffusion kurtosis imaging in the central nervous system[J].J Clin Radiol, 2011, 30(9):1400-1402.[7] Lätt J, Nilsson M, Wirestam R, et al.Regional values of diffusional kurtosis estimates in the healthy brain[J].J Magn Reson Imaging, 2013, 37(3):610-618.DOI:10.1002/jmri.23857. [8] 郑慧鑫, 张辉, 王效春, 等.扩散峰度成像在正常成人脑组织中的应用价值[J].山西医科大学学报, 2014, 45(4):275-277, 284.DOI:10.13753/j.issn.1007-6611.2014.04.006.Zheng
Zheng HX, Zhang H, Wang XC, et al.Value of diffusion kurtosis imaging in normal adult brain[J].J Shanxi Med Univ, 2014, 45(4):275-277, 284. doi: 10.13753/j.issn.1007-6611.2014.04.006.Zheng[9] 孙鑫, 肖新兰, 黄海青.磁共振DTI和DTT在正常成人视放射中的初步应用[J].中国临床医学影像杂志, 2008, 19(12):893-895.DOI:10.3969/j.issn.1008-1062.2008.12.016.SunX,
Sun X, Xiao XL, Huang HQ.Initial application of MR DTI and DTT in normal adult optic radiation[J].J Chin Clin Med Imaging, 2008, 19(12):893-895. doi: 10.3969/j.issn.1008-1062.2008.12.016.SunX,[10] Cheung MM, Hui ES, Chan KC, et al.Does diffusion kurtosis imaging Lead to better neural tissue characterization? A rodent brain maturation study[J].Neuroimage, 2009, 45(2):386-392.DOI:10.1016/j.neuroimage.2008.12.018. -

 点击查看大图

计量
- 文章访问数: 2566
- HTML全文浏览量: 1133
- PDF下载量: 2