


-
前列腺癌是老年男性最常见的恶性肿瘤之一[1]。随着前列腺特异性抗原(prostate specific antigen,PSA)、直肠指诊等诊断方法的不断进步与普及,更多的早期前列腺癌被检出[2]。通过手术、放疗等治疗手段,其治愈率也得到显著提高[3]。准确地预测前列腺癌病理特征可以帮助前列腺癌患者选择更加适合的治疗方案,从而提高治愈率。Partin表是通过4133例大样本统计分析得到的图表[4]。本研究将通过比较MRI与Partin表对术后器官局限性癌(organ-confined disease,OCD)、包膜侵犯(established capsular penetration,ECP)、精囊侵犯(seminal vesicle involvement,SVI)以及淋巴结转移(lymph nodal involvement,LNI)4个病理特征的预测结果,对二者的准确性进行分析。
-
随机选取2012年1月至2014年2月于天津医科大学第二医院行根治性前列腺切除术及盆腔淋巴结活检、病理证实为前列腺癌的患者51例,年龄58~80岁。所有患者术前均行磁共振检查,具有完整的MRI影像学资料,包括轴位、冠状位及矢状位的T1加权成像和T2加权成像,以及轴位的磁共振弥散加权图像。Partin表的入选标准[4]:经前列腺穿刺活检或尿道前列腺电切术后病理确诊为前列腺癌,并且有标准Gleason评分资料;前列腺癌临床分期明确,并根据美国癌症联合委员会(American Joint Committee on Cancer,AJCC)TNM分期系统[5]判定为T1、T2或T3a期;具备术前本院PSA检查结果(Hybritech法检测,正常值< 4 ng/ml),且PSA检测时间在前列腺穿刺或经尿道前列腺电切术4周后;术前未接受任何形式的新辅助治疗,包括激素治疗、放疗或者化疗。
本研究中的所有患者SPECT骨扫描证实均无骨转移,前列腺酸性磷酸酶正常。最终病理分期判断采用了向高分期偏倚的方法,即如果患者同时存在OCD和ECP,则作为ECP对待。
-
MRI检查方法:使用美国GE 1.5T Signa Echo speed磁共振扫描仪,以体线圈为射频发射线圈。前列腺局部行横轴位和矢状位快速自旋回波序列扫描,包括横轴位和矢状位:脉冲序列重复时间为3500 ms,回波时间85 ms,回波链19,层厚6 mm,层距0 mm,视野24 cm×24 cm,激励次数4,矩阵320×256。Tl加权成像行横轴位扫描:重复时间为450 ms,回波时间12 ms,层厚3 mm,层距0 mm,视野24 cm×24 cm,激励次数2,矩阵256×192。所有图像由两名有经验的放射科医师采用双盲法进行阅片诊断,对结果不同的病例进行协商一致后得出最终结论。通过MRI对前列腺癌病理特征进行预测,并与手术病理结果对照。
-
Partin表的构建样本为1982年4月至1996年6月,以John Hopkins为主的3个顶级泌尿外科中心的4133例病例资料,Partin提出了联合术前临床分期、PSA及Gleason评分预测前列腺癌术后病理特征的图表。本研究根据患者的PSA检查结果、Gleason评分以及术前临床分期,以1997年版Partin表为标准,查找出每例患者发生对应4种病理特征的一组概率值(取值范围0~1)。
-
使用MedCalc 11.0软件进行统计学分析。为了检验MRI预测前列腺癌病理特征的准确性,将51例患者的MRI预测结果与手术病理分期比较,并计算MRI预测前列腺癌病理特征的灵敏度、特异度。
Partin表预测患者的术后病理特征所得到的结果是一组4个病理特征发生的概率值,这些病理特征即可以为阳性又可以为阴性,因此使用受试者工作特征(receiver operating characteristic,ROC)曲线对该样本进行评价最为理想。选取ROC曲线中灵敏度与特异度之和最大的点作为发生概率的取值临界点,分别将Partin表与MRI的预测结果与最终病理结果比较,绘制Partin表与MRI的ROC曲线,计算二者的曲线下面积(area under curve,AUC),计算公式为Z=|AUC1-AUC2|/sqrt(Se1^2+Se2^2),并通过Z检验的统计学方法比较二者的曲线下面积。
-
本组51例患者中,术后病理证实OCD、ECP、SVI及LNI的患者分别为20例、18例、10例和3例。
-
分析MRI图像,对51例前列腺癌患者病理特征进行预测,OCD患者21例,ECP患者25例,SVI患者5例,LNI患者0例。将预测结果与术后病理结果进行比较,MRI预测4种术后病理特征的ROC曲线及AUC见图 1。MRI预测OCD、ECP、SVI及LNI的准确率、灵敏度、特异度、AUC及临床价值见表 1。
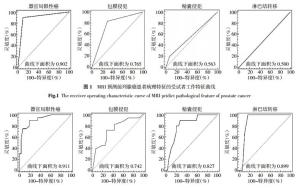
图 1 MRI预测前列腺癌患者病理特征的受试者工作特征曲线
Figure 1. The receiver operating characteristic curve of MRI pridict pathological feature of prostate cancer
病理特征 准确率(%) 灵敏度(%) 特异度 AUC 临床价值 OCD 90.0 90.0 90.3 0.902 较高 ECP 88.3 88.3 69.7 0.765 中等 SVI 20.0 20.0 92.7 0.563 较低 LNI 0 0 100 0.500 无 表中,OCD:器官局限性癌;ECP:包膜侵犯;SVI:精囊侵犯;LNI:淋巴结转移;AUC:曲线下面积。 表 1 MRI预测OCD、ECP、SVI及LNI准确率、灵敏度、特异度、AUC及临床价值
Table 1. The accuracy, sentivity, spectivity, AUC and clinic value of MRI
-
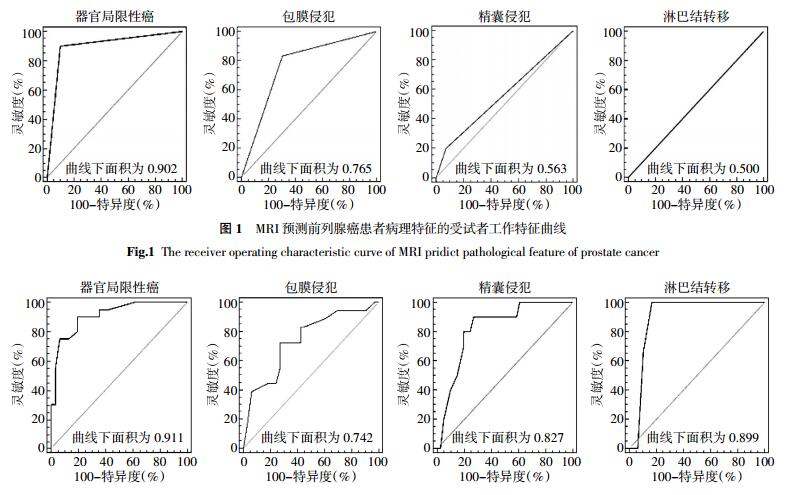
将患者PSA值、临床分期、Gleason评分带入Partin表,预测出的OCD、ECP、SVI及LNI 4种术后病理特征的ROC曲线及AUC见图 2。选取ROC曲线中的相应临界点,Partin表预测出的OCD、ECP、SVI及LNI的灵敏度、特异度、AUC及临床价值见表 2。

图 2 Partin表预测前列腺癌患者病理特征的受试者工作特征曲线
Figure 2. The receiver operating characteristic curve of Partin tables pridict pathological feature of prostate cancer
病理特征 临界点 灵敏度(%) 特异度(%) AUC 临床价值 OCD 0.14 90.00 80.65 0.911 较高 ECP 0.44 72.22 72.73 0.742 中等 SVI 0.24 90.00 73.17 0.827 中等 LNI 0.26 100 83.33 0.899 中等 表中,OCD:器官局限性癌;ECP:包膜侵犯;SVI:精囊侵犯;LNI:淋巴结转移;AUC:曲线下面积。 表 2 Partin表预测OCD、ECP、SVI及LNI灵敏度、特异度、AUC及临床价值
Table 2. The accuracy, sentivity, spectivity, AUC of Partin tables
-
MRI与Partin表ROC曲线下面积比较见表 3。在预测OCD和ECP方面,MRI与Partin表的AUC差异无统计学意义(Z=0.071、0.020,P均 > 0.05);在预测SVI和LNI方面,MRI与Partin表的AUC差异有统计学意义(Z=0.286、0.499,P均 < 0.01)。
器官局限性癌 包膜侵犯 精囊侵犯 淋巴结转移 MRI 0.902(95%CI:0.785~0.967) 0.765(95%CI:0.626~0.872) 0.563(95%CI:0.417~0.702) 0.500(95%CI:0.357~0.643) Partin表 0.911(95%CI:0.798~0.973) 0.742(95%CI:0.600~0.854) 0.827(95%CI:0.695~0.918) 0.899(95%CI:0.782~0.966) Z值 0.071 0.020 0.286 0.499 P值 > 0.05 > 0.05 < 0.01 < 0.01 表 3 MRI与Partin表的受试者工作特征曲线下面积
Table 3. The area under receiver operating characteristic curve of MRI and Partin tables
-
目前,诊断前列腺癌常用的影像学方法有直肠超声、CT和MRI等[6]。相比其他影像学方法,MRI能更清晰地显示组织解剖细节,可更好地显示前列腺、前列腺ECP、SVI及周围正常组织[7]。本研究利用磁共振检查对51例前列腺癌患者进行病理特征预测,在预测OCD与ECP方面具有较高的临床价值,与相关文献报道[8]相近,证明磁共振检查在前列腺癌的术前分期中具有重要作用。目前认为前列腺癌患者的治疗方案选择和判断预后情况与能否准确进行前列腺癌术前分期、淋巴结转移情况的判断等因素相关。MRI作为前列腺癌检查最好的影像学手段,分期诊断是检查的主要目的之一,除基本扫描序列外,动态增强MRI[9]、弥散加权成像[10]及磁共振波谱学[11]等序列也有助于前列腺癌的诊断,应该注意包膜、提肛肌、神经血管束是否受侵,精囊、膀胱是否受累,是否有淋巴结及远处转移。磁共振作为一种可以直观反映前列腺癌发生、发展和影响的影像学检查手段,其在诊治前列腺癌的临床工作中具有重要的意义[12]。
在本研究中,MRI预测了前列腺癌的4种病理特征,MRI预测OCD和ECP 2种病理特征的AUC分别为0.902、0.765,准确率均较高。在预测SVI及LNI方面,AUC未能达到临床应用水平(AUC < 0.7)。通过对MRI和Partin表二者AUC的比较,在预测OCD和ECP方面,二者的AUC差异无统计学意义,表明二者具有相同的诊断价值。而在预测SVI和LNI方面,Partin表的AUC明显大于MRI,表明Partin表预测SVI和LNI的诊断价值高于MRI。因此,Partin表提示SVI和(或)LNI高风险而MRI图像显示阴性的患者应考虑SVI和(或)LNI的可能性大。究其原因,一方面由于早期前列腺癌对SVI不明显,再加上前列腺周围被多个软组织结构包绕,仅依靠MRI诊断存在困难。此外,前列腺本身的原因和近期对前列腺进行的一些检查(如前列腺穿刺活检等)[13],也会影响分期诊断的结果,造成医师治疗上的判断不准确。
本研究以1997年版Partin表为标准,Partin等[14]和Makarov等[15]分别在2001年和2007年重新选取确诊的前列腺癌患者资料,对Partin表进行了两次更新。更新的Partin表放弃了T3a期患者,并将PSA值10.1~20.0 ng/ml及 > 20.1 ng/ml两档合并归为 > 10 ng/ml一档。这些变化将不利于更新的Partin表在高PSA人群内表现出理想的预测准确性。
本研究中,通过ROC曲线分析得知,Partin表预测OCD、ECP、SVI及LNI 4种病理特征的AUC分别为0.911、0.742、0.827、0.899。Kattan[16]利用Hopkins内部数据验证得出的AUC分别为0.834、0.695、0.830、0.888。高旭等[17]同样使用中国患者的数据样本得出的结果为0.685、0.655、0.798、0.742。从二者的结果中可以看出,Partin表预测SVI和LNI的准确率较高,但预测ECP的准确率稍低,预测OCD的准确率有待于进一步研究。虽然Partin表表现出了较好的预测能力,但在实际临床工作中由于涉及到临界点选取的问题,不应只从统计学角度出发,还应考虑有关的医学、伦理学、心理学和经费等问题。如为了保证每个接受前列腺根治性切除术的患者都能达到较好远期效果,临床医师希望尽可能多地筛选人群中具有SVI的患者,建议他们放弃手术,选择外照射等其他治疗手段,那么就应该据此寻找预测灵敏度较高的临界点,此时将有更多的SVI患者都被正确地挑选出来,经过这样挑选的人群,在进行根治手术后会发现,SVI的发生率很低,手术的远期效果将得到提高。而相反情况下,如果希望使无LNI的患者尽可能接受手术,以得到根治的机会,那么就应该选择特异度较高的临界点,此时将有更多的无LNI的患者被准确预测,从而获得了根治手术的机会。
随着MRI磁场强度的不断提高以及新序列[18]、新对比剂[19]的应用,MRI检查有可能进一步提高前列腺癌分期和病理特征预测的准确性。此外,随着Partin表的进一步完善和“本土化”,并与MRI等影像学表现密切结合,可以更好地对前列腺癌的病理特征进行预测[20]。
MRI和1997年版Partin表对前列腺癌病理特征预测准确性的对比研究
Accuracy of MRI and 1997 edition of Partin tables in predicting the pathological features of prostate cancer
-
摘要:
目的 比较MRI与1997年版Partin表对前列腺癌病理特征预测结果的准确性。 方法 随机选取2012年1月至2014年2月51例前列腺癌患者并行根治性前列腺切除术,统计资料具备术前血清前列腺特异性抗原结果、临床分期、Gleason评分、盆腔MRI资料以及术后病理报告。分别将术前MRI及Partin表对前列腺癌器官局限性癌、包膜侵犯、精囊侵犯以及淋巴结转移4种病理特征的预测结果与术后病理结果进行比较,通过受试者工作特征曲线(ROC)分析法检验MRI与Partin表预测前列腺癌病理特征的准确性并进行比较。 结果 应用Partin表预测器官局限性癌、包膜侵犯、精囊侵犯以及淋巴结转移4种病理特征的曲线下面积分别为0.911、0.742、0.827、0.899;应用MRI预测的曲线下面积分别为0.902、0.765、0.563、0.500。MRI与Partin表预测器官局限性癌和包膜侵犯的ROC曲线下面积差异无统计学意义(Z=0.071、0.020,P均>0.05);预测精囊侵犯和淋巴结转移的ROC曲线下面积差异有统计学意义(Z=0.286、0.499,P均 < 0.01)。 结论 Partin表预测前列腺癌4种病理特征具有临床诊断价值;MRI与Partin表预测前列腺癌器官局限性癌、包膜侵犯2种病理特征的准确性差异无统计学意义,Partin表预测精囊侵犯、淋巴结转移2种病理特征的准确性高于MRI。 Abstract:Objective To compare the accuracies of MRI and 1997 edition of Partin tables in predicting the pathological features of prostate cancer. Methods A total of 51 patients with prostate carcinoma underwent radical prostatectomy from January 2012 to February 2014. Preoperative serum prostate specific antigen, clinical stage, biopsy Gleason score, percentage of positive biopsy scores, pelvic MRI, and pathological report of prostatectomy specimen were collected. Postoperative pathological results were compared with MRI results and Partin tables. Receiver operating characteristic curves were plotted to determine the accuracies of MRI and Partin tables in predicting the pathological features of prostate cancer. Results The areas under the curve(AUCs)of the Partin tables to predict organ-confined disease(OCD), established capsular penetration(ECP), seminal vesicle involvement(SVI), and lymph nodal involvement(LNI) were 0.911, 0.742, 0.827, and 0.899, respectively. The corresponding AUCs of MRI were 0.902, 0.765, 0.563, and 0.5. The AUCs of OCD and ECP did not significantly differ between MRI and Partin tables(Z=0.071 and 0.020, both P > 0.05). By contrast, the AUCs of SVI and LNI significantly differed between MRI and Partin tables(Z=0.286 and 0.499, both P < 0.01). Conclusion Partin tables exhibit a high clinical diagnostic value in the prediction of the pathological feature of prostate cancer. The accuracies of predicting OCD and ECP did not significantly differ between MRI and Partin tables. However, Partin tables were more accurate in predicting SVI and LNI than MRI. -
图 1 MRI预测前列腺癌患者病理特征的受试者工作特征曲线
Figure 1. The receiver operating characteristic curve of MRI pridict pathological feature of prostate cancer
图 2 Partin表预测前列腺癌患者病理特征的受试者工作特征曲线
Figure 2. The receiver operating characteristic curve of Partin tables pridict pathological feature of prostate cancer
表 1 MRI预测OCD、ECP、SVI及LNI准确率、灵敏度、特异度、AUC及临床价值
Table 1. The accuracy, sentivity, spectivity, AUC and clinic value of MRI
病理特征 准确率(%) 灵敏度(%) 特异度 AUC 临床价值 OCD 90.0 90.0 90.3 0.902 较高 ECP 88.3 88.3 69.7 0.765 中等 SVI 20.0 20.0 92.7 0.563 较低 LNI 0 0 100 0.500 无 表中,OCD:器官局限性癌;ECP:包膜侵犯;SVI:精囊侵犯;LNI:淋巴结转移;AUC:曲线下面积。  下载: 导出CSV
表 2 Partin表预测OCD、ECP、SVI及LNI灵敏度、特异度、AUC及临床价值
Table 2. The accuracy, sentivity, spectivity, AUC of Partin tables
病理特征 临界点 灵敏度(%) 特异度(%) AUC 临床价值 OCD 0.14 90.00 80.65 0.911 较高 ECP 0.44 72.22 72.73 0.742 中等 SVI 0.24 90.00 73.17 0.827 中等 LNI 0.26 100 83.33 0.899 中等 表中,OCD:器官局限性癌;ECP:包膜侵犯;SVI:精囊侵犯;LNI:淋巴结转移;AUC:曲线下面积。
下载: 导出CSV
表 3 MRI与Partin表的受试者工作特征曲线下面积
Table 3. The area under receiver operating characteristic curve of MRI and Partin tables
器官局限性癌 包膜侵犯 精囊侵犯 淋巴结转移 MRI 0.902(95%CI:0.785~0.967) 0.765(95%CI:0.626~0.872) 0.563(95%CI:0.417~0.702) 0.500(95%CI:0.357~0.643) Partin表 0.911(95%CI:0.798~0.973) 0.742(95%CI:0.600~0.854) 0.827(95%CI:0.695~0.918) 0.899(95%CI:0.782~0.966) Z值 0.071 0.020 0.286 0.499 P值 > 0.05 > 0.05 < 0.01 < 0.01
下载: 导出CSV
-
[1] Ferlay J, Shin HR, Bray F, et al. Estimates of worldwide burden of cancer in 2008:GLOBOCAN 2008[J]. Cancer, 2010127):2893-2917. [2] Siegel R, Naishadham D, Jemal A. Cancer statistics, 2012[J]. CA Cancer J Clin, 2012, 621):10-29. doi: 10.3322/caac.20138 [3] Epstein JI, Partin AW, Sauvageot J, et al. Prediction of progression following radical prostatectomy. A multivariate analysis of 721 men with long-term follow-up[J]. Surg Pathol, 1996, 203):286-292. [4] Partin AW, Kattan MW, Subong EN, et al. Combination of prostate-specific antigen, clinical stage, and Gleason score to predict pathological stage of localized prostate cancer. A multi-institutional update[J]. JAMA, 1997, 27718):1445-1451. doi: 10.1001/jama.1997.03540420041027 [5] Schroder FH, Hermanek P, Denis L, et al. The TNM classification of prostate cancer[J]. Prostate Suppl, 19924):129-138. [6] Soylu FN, Eggener S, Oto A. Local staging of prostate cancer with MRI[J]. Diagn interv Radiol, 2012, 184):365-373. [7] Tanaka H, Hayashi S, Ohtakara K, et al. Usefulness of CT-MRI fusion in radiotherapy planning for localized prostate cancer[J]. Radiat Res, 2011, 526):782-788. doi: 10.1269/jrr.11053 [8] 晋晖. 3.0T磁共振对前列腺外周带癌的诊断价值[J].中国医疗前沿, 2013, 87):97-98.
[9] 李春媚, 陈敏, 李飒英, 等.前列腺癌MR动态增强扫描定量分析及其应用[J].中华放射学杂志, 2011, 455):508-5l0. doi: 10.3760/cma.j.issn.1005-1201.2011.05.023
[10] Doo KW, Sung DJ, Park BJ, et al. Detectability of low and intermediate or high risk prostate cancer with combined T2-weighted and diffusion-weighted MRI[J]. Eur Radiol, 2012, 228):1812-1819. doi: 10.1007/s00330-012-2430-5 [11] 赵阳, 徐勇, 韩悦, 等. MR波谱成像对前列腺癌分化程度预估价值的初步研究[J].中华放射学杂志, 2011, 4510):951-954. doi: 10.3760/cma.j.issn.1005-1201.2011.10.014
[12] Nix Jw, Turkhey B, Hoang A, et al.Very distal apical prostate tumors:identification on multiparametric MRI at 3 Tesla[J]. BJU Int, 2012, 11011 Pt B):694-700. [13] Kaji Y, Kurhanewicz J, Hricak H, et al. Localizing prostate cancer in the presence of post biopsy changes on MR images:role of proton MR spectroscopic imaging[J]. Radiology, 1998, 2063):785-790. [14] Partin AW, Mangold LA, Lamm DM, et al. Contemporary update of prostate cancer staging nomogramsPartin Tables)for the new millennium[J]. Urology, 2001, 586):843-848. doi: 10.1016/S0090-4295(01)01441-8 [15] Makarov DV, Trock BJ, Humphreys EB, et al. Updated nomogram to predict pathologic stage of prostate cancer given prostate specific antigen level, clinical stage, and biopsy Gleason scorePartin tables)based on cases from 2000 to 2005[J]. Urology, 2007, 696):1095-1101. doi: 10.1016/j.urology.2007.03.042 [16] Kattan MW. Re:Updated nomogram to predict pathologic stage of prostate cancer given prostate-specific antigen level, clinical stage, and biopsy gleason scorePartin Tables) based on cases from 2000 to 2005[J]. Eur Urol, 2007, 525):1528. [17] 高旭, 孙颖浩, 许传亮, 等.应用Partin tables预测国人前列腺癌术后病理特征准确性的研究[J].中华泌尿外科杂志, 2007, 289):614-618. doi: 10.3760/j.issn:1000-6702.2007.09.010
[18] Ren J, Huan Y, Wang H, et al. Seminal vesicle invasion in prostate cancer:prediction with combined T2-weighted and diffusion-weighted MR imaging[J]. Eur Radiol, 2009, 1910):2481-2486. doi: 10.1007/s00330-009-1428-0 [19] Wang YJ. Superparamagnetic iron oxide based MRI contrast agents:Current status of clinical application[J]. Quant Imaging Med Surg, 20111):35-40. [20] Hentschel B, Oehler W, Strauss D, et al. Definition of the CTV prostate in CT and MRI by using CT-MRI image fusion in IMRT planning for prostate cancer[J]. Strahlenther Onkol, 2011, 1873):183-190. doi: 10.1007/s00066-010-2179-1 -

 点击查看大图
计量
- 文章访问数: 2870
- HTML全文浏览量: 1396
- PDF下载量: 3