


-
肿瘤体积的大小直接影响放疗靶区的划定,但由于肺部呼吸运动引起靶组织位移的原因,常常影响瘤体体积的判定。早期文献报道采用呼吸门控PET/CT有助于肺部占位体积的精确计算[1-2],近年来文献大多报道了四维PET与三维PET相比肿瘤位置的变化,也有关于体积变化的研究[3]。此外,四维CT通过对一个呼吸周期内不同呼吸时期肿瘤体积的连续捕捉,有效减轻了呼吸运动产生的伪影,从而得到了广泛应用。许多学者比较了四维CT体积与三维CT体积的差别[4-6],以获得对肿瘤靶区的准确勾画。
本研究通过对肺部肿瘤进行呼吸门控PET/CT采集与常规采集,比较肺部不同位置结节的四维PET体积与三维PET体积的差别,以及四维CT体积与三维CT体积的差别,给予肺部肿瘤放疗靶区勾画指导,最终使患者接受合理的照射剂量。
-
收集2011年5月至2012年11月在山西医科大学第一医院核医学科进行PET/CT检查的患者17例,平均年龄(63.5±8.6)岁。收集标准:①行常规PET/CT发现肺部有恶性肺结节;②经患者同意并签署知情同意书后对肺结节行延迟显像及呼吸门控PET/CT。
-
仪器为美国GE Discovery VCT PET/CT仪;呼吸运动实时监测系统为美国Varian公司实时跟踪系统。后处理工作站为美国GE AW4.4工作站。
常规采集:按5.55~7.40 MBq/kg体重注射18F-FDG,显像前排空膀胱,扫描范围从颅顶到股骨近端。注射18F-FDG后患者静卧休息40~65 min。CT扫描条件:120 kV,80 mA,层厚3.75 mm。PET图像采集采用三维模式,约6~7个床位,2 min/床位。
延迟显像:于注射18F-FDG后2 h进行,扫描范围为一个床位,2 min/床位,并将肺结节尽量置于显像范围中心。其余条件同上。
呼吸门控PET/CT图像采集:行常规PET/CT延迟显像后,保持患者体位不变,紧接着行呼吸门控PET/CT显像。同样将要研究的肺结节尽量置于显像范围中心。扫描时要求患者均匀呼吸。CT呼吸门控扫描采用“后门控”技术,在同一CT扫描视野范围内进行1个呼吸周期内的四维CT动态扫描。把1个周期分成6个时相,呼吸控制系统则连续记录CT曝光的时相信息,并同时记录呼吸节律信号。CT扫描条件:120 kV,30 mA,层厚2.5 mm。PET扫描在接收到呼吸信号的触发后进行,设置为6个时相,1 min/时相。CT图像的“后门控”处理在后台工作站上进行,先对呼吸曲线设置不同的相位值,吸气末为0,呼气末为50%,下—个吸气末为100%。CT呼吸门控图像在后处理工作站自动划分为6个时相的呼吸门控系列图像。之后将数据传到前台,用后重建软件对各个时相的PET图像进行新的重建。重建时采用其对应时相的CT图像作衰减校正,从而实现呼吸运动后的PET衰减校正,并与非门控的平均衰减校正结果进行对比。
-
PET图像处理:三维PET体积、6个时相的四维PET体积、最大密度投影法(maximum intensity projection,MIP)得到的平均四维PET体积的测量均在后处理工作站中勾画肿瘤靶区的SIM软件中进行。采用阈值法勾画肿瘤靶区,软件可以设置从0到100%范围内不同大小的阈值自动勾画肿瘤靶区,之后软件自动计算出结节体积,期间无人为误差。
CT图像处理:三维CT体积、6个时相的四维CT体积的测量也均在后处理工作站中勾画肿瘤靶区的SIM软件中进行。由一名有3年工作经验的放疗科医师勾画肿瘤靶区,采用肺窗,窗宽为1250,窗位为-600,通过软件计算得到体积。
将每个结节的6个时相的四维PET体积相加计算平均值,将MIP法得到的平均四维PET体积与三维PET体积比较;将6个时相的四维CT体积相加计算平均值,并与三维CT体积比较;从结节位置、运动幅度分析,以体积相对差值[即:(平均四维体积-三维体积)/三维体积)]作为体积间的差异,研究呼吸门控PET/CT对四维体积与三维体积的影响。
-
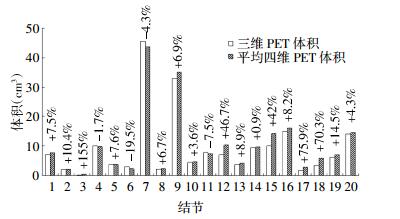
本研究共20个恶性肺结节(表 1),其中5个位于上肺,2个贴近胸膜,6个位于肺门,7个位于下肺。运动幅度为1.0~6.4 mm,平均3.3 mm。对每个结节进行常规PET/CT采集,得到三维PET体积,后进行呼吸门控PET/CT采集,分别用40%阈值法和MIP法两种方法测量得到平均四维PET体积。所有结节的三维PET体积为9.5 cm3,40%阈值法得到的平均四维PET体积为9.7 cm3,比三维PET体积大14.4%;MIP法得到的平均四维PET体积为11.0 cm3,比三维PET体积大20%。
结节序号 位置 运动幅度(mm) 三维PET体积(cm3) 平均四维PET体积(cm3) 40%阈值法 最大密度投影法 1 上肺 4.1 7.0 7.4 8.1 2 上肺 1.0 2.0 2.1 2.2 3 上肺 1.5 0.2 0.6 0.4 4 上肺 1.5 10.1 10.1 9.8 5 下肺 1.7 3.6 4.2 3.6 6 下肺 5.1 3.0 2.0 2.8 7 胸膜 1.0 45.5 42.1 45.0 8 肺门 3.8 2.1 2.2 2.3 9 下肺 3.0 32.9 33.5 36.8 10 上肺 2.0 4.5 4.7 4.6 11 肺门 2.5 7.9 7.7 6.9 12 下肺 7.1 7.0 8.2 12.3 13 下肺 3.3 3.8 4.1 4.2 14 胸膜 1.3 9.6 9.0 10.4 15 下肺 6.4 10.0 11.9 16.5 16 肺门 2.0 14.9 15.5 16.8 17 肺门 4.6 1.6 2.4 3.2 18 肺门 3.1 3.4 4.7 6.9 19 下肺 4.6 14.0 14.3 14.9 20 肺门 5.6 6.2 7.0 7.2 表 1 20个结节的三维PET体积与平均四维PET体积比较
Table 1. Comparison of gross tumor volume of twenty nodules defined by average four-dimensional PET and three-dimensional PET
-
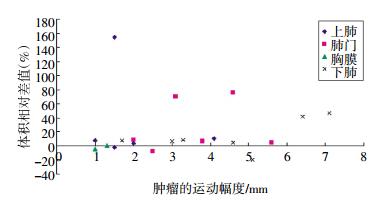
图 1为两种方法测得的平均四维PET体积与三维PET体积的比较结果,其中只有4个结节的三维PET体积小于平均四维PET体积,其余16个结节的平均四维PET体积大于三维PET体积,平均四维PET体积比三维PET体积大17.2%。图 2为平均四维PET体积与三维PET体积的相对差值与结节呼吸运动幅度及结节位置的关系,由图可见,除2个结节外,下肺和肺门的平均四维PET体积均大于三维PET体积,平均相对差值为26.5%;除1个结节差值较大外(155%),上肺和胸膜平均四维PET体积与三维PET体积的平均相对差值为2.7%。当结节呼吸运动幅度小于3 mm时,平均四维PET体积与三维PET体积的平均相对差值为1.8%;大于3 mm时,平均相对差值为24.3%。
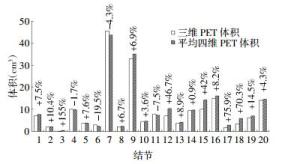
图 1 20个结节的平均四维PET体积与三维PET体积的相对差值
Figure 1. Relative difference of gross tumor volume of twenty nodules defined byaveragefour-dimensional PETandthree-dimensional PET
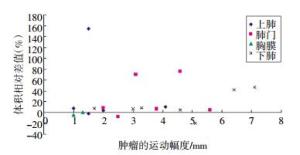
图 2 20个结节的平均四维PET体积与三维PET体积的相对差值随结节呼吸运动幅度的变化
Figure 2. The changes of relative difference with respiratory motion amplitude of gross tumor volume of twenty nodules defined by aver- age four-dimensional PET and three-dimensional PET
-
图 3为20个结节的三维CT体积与平均四维CT体积的比较结果,结节的基本信息与表 1一致。CT肺窗体积均远远大于PET体积。其中,13个结节6个时相的平均四维CT体积大于三维CT体积。三维CT体积为14.7 cm3,平均四维CT体积为15.2 cm3,平均四维CT体积比三维CT体积大3.9%。
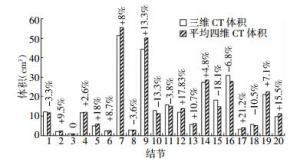
图 3 20个结节的平均四维CT体积与三维CT体积的相对差值
Figure 3. Relative difference of gross tumor volume of twenty nodules defined by average four-dimensional CT and three-dimensional CT
图 4为三维CT体积与平均四维CT体积的相对差值与结节呼吸运动幅度及结节位置的关系。由图可见,对于下肺,除1例结节外,平均四维CT体积明显大于三维CT体积,平均相对差值为11.3%;对于上肺、肺门、胸膜,平均四维CT体积与三维CT体积比较没有规律。结节呼吸幅度与体积相对差值亦无明显规律,对于呼吸幅度大于3 mm的结节,平均四维CT体积与三维CT体积的平均相对差值为11.8%;对于呼吸幅度小于3 mm的结节,平均相对差值为7.4%。
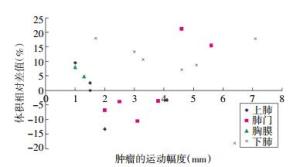
图 4 20个结节的平均四维CT体积与三维CT体积的相对差值随结节呼吸运动幅度的变化
Figure 4. The changes of relative difference with respiratory motion amplitude of gross tumor volume of twenty nodules defined by aver- age four-dimensional CT and three-dimensional CT
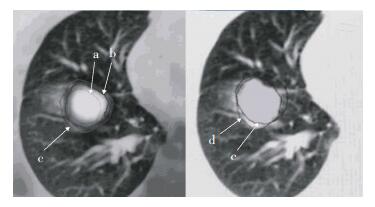
本研究请一位放疗科医师在下肺某结节勾画常规靶区与呼吸门控靶区,并显示其差别(图 5)。由图可见,平均四维PET体积大于三维PET体积,而平均四维CT体积远远大于平均四维PET体积,因此,采用符合恶性肿瘤的生物学特点的平均四维PET体积勾画靶区,缩小了靶区。同时,平均四维CT体积大于三维CT体积,但并不能完全将其包含于内,然而考虑到四维CT体积涵盖呼吸信息,所以对上肺和胸膜的结节采用低剂量平均四维CT体积勾画靶区。
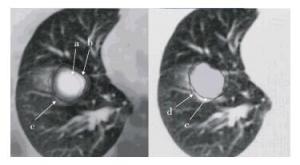
图 5 常规靶区与呼吸门控靶区的差别图中,a为三维PET体积;b为平均四维PET体积;c为平均四维CT体积;d为三维CT体积(常规靶区)。
Figure 5. The difference between the common target and respiratory gating target
-
呼吸运动会使肺部的靶组织产生位移,为了在运动中连续照射靶组织,医师在勾画靶区时不得不增加临床靶容积周围的外扩,进而增加了受照射正常组织的体积。目前,呼吸门控技术已在靶区勾画方面得以研究并受到重视。
本研究对20个结节进行呼吸门控PET/CT研究,发现用两种方法测得的平均四维PET体积比三维PET体积大22%。体积相对差值与结节呼吸运动幅度及结节位置有关,下肺和肺门的平均四维PET体积与三维PET体积的平均相对差值为26.5%,远远大于上肺和胸膜的平均相对差值(2.7%)。当结节呼吸运动幅度大于3 mm时,平均四维PET体积与三维PET体积的相对差值为24.3%;小于3 mm时,相对差值为1.8%。这些结果与文献[3]报道结果一致:22个结节,平均四维PET体积比三维PET体积大35%(P < 0.0001);当结节呼吸运动幅度大于3 mm时,平均四维PET体积与三维PET体积的差值为54%;小于3 mm时,体积差值为14%。由此可见,下肺和肺门的肿瘤受呼吸影响较大,四维PET较三维PET更能够代表肿瘤代谢的实际靶区。
另一种对肿瘤体积准确定位的研究方法是四维CT。文献报道,四维CT并不能完全应用于放射治疗中处于呼吸运动状态的肿瘤,肿瘤呼吸运动幅度越大,引起的运动伪影越具有随机性[4-6]。文献提出四维CT较多排CT更能够精确定义肿瘤体积。Hof等[5]提出,考虑到呼吸运动的影响,四维CT的体积(40.7 cm3)小于经过外放后肿瘤靶区三维CT的体积(57.7 cm3)。
本研究中13个结节平均四维CT体积比三维CT体积大3.9%,体积差值范围为0.2~5.9 cm3,体积比值为1.10±0.32,此比值接近文献[6]得到的结果(1.60±0.55)。然而,对于下肺,除1例结节外,平均四维CT体积明显大于三维CT体积,平均差值为11.3%;对于呼吸幅度大于3 mm的结节,平均四维CT体积与三维CT体积的平均相对差值为11.8%;对于呼吸幅度小于3 mm的结节,该值为7.4%。可见,下肺的结节受呼吸运动的影响较大,呼吸幅度越大,导致的伪影越明显,体积差值越大。
对于个别结节,由于患者呼吸运动自主性及两次扫描呼吸模式改变的影响,使得上肺结节体积差值较大,如第3例结节,平均四维PET体积与三维PET体积的差值达到155%;下肺结节,第15例,平均四维CT体积比三维CT体积小18.1%。可见,患者的积极配合,以及常规扫描和呼吸门控扫描时吸气与呼气的模式一致性对于研究至关重要。
尽管对于下肺和肺门考虑了受呼吸运动影响较大的四维CT体积同样可以取代四维PET体积勾画靶区,但考虑到利用PET勾画靶区更加符合恶性肿瘤的生物学特点,使靶区精确,对于下肺和肺门病灶,我们采用平均四维PET体积勾画靶区。本研究采用30 mA低剂量呼吸门控采集,相对于250 mA的常规放疗CT定位,对患者造成的辐射剂量低[7],对于上肺和胸膜尚且采用低剂量且涵盖了呼吸信息的四维CT体积勾画靶区,而文献中所说的四维CT体积并不能完全代表处于呼吸运动状态的肿瘤,还需在四维CT体积的基础上向外扩展多少范围,是后续研究的内容。
通过以上分析得出,靠近肝脾的下肺结节受呼吸运动影响明显,更适合用平均四维PET勾画肿瘤靶区;对于肺门周围的结节,勾画肿瘤靶区时应考虑呼吸运动的影响,考虑平均四维PET勾画肿瘤靶区;对于上肺和胸膜的结节,建议采用低剂量呼吸门控扫描且已经考虑了呼吸运动的平均四维CT体积勾画靶区。
呼吸门控PET/CT对于肺癌放疗靶区勾画的指导
Guiding the target delineation in radiation therapy of lung cancer by respiratory gated PET/CT
-
摘要:
目的 目的通过对肺部肿瘤进行呼吸门控PET/CT研究,给予肺部肿瘤放疗靶区勾画指导,最终使患者接受合理的照射靶区。 方法 对20个恶性结节进行呼吸门控PET/CT与常规PET/CT采集,比较肺部不同位置结节的平均四维PET体积与三维PET体积的差别,以及平均四维CT体积与三维CT体积的差别。以平均四维体积与三维体积的相对差值作为体积间的差异, 分别从结节位置、运动幅度研究其对四维体积与三维体积的影响。 结果 用两种方法测得的平均四维PET体积比三维PET体积大17.2%。体积相对差值与结节呼吸运动幅度及结节位置有关。下肺和肺门病灶平均四维PET体积与三维PET体积的平均差值为26.5%,远远大于上肺和胸膜病灶的平均差值(2.7%)。当结节呼吸运动幅度大于3 mm时,四维与三维PET体积差值的平均值为24.3%;小于3 mm时,平均值为1.8%。平均四维CT体积比三维CT体积大3.9%,体积差值范围为0.2~5.9 cm3,体积比值为1.10依0.32。只有在下肺,平均四维CT体积明显大于三维CT体积,平均差值为11.3%。 结论 对于靠近肝脾的下肺结节,用平均四维PET勾画肿瘤靶区更精确些;对于肺门周围的结节,考虑平均四维PET体积作为肿瘤靶区;对于上肺和胸膜的结节,建议采用低剂量呼吸门控扫描且已经考虑了呼吸运动的平均四维CT体积勾画靶区。 -
关键词:
- 肺肿瘤 /
- 正电子发射断层显像术 /
- 体层摄影术,X线计算机 /
- 放疗靶区 /
- 体积比较
Abstract:Objective To give target outline guidance for lung tumor radiation therapy by respiratory gating(RG) four-dimensional PET/CT for lung cancer. Eventually reasonable radiation target regions in treatment planning are received by patients. Methods Twenty malignant nodules were studied by RG PET/CT and conventional PET/CT. The differences of gross tumor volume defined by average four-dimensional PET and three-dimensional PET were compared in different lung locations. Differences of gross tumor volume defined by average four-dimensional CT and three-dimensional CT were also investigated. Differences between volume defined by average four-dimensional volumes and three-dimensional volumes were defined as relative difference of gross tumor volume, and influences for volume defined by four-dimensional PET and CT and three-dimensional PET and CT based on the nodal position and respiratory motion amplitude were also investigated in this study. Results Both volumes defined by average four-dimensional PET measured with two techniques were 17.2% greater than the volume defined by three-dimensional PET on average. The relative difference of the volume defined by average four-dimensional PET and three-dimensional PET was related to the nodal position and respiratory motion amplitude. The mean difference was 26.5% for the lower lobe and hilus of the lung, which was much greater than that of the upper lobe and pleura(2.7%). When the respiratory motion amplitude of nodules was > 3 mm, the difference between the volumes defined by average four-dimensional PET and three-dimensional PET was 24.3%(as < 3 mm, difference was 1.8%). The volume defined by average four-dimensional CT was 3.9% larger than the volume defined by three-dimensional CT, with difference range of nodule volume at 0.2 cm3 to 5.9 cm3 and ratios of 1.10±0.32. Only the nodules in the lower lobe showed significantly larger volumes defined by average four-dimensional CT than those defined by three-dimensional CT with average difference of 11.3%. Conclusion For lung nodules close to the liver and spleen, the volume defined by average four-dimensional PET showed more accuracy for sketching tumor target. For nodules around the hilus of the lung, the volume defined by average four-dimensional PET can be considered as tumor target. For the upper lobe and pleural nodules, the volume defined by average four-dimensional CT was selected for the target outline, which adopted low-dose RG scan and considered breathing movement. -
图 1 20个结节的平均四维PET体积与三维PET体积的相对差值
Figure 1. Relative difference of gross tumor volume of twenty nodules defined byaveragefour-dimensional PETandthree-dimensional PET
图 2 20个结节的平均四维PET体积与三维PET体积的相对差值随结节呼吸运动幅度的变化
Figure 2. The changes of relative difference with respiratory motion amplitude of gross tumor volume of twenty nodules defined by aver- age four-dimensional PET and three-dimensional PET
图 3 20个结节的平均四维CT体积与三维CT体积的相对差值
Figure 3. Relative difference of gross tumor volume of twenty nodules defined by average four-dimensional CT and three-dimensional CT
图 4 20个结节的平均四维CT体积与三维CT体积的相对差值随结节呼吸运动幅度的变化
Figure 4. The changes of relative difference with respiratory motion amplitude of gross tumor volume of twenty nodules defined by aver- age four-dimensional CT and three-dimensional CT
图 5 常规靶区与呼吸门控靶区的差别图中,a为三维PET体积;b为平均四维PET体积;c为平均四维CT体积;d为三维CT体积(常规靶区)。
Figure 5. The difference between the common target and respiratory gating target
表 1 20个结节的三维PET体积与平均四维PET体积比较
Table 1. Comparison of gross tumor volume of twenty nodules defined by average four-dimensional PET and three-dimensional PET
结节序号 位置 运动幅度(mm) 三维PET体积(cm3) 平均四维PET体积(cm3) 40%阈值法 最大密度投影法 1 上肺 4.1 7.0 7.4 8.1 2 上肺 1.0 2.0 2.1 2.2 3 上肺 1.5 0.2 0.6 0.4 4 上肺 1.5 10.1 10.1 9.8 5 下肺 1.7 3.6 4.2 3.6 6 下肺 5.1 3.0 2.0 2.8 7 胸膜 1.0 45.5 42.1 45.0 8 肺门 3.8 2.1 2.2 2.3 9 下肺 3.0 32.9 33.5 36.8 10 上肺 2.0 4.5 4.7 4.6 11 肺门 2.5 7.9 7.7 6.9 12 下肺 7.1 7.0 8.2 12.3 13 下肺 3.3 3.8 4.1 4.2 14 胸膜 1.3 9.6 9.0 10.4 15 下肺 6.4 10.0 11.9 16.5 16 肺门 2.0 14.9 15.5 16.8 17 肺门 4.6 1.6 2.4 3.2 18 肺门 3.1 3.4 4.7 6.9 19 下肺 4.6 14.0 14.3 14.9 20 肺门 5.6 6.2 7.0 7.2  下载: 导出CSV
-
[1] Nehmeh SA, Erdi YE, Ling CC, et al. Effect of respiratory gating on quantifying PET images of lung cancer[J]. J Nucl Med, 2002, 43(7):876-881. [2] Werner MK, Parker JA, Kolodny GM, et al. Respiratory gating enhances imaging of pulmonary nodules and measurement of tracer uptake in FDG PET/CT[J]. AJR Am J Roentgenol, 2009, 193(6):1640-1645. doi: 10.2214/AJR.09.2516 [3] Aristophanous M, Berbeco RI, Killoran JH, et al. Clinical utility of 4D FDG-PET/CT scans in radiation treatment planning[J/OL]. Int J Radiat Oncol Biol Phys, 2012, 82(1): e99-105.http://www.sciencedirect.com/science/article/pii/50360301611000629. [4] Underberg RW, Lagerwaard FJ, Cuijpers JP, et al. Four-dimensional CT scans for treatment planning in stereotactic radiotherapy for stage I lung cancer[J]. Int J Radiat Oncol Biol Phys, 2004, 60(4):1283-1290. doi: 10.1016/j.ijrobp.2004.07.665 [5] Hof H, Rhein B, Haering P, et al. 4D-CT-based target volume definition in stereotactic radiotherapy of lung tumours:comparison with a conventional technique using individual margins[J]. Radiother Oncol, 2009, 93(3):419-423. [6] Li F, Li J, Zhang Y, et al. Geometrical differences in gross target volumes between 3DCT and 4DCT imaging in radiotherapy for non-small-cell lung cancer[J]. J Radiat Res, 2013, 54(5):950-956. doi: 10.1093/jrr/rrt017 [7] 武萍, 李思进, 张艳兰, 等.基于30 mA管电流低剂量呼吸门控PET/CT扫描条件的建立讨论[J].国际放射医学核医学杂志, 2013, 37(5):257-261.
-

 点击查看大图
计量
- 文章访问数: 2648
- HTML全文浏览量: 1268
- PDF下载量: 4