


-
心肌灌注SPECT在临床中的应用日益增多,已成为心脏病诊断的重要工具,心电图门控核素心肌灌注SPECT(gated myocardial perfusion SPECT,G-MPS)通过一次显像可以评价左室心肌的灌注情况,同时还可以通过软件定量分析左心室的功能。爱莫瑞心脏工具箱(Emory cardiac toolbox,ECToolbox)是计算左心室功能最常用的软件之一,新版本的ECToolbox提供了R0、R1、R2、R3 4种计算公式,这4种公式计算出的左心室射血分数(left ventricular ejection fraction,LVEF)结果存在一定差异,如何确定这4种公式的适用性,目前仅见汪太松等[1]关于R0、R1、R3公式的比较报道,尚未见4种公式的研究报道。本文通过ECToolbox软件这4种公式测定的LVEF分布与平衡法核素心室造影(equilibrium radionuclide ventriculography,ERNV)获得的LVEF进行比较分析,以确定R0~R3公式计算的LVEF阈值。
-
收集2012年5月至12月同时进行G-MPS和ERNV的患者63例,其中,男性36例、女性27例,年龄39~82岁,平均年龄(62.5±10.7)岁。其中23例有心肌梗死病史,40例为可疑冠心病患者。所有患者进行G-MPS和ERNV的检查时间不超过一周。所有患者均于检查前签署了知情同意书。3周内有急性心肌梗死或不稳定性心绞痛、30 d内行冠状动脉重建手术、瓣膜反流的患者不在本研究范围内。
-
采用德国SIMENS公司ECAM双探头SPECT/CT仪采集图像,矩阵为64×64,配低能高分辨率准直器。显像剂为上海欣科医药有限公司生产的99Tcm-MIBI、99Tcm-红细胞、99TcmO4-淋洗液。
-
静脉注射99Tcm-MIBI 740 MBq,60 min后行静息G-MPS。采用德国SIMENS公司ECAM双探头SPECT/CT仪采集图像,矩阵为64×64,配低能高分辨率准直器。以心电图R波触发门电路同步采集,探头旋转180°,每3°采集1个体位,每个心动周期分为8帧,每个体位采集20 s。图像重建采用有序子集最大期望值法,断层图像重建采用Butterworth滤波,截止频率和陡度因子分别为0.4和10。
-
静脉注射焦磷酸盐20 min后,再静脉注射99TcmO4-淋洗液740 MBq,待显像剂混合平衡后行ERNV。采用德国SIMENS公司ECAM双探头SPECT/CT仪采集图像,矩阵为64×64,每个心动周期采集16帧,选左前斜45°计算LVEF。
-
采集的图像在Xeleris工作站(3.0版)进行图像处理和分析。G-MPS图像计算LVEF使用ECToolbox软件(3.1版)中的R0~R3 4种公式分别计算,ERNV图像计算LVEF使用Xeleris工作站提供的ERNV分析程序进行计算,并将ERNV所获得的LVEF≥50%者视为正常。
-
随机选择4例患者的G-MPS和ERNV图像,由1名医师采用盲法进行5次重复处理,分析其一致性。
-
采用SPSS 18.0软件包进行统计学分析。所有数据采用$\bar x \pm s$表示,观察者的一致性采用变异系数(coefficient of variation,CV)表示,相关性分析采用Pearson检验,R0~R3计算所得LVEF的阈值以ERNV所得的LVEF≥50%作为参考,通过受试者操作特征(receiver operating characteristic,ROC)曲线分析获得R0~R3 4个公式所得的每个LVEF的灵敏度和特异度,分别计算4个公式所得LVEF的灵敏度和特异度之和,以和为最大值时的LVEF作为各个公式的阈值。
-
观察者重复计算的LVEF,结果显示其一致性较好,CV均 < 5%(表 1)。
患者 R0 CV R1 CV R2 CV R3 CV ERNV CV 1 73.3±1.3 1.77% 65.4±0.9 1.38% 82.6±1.7 2.06% 64.4±1.5 2.33% 67.1±1.4 2.09% 2 64.5±1.1 1.71% 56.7±1.3 2.29% 71.2±1.4 1.97% 57.3±1.2 2.09% 61.6±0.9 1.46% 3 51.8±0.7 1.35% 43.4±1.3 3.00% 55.2±1.2 2.17% 45.8±0.8 1.75% 45.1±1.1 2.44% 4 36.9±1.2 3.25% 29.7±0.8 2.69% 37.5±1.5 4.00% 32.1±1.2 3.74% 34.5±0.8 2.32% 注:表中,ECToolbox:爱莫瑞心脏工具箱;LVEF:左心室射血分数;CV:变异系数;ERNV:平衡法核素心室造影。 表 1 一名医师对4例患者采用ECToolbox 4种公式盲法重复计算LVEF的结果([
$\bar x \pm s$ -
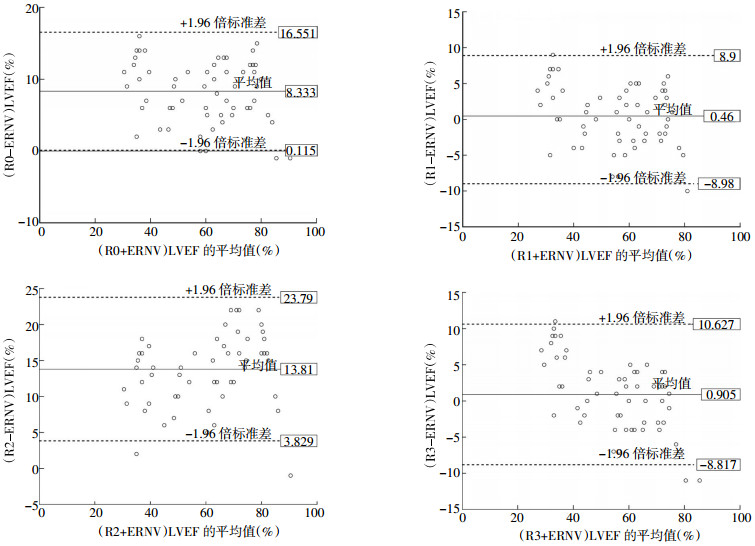
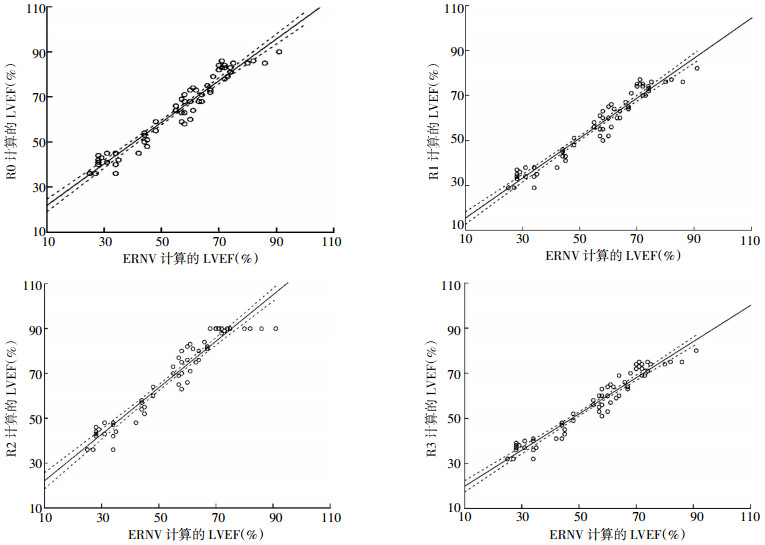
ECToolbox 4种公式计算出的LVEF分别与ERNV所得LVEF进行相关性分析,R0~R3与ERNV所得结果的相关性系数较高(r=0.971、0.971、0.963和0.969,P均 < 0.01)(图 1)。但R0~R3各公式计算所得的LVEF平均值(63.75%±16.63%、55.87%±15.99%、69.22%±18.83%、56.32%±14.47%)与ERNV计算所得的LVEF平均值(55.41%±17.49%)存在不同程度的差异(图 2),其中,R0和R2所得LVEF与ERNV所得LVEF的差异具有统计学意义(t=15.775和21.525,P均 < 0.01),R1和R3所得LVEF与ERNV所得LVEF的差异无统计学意义(t=0.848和1.448,P均>0.05)。如图 2所示,R0和R2与ERNV的LVEF差值的平均值分别为8.33和13.81,平均值-1.96倍标准差大于零;R1和R3与ERNV的LVEF差值的平均值接近零,分别为0.46和0.91。

图 1 63例患者采用ECToolbox的R0~R3 4种公式计算的LVEF与ERNV计算的LVEF的相关性分析图

图 2 63例患者采用ECToolbox的R0~R3 4种公式计算的LVEF与ERNV计算的LVEF差值的比较
-
以ERNV的LVEF≥50%作为标准,通过ROC曲线分析,得到ECToolbox的R0~R3 4个公式的最佳阈值分别为56.5%、51.5%、64.5%和52.5%,以此阈值作为诊断参考值,其灵敏度和特异度见表 2。
公式 阈值 灵敏度 特异度 R0 56.5 100 95.7 R1 51.5 97.5 100 R2 64.5 97.5 100 R3 52.5 97.5 100 注:表中,ECToolbox:爱莫瑞心脏工具箱;LVEF:左心室射血分数。 表 2 ECToolbox的R0~R3 4种公式计算LVEF的最佳阈值及其灵敏度和特异度(%)
-
LVEF在心脏病的诊断、治疗和预后中有着重要的价值,G-MPS能提供心肌血流信息和左心室功能参数,对临床心脏疾病的诊断、治疗和预后判断有重要意义。ECToolbox软件是计算G-MPS的LVEF最常用的软件之一,它把左心室假设成一个半球和圆柱体的三维混合体,根据收缩末和舒张末的心肌最大放射性计数,利用傅里叶分析来计算室壁增厚率,并设定左心室舒张末室壁厚度为10 mm,根据室壁增厚率来计算心内外膜的半径,从而确定左心室心内外膜边界,计算左心室的功能参数[2-3]。
最初Faber等[4]的研究表明,ECToolbox自动勾画左心室心内外膜的成功率为96%,且其与磁共振现象和首次通过法心室造影的相关性较好。之后,研究报道了ECToolbox计算的左心室功能参数与MRI的结果具有较好的相关性[5-7],并且与ERNV的结果也具有较好的相关性[8-10]。但由于ECToolbox假定左心室舒张末室壁厚度为10 mm,当发生左心室室壁瘤或心肌肥厚等室壁变薄或变厚时就会出现误差,研究发现与心脏MRI或心血池显像相比,ECToolbox均高估了LVEF[5, 8]。这些研究中计算LVEF所用的方法均为ECToolbox的原始公式R0,新版本的ECToolbox增加了R1~R3 3个校正公式。
ECToolbox的4个公式中,R0是根据心脏模型所建立的原始公式,R1~R3分别是R0的回归等式,R1和R3是基于ECToolbox和希德-西奈定量门控SPECT(quantitative gated SPECT,QGS)程序计算的LVEF对比而得到的,其中R1是根据每个心动周期8帧的QGS图像进行校正的,R3是根据每个心动周期16帧的QGS图像进行校正的,其计算LVEF的等式分别为y=0.96x-0.53和y=0.885x+0.0173;而R2是基于ECToolbox与ERNV比较而得到的,其计算LVEF的等式为y=1.22x-0.072。在临床应用中发现这4个公式计算出的LVEF具有较大差异,且对于这4个公式的研究报道较少[1]。本研究用这4种公式分别计算LVEF,以ERNV计算值作为金标准,观察4种公式的适用性,确定4种公式的最佳诊断阈值,结果表明4种公式的计算值与ERNV的计算值均呈正相关,配对t检验结果显示4种公式计算的LVEF均高于ERNV的计算值,其中,R0和R2与ERNV的差异具有统计学意义;R1和R3的计算值接近于ERNV的计算值,其差异无统计学意义。以ERNV计算的LVEF≥50%作为正常值,通过ROC曲线判断4种公式的灵敏度和特异度,结果发现4个公式均有较高的灵敏度和特异度。但仍有少部分患者的LVEF被高估了,进一步分析4个公式的最佳阈值,结果显示分别为56.5%、51.5%、64.5%和52.5%。说明了这4种公式的计算值不能随意使用,在同一患者的疗效随访过程中,需使用同一公式的计算值进行比较,且在给出诊断报告时,应注明所用公式的参考阈值,不能将阈值统一定义为常规的50%。
ECToolbox软件4种公式计算左心室射血分数的比较分析
Comparison of the four formulas of software ECToolbox for the assessment of left ventricular ejection fraction with the equilibrium radionuclide ventriculography
-
摘要:
目的 比较爱莫瑞心脏工具箱(ECToolbox)4种公式(R0、R1、R2、R3)计算心电图门控核素心肌灌注SPECT(G-MPS)左心室射血分数(LVEF)与平衡法核素心室造影(ERNV)所得结果的相关性和一致性,并判断4种公式所得结果的诊断阈值。 方法 选取63例患者,其中,23例有心肌梗死病史,40例为可疑冠心病患者。同一患者在一周内完成99Tcm-MIBI静息态G-MPS和99Tcm-红细胞ERNV,用ECToolbox软件中的R0、R1、R2、R3公式分别计算LVEF,将计算结果与ERNV结果进行对比分析,并以后者所得的LVEF≥50%作为标准,通过受试者操作特征曲线判断R0~R3 4个公式的最佳诊断阈值。 结果 ERNV得到的LVEF的平均值为55.41%±17.49%,R0~R3 4种公式得到的LVEF分别为63.75%±16.63%、55.87%±15.99%、69.22%±18.83%、56.32%±14.47%。4种公式所得结果与ERNV所得结果具有较强的相关性(r均 > 0.95,P均 < 0.01);4种公式计算的LVEF平均值均高于ERNV的LVEF平均值,其中,R0和R2公式所得结果与ERNV结果的差异具有统计学意义(t=15.775和21.525,P均 < 0.01);R1和R3公式所得结果与ERNV结果的差异无统计学意义(t=0.848和1.448,P > 0.05)。以ERNV的LVEF≥50%作为正常诊断值,R0~R3公式所得LVEF的最佳诊断阈值分别为56.5%、51.5%、64.5%和52.5%。 结论 用于G-MPS的ECToolbox的4种公式与ERNV计算的LVEF具有较强的相关性,但LVEF平均值有差异,同一患者在随诊过程中应采用同一个公式进行计算,用于诊断心功能时,每个公式应选用不同的阈值。 -
关键词:
- 每搏输出量 /
- 门控血池显像 /
- ECToolbox软件
Abstract:Objective To compare the correlation and consistency of left ventricular ejection fraction(LVEF) obtained by electrocardiography gated myocardial perfusion SPECT(G-MPS) using the four formulas(R0-R3) in Emory cardiac toolbox(ECToolbox) software and by equilibrium radionuclide ventriculography(ERNV), and determine the optimal diagnostic thresholds of the four formulas. Methods Sixty-three patients, including 23 patients with a history of myocardial infarction and 40 patients with suspected coronary heart disease, underwent both 99Tcm-MIBI rest G-MPS and 99Tcm labeled red blood cell ERNV within a week. The LVEF values calculated by R0, R1, R2 and R3 formulas of ECToolbox were compared with those obtained by ERNV. Using LVEF≥50% obtained by ERNV as the gold standard, the optimal diagnostic thresholds of the four formulas (R0-R3) were assessed by receiver operating characteristic(ROC) curve. Results The mean LVEF of ERNV was 55.41%±17.49%. The mean LVEF values of the four formulas were 63.75%±16.63%, 55.87%±15.99%, 69.22%±18.83% and 56.32%±14.47%, respectively. On correlation analysis, a strong positive correlation was observed between LVEF values derived by ERNV and those derived by the four formulas(all r > 0.95, all P < 0.01). The differences of LVEF were statistically significant between ERNV and the two formulas R0 and R2(t=15.775 and 21.525, both P < 0.01), while between ERNV and the two formulas R1 and R3(t=0.848 and 1.448, both P > 0.05). Normal cutoff values for LVEF on R0, R1, R2, R3 were 56.5%, 51.5%, 64.5% and 52.5% respectively, using a 50% or more cutoff value on ERNV. Conclusions A strong correlation was observed among the four formulas of ECToolbox software programs when compared with ERNV. However, there are subtle differences in the objective values of LVEF generated by individual calculation methods, which must be taken into account for clinical studies. -
Key words:
- Stroke volume /
- Gated blood-pool imaging /
- ECToolbox software
-
表 1 一名医师对4例患者采用ECToolbox 4种公式盲法重复计算LVEF的结果([
$\bar x \pm s$ 患者 R0 CV R1 CV R2 CV R3 CV ERNV CV 1 73.3±1.3 1.77% 65.4±0.9 1.38% 82.6±1.7 2.06% 64.4±1.5 2.33% 67.1±1.4 2.09% 2 64.5±1.1 1.71% 56.7±1.3 2.29% 71.2±1.4 1.97% 57.3±1.2 2.09% 61.6±0.9 1.46% 3 51.8±0.7 1.35% 43.4±1.3 3.00% 55.2±1.2 2.17% 45.8±0.8 1.75% 45.1±1.1 2.44% 4 36.9±1.2 3.25% 29.7±0.8 2.69% 37.5±1.5 4.00% 32.1±1.2 3.74% 34.5±0.8 2.32% 注:表中,ECToolbox:爱莫瑞心脏工具箱;LVEF:左心室射血分数;CV:变异系数;ERNV:平衡法核素心室造影。  下载: 导出CSV
表 2 ECToolbox的R0~R3 4种公式计算LVEF的最佳阈值及其灵敏度和特异度(%)
公式 阈值 灵敏度 特异度 R0 56.5 100 95.7 R1 51.5 97.5 100 R2 64.5 97.5 100 R3 52.5 97.5 100 注:表中,ECToolbox:爱莫瑞心脏工具箱;LVEF:左心室射血分数。
下载: 导出CSV
-
[1] 汪太松, 赵晋华, 邢岩. ECToolbox软件计算左心室射血分数的适用性.中国医学影像技术, 2010, 26(2):330-332.
[2] Carcia EV, Santana CA, Faber TL, et al. Comparison of the diagnostic performance for detection fo coronary artery disease (CAD) of their program(QPS) with that of the Emory Cardiac Toolbox(ECTb) for automated quantification of myocardial perfusion. J Nucl Cardiol, 2008, 15(3):476-478. [3] Kakhki VR, Zakavi SR, Sadeqhi R. Comparison of two software in gated myocardial perfusion gingle photon emission tomography, for the measurement of left ventricular volumes and ejection fraction, in patients with and without perfusion defects. Hell J Nucl Med, 2007, 10(1):19-23. [4] Faber TL, Cooke CD, Folks RD, et al. Left ventricular function and perfusion from gated SPECT perfusion images:an integrated method. J Nucl Med, 1999, 40(4):650-659. [5] Wang F, Zhang J, Fang W, et al. Evaluation of left ventricular volumes and ejection fraction by gated SPECT and cardiac MRI in patients with dilated cardiomyopathy. Eur J Nucl Med Mol Imaging, 2009, 36(10):1611-1621. doi: 10.1007/s00259-009-1136-7 [6] Gutberlet M, Mehl S, Fröhlich M, et al. Determination of ventricular volumes in coronary artery disease:comparison of two gated SPECT analysis tools with MRI. Nuklearmedizin, 2006, 45(2):63-73. [7] Tsuboi K, Fuse H, Sasaki M. Evaluation of left ventricular volumes and ejection fraction by gated myocardial perfusion SPECT versus cardiac MRI. Nihon Hoshasen Gijutsu Gakkai Zasshi, 2011, 67(10):1304-1313. doi: 10.6009/jjrt.67.1304 [8] Ballal S, Patel CD, Singla S, et al. Comparison of software programs for the assessment of left ventricular ejection fraction using 99mTc-tetrofosmin-gated SPECT/CT:correlation with equilibrium radionuclide ventriculography in the Indian population. Nucl Med Commun, 2012, 33(11):1160-1168. doi: 10.1097/MNM.0b013e328358cdee [9] Kiratli PO, Bozkurt MF. Assessment of cardiac parameters using gated myocardial perfusion and echocardiography in children. Cardiol Young, 2009, 19(1):53-59. [10] Harisankar CN, Mittal BR, Kamaleshwaran KK, et al. Reliability of left ventricular ejection fraction calculated with gated myocardial perfusion single photon emission computed tomography in patients with extensive perfusion defect. Nucl Med Commun, 2011, 32(6):503-507. -

 点击查看大图
图(2)表(2)
计量
- 文章访问数: 2404
- HTML全文浏览量: 1396
- PDF下载量: 3