


-
最小二乘法估计和不对称回波迭代水解和脂肪成像(iterative decomposition of water and fat with asymmetry and least squares estimation quantitative fat imaging,IDEAL-IQ)是一种无创的分析组织器官质子密度脂肪分数(proton density fat fraction,PDFF)和铁含量(R2*)的MRI技术,一般基于3.0 T MRI机型实现。目前,部分1.5 T MRI机型也开展了相关工作[1]。研究报道,不同场强的腰椎脂肪定量分析的一致性较好[1-2],而铁定量分析的一致性较差[3]。鉴于MRI机型、系统性能(硬、软件配置)等差异,不同场强MRI测量的PDFF、R2*值缺少扫描参数、ROI勾画、后处理算法等的标准化。临床上,同一受检者通过不同场强MRI测量的PDFF、R2*结果缺少直接比较的依据,受检者面临重复测量的问题。目前,基于IDEAL-IQ序列、不同场强MRI系统间PDFF、R2*测量值的对比研究较少。本研究以不同脂肪含量模型和健康志愿者于3.0 T和1.5 T MRI机型上分别用临床使用的IDEAL-IQ序列扫描,初步探讨2种场强MRI定量分析肝脏PDFF和R2*测量值的异同。
-
于2019年12月选取健康志愿者(佛山市第一人民医院的实习生和规范化培训住院医师)20名[其中男性13名、女性7名,年龄(23.7±2.5)岁],并用5支容积均为20 ml、脂肪含量不同的密封塑料试管模型进行前瞻性研究。健康志愿者的体质指数(body mass index,BMI)为(22.33±2.69) kg/m2。磁共振PDFF、R2*测量的塑料试管模型的脂肪含量分别为0、10%、20%、30%、40%。纳入标准:(1)MRI平扫序列未发现肝脏病变;(2)在3.0 T和1.5 T MRI设备上均有效完成IDEAL-IQ序列扫描,且图像符合分析要求。排除标准:(1)MRI平扫序列发现肝脏病变;(2)IDEAL-IQ序列扫描时患者屏气不佳,图像出现呼吸、移动伪影;(3)IDEAL-IQ序列图像不完整。所有健康志愿者均签署了知情同意书。本研究经佛山市第一人民医院伦理委员会批准(批准号:伦审药[2021]第5号)。
-
使用美国GE公司Discovery 750w 3.0 T和GE 360 Optima 1.5 T超导MR扫描仪各1台及对应的相控阵腹部表面线圈、上腹部临床应用IDEAL-IQ序列,分别对健康志愿者及模型进行扫描;采用美国GE公司Discovery 750w 3.0 T MR扫描仪配置的AW4.6后处理工作站对图像质量和健康志愿者肝脏病变进行评价、测量量化指标。
-
模型扫描:将模型置于扫描床和线圈中心束缚固定后,定位于磁体中心。先扫描定位片,在横断面、矢状面、冠状面确定扫描位置和范围后,进行横断面三维 IDEAL-IQ序列扫描。3.0 T MRI扫描参数:三维容积扫描、视野440 mm×440 mm、矩阵192×96、层厚7 mm、间距0、回波时间Min Full、默认重复时间、2次激发、翻转角3°、回波链3、带宽111.11 kHz、激励次数1、扫描时间20 s。1.5 T MRI扫描参数:默认翻转角、单次激发、回波链6、扫描时间14 s,其他参数与3.0 T MRI扫描参数一致。
健康志愿者上腹部平扫:受检者取仰卧位,足先进。扫描范围覆盖整个肝脏,中心定位于剑突。呼吸门控软管束缚于肚脐区域。扫描前训练受检者的呼吸、屏气。先扫描定位片,在横断面、矢状面、冠状面确定扫描位置和范围后,扫描冠状面和横断面脂肪抑制T2WI、横断面DWI和正、反相位T1WI序列,后扫描横断面三维 IDEAL-IQ序列,该序列每次屏气时间为21 s(3.0 T)和25 s(1.5 T),其他参数均与对应的模型扫描参数一致。
-
观察指标包括3.0 T和1.5 T MR模型、健康志愿者肝脏和皮下脂肪的PDFF、R2*测量值。测量值分组如下。(1)3.0 T MR为A组(A1~A6)、1.5 T MR为B组(B1~B6)。(2)模型:A1为3.0 T MR PDFF、A2为3.0 T MR R2*;B1为1.5 T MR PDFF、B2为1.5 T MR R2*。(3)健康志愿者:A3为3.0 T MR肝脏PDFF、A4为3.0 T MR皮下脂肪PDFF、A5为3.0 T MR肝脏R2*、A6为3.0 T MR皮下脂肪R2*;B3为1.5 T MR肝脏PDFF、B4为1.5 T MR皮下脂肪PDFF、B5为1.5 T MR肝脏R2*、B6为1.5 T MR皮下脂肪R2*。
-
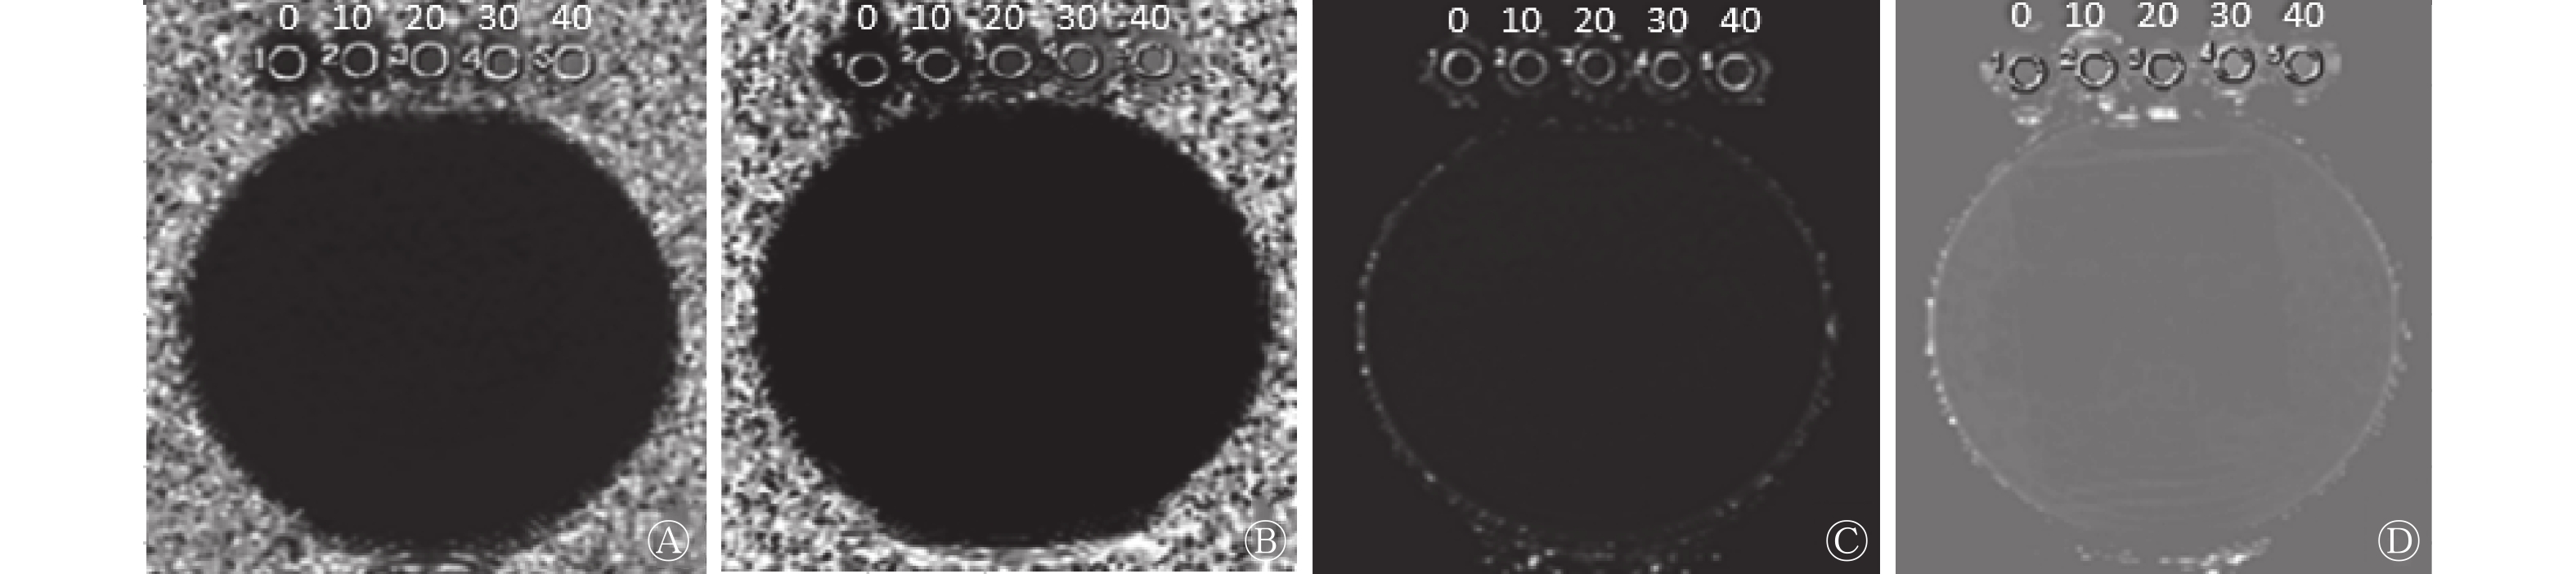
扫描结束后,将所有扫描原始图像传至 AW 4.6工作站,由1位放射诊断主任医师、1位放射技术副主任技师分别对图像质量和健康志愿者肝脏病变进行评价,意见不一致时,以第3位放射诊断主任医师的意见为准。使用AW 4.6工作站自带的Functool软件的Viewer功能,分别测量3.0 T和1.5 T MR扫描后自动生成的FatFrac图和R2*图中的PDFF和R2*,模型图像的5个ROI均取168 mm2,测量位置如图1所示;健康志愿者肝脏和对应层面的背部皮下脂肪各取1个ROI,面积均为20 mm2,肝内ROI距离肝包膜均≥1 mm,R2*测量的ROI选取胆囊窝外侧肝组织内,ROI均为圆形自动勾画,尽可能保证模型和同一受检者在2台设备上的FatFrac图和R2*图ROI测量位置的一致性,测量3个连续层面,取平均值。所有模型和健康志愿者的扫描由同一位放射技术副主任技师完成,数据测量由另一位放射诊断主任医师完成。

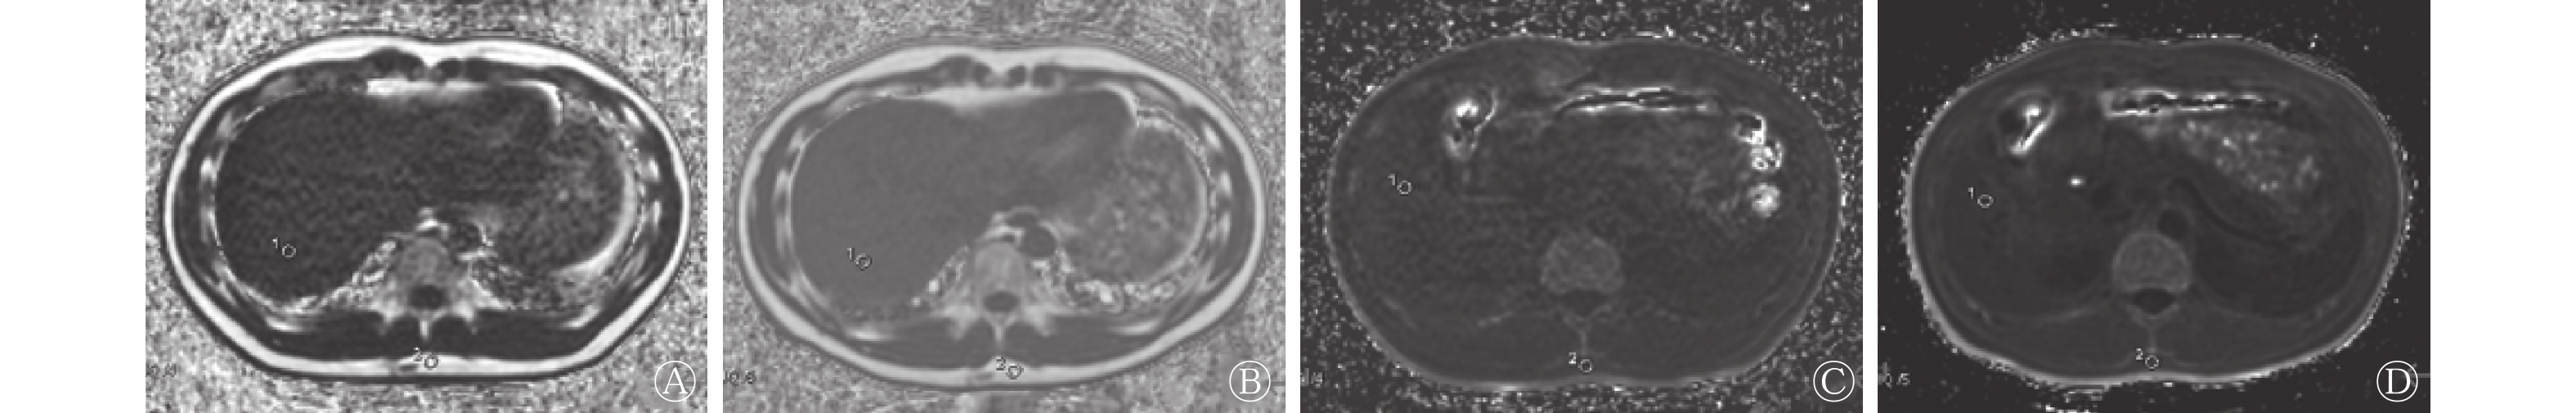
图 1 同一模型不同场强MRI的PDFF和R2*测量示意图
Figure 1. Schematic diagrams of proton density fat fraction and R2* measurement of the same model MRI with different field strengths

图 2 同一健康志愿者(男性,23岁)不同场强MRI的PDFF和R2*测量示意图
Figure 2. Schematic diagrams of proton density fat fraction and R2* measuring region of interest of the same volunteer (male, 23 years old)
-
采用SPSS 26.0软件进行统计学分析。符合正态分布的计量资料以
$ \bar{x} \pm s$ 表示,采用配对样本t检验(方差齐)和Mann-Whitney U检验(方差不齐)进行组间比较。P<0.05为差异有统计学意义。 -
20名健康志愿者均未见明确的肝脏病变;模型和健康志愿者的图像质量均符合纳入标准。
-
A1组与B1组对应的5个模型的PDFF测量平均值分别为(20.59±14.39)%和(21.89±14.95)%,差异无统计学意义(Z=−1.550,P=0.121)。除试管1外,其他试管模型的B1测量值均高于A1,且差异有统计学意义(均P<0.05)。试管模型1的A1、B1测量值的差异无统计学意义(P>0.05)。A1组2~5号试管的PDFF测量值更接近试管模型的脂肪含量(表1)。
场强 试管编号 1 2 3 4 5 A1(3.0 T) 0.21±2.67 11.34±2.14 20.36±0.89 30.48±0.77 40.70±0.42 B1(1.5 T) 0.12±0.81 12.13±0.88 22.20±0.66 32.68±1.02 42.59±0.90 Z值 −1.464 −2.153 −4.329 −4.151 −4.979 P值 0.143 0.031 <0.001 <0.001 <0.001 注:1~5号试管模型的脂肪含量分别为0、10%、20%、30%、40%。MRI为磁共振成像;PDFF为质子密度脂肪分数 表 1 2种MRI场强模型PDFF测量值的比较(%)
Table 1. Comparison of models' proton density fat fraction measured values of two magnetic resonance imaging field strengths (%)
-
A2组与B2组对应的5个试管模型的R2*测量平均值分别为(84.86±116.43) Hz和(43.61±54.59) Hz,差异有统计学意义(Z=−3.448,P=0.001),且所有A2测量值均高于B2;试管模型1、3、4的A2、B2测量值的差异均有统计学意义(均P<0.05)(表2)。
场强 试管编号 1 2 3 4 5 A2(3.0 T) 107.76±185.71 90.31±118.00 62.28±77.58 96.40±98.26 67.52±71.61 B2(1.5 T) 39.66±50.30 43.19±47.37 35.83±33.20 43.07±43.23 56.30±86.99 Z值 −1.971 −1.241 −2.029 −2.175 −1.212 P值 0.049 0.215 0.042 0.030 0.226 注:1~5号试管模型的脂肪含量分别为0、10%、20%、30%、40%。MRI为磁共振成像;R2*为铁含量 表 2 2种场强MRI模型R2* 测量值的比较(Hz)
Table 2. Comparison of models' R2*measured values of two magnetic resonance imaging field strengths (Hz)
-
健康志愿者A组肝脏(A3)及皮下脂肪(A4)PDFF测量值与对应的B组(B3、B4)的差异均无统计学意义(均P>0.05);健康志愿者A组肝脏(A5)及皮下脂肪(A6)R2*测量值均高于对应的B组(B5、B6),且差异有统计学意义(均P<0.001)(表3)。健康志愿者PDFF和R2*测量的示意图见图2。
场强 PDFF(%) R2*(Hz) 肝脏 皮下脂肪 肝脏 皮下脂肪 3.0 T 3.33±2.95 81.78±6.33 52.42±12.22 50.88±10.32 1.5 T 4.39±2.80 81.54±5.53 32.73±5.62 39.41±9.11 检验值 Z=−1.867 t=−0.301 Z=−3.920 t=4.372 P值 0.062 0.767 <0.001 <0.001 注:MRI为磁共振成像;PDFF为质子密度脂肪分数;R2*为铁含量 表 3 2种MRI场强健康志愿者肝脏和皮下脂肪PDFF及 R2* 测量值的比较(n=20)
Table 3. Comparison of measured values of PDFF and R2* of liver and subcutaneous fat of volunteers with two MRI field strengths (n=20)
-
尽管肝组织穿刺活检为有创检查,但临床上肝脏脂肪变性或沉积的确诊仍以其结果为“金标准”。MRI可以通过化学位移编码技术和多回波时间信号进行水、脂分离,实现对不同组织PDFF无创性测量的目的[4],其也是检测和量化肝脏铁含量的最佳无创性手段[5]和评价标准[6]。虽然MRI-PDFF测量仍不能替代肝脏活检,但其可以在一定程度上预测肝脏组织学的整体情况[7],且MRI-PDFF正逐渐成为肝脏脂肪定量诊断[8]和早期非酒精性脂肪性肝炎治疗反应的无创生物标志物[9]。
IDEAL-IQ序列是基于水脂分离(DIXON)技术研发的无创定量测量技术,主要对T2*衰减、脂肪谱峰分布等进行校正,其采用小角度激发以降低T1效应,把水脂分离从定性提升到定量,可以更准确地测量人体内的脂肪及铁含量[10-12]。但由于MRI设备性能的差异,不同场强MRI的PDFF、R2*测量仍缺少标准化的扫描参数、ROI勾画、后处理算法以及定量结果解释等,加上肝脏脂肪沉积的非均匀性分布和是否伴随铁沉积等,临床上依据MRI-PDFF、R2*测量值评估脂肪肝的程度、治疗反应、病情监测以及确定临床治疗终点时,仍面临困难。另外, IDEAL-IQ序列也用于腰椎骨髓等肝脏以外的组织、器官的脂肪含量评估以及药物研发等领域,同样面临不同场强MRI机型、多中心比较等问题。最近的研究结果表明,不同厂家3.0 T MRI设备所测同一非酒精性脂肪性肝病患者的肝脏PDFF具有较好的一致性[13]。但也有研究结果表明,肝脏中存在短T2*信号[14]以及腹部(肝脏)B0和B1不均匀性的混合影响[15],不同场强设备的短回波时间可能影响化学位移编码脂肪定量的精度。目前,关于不同场强、不同型号MRI设备PDFF、R2*测量值的一致性研究较少[1-2, 16]。深入此类研究,将有助于客观认识基于IDEAL-IQ序列或类似序列在肝脏PDFF、R2*测量值中的临床应用价值,为解决上述问题提供依据。
-
Liau 等[17]研究发现,IDEAL-IQ序列定量技术易受对比剂的干扰,超顺磁性氧化铁对脂肪定量分析无显著影响,但对铁定量分析有显著影响。有研究结果显示,Gd-DTPA、钆塞酸二钠(gadolinium ethoxybenzyl diethylenetriamine pentaacetic acid,Gd-EOB-DTPA)对脂肪和铁定量的影响与静脉注射对比剂的时间有关[10]。本研究选择GE 3.0 T和1.5 T MRI设备各1台,均具备IDEAL-IQ序列。模型中脂肪含量为0的第1个试管3.0 T MR的PDFF测量值高于1.5 T MRI,同时该试管3.0 T MR的R2* 测量值也显著高于1.5 T MR,这可能与试管内容物成分的影响有关。脂肪含量较高的另4个试管中,3.0 T MR的PDFF测量值均低于1.5 T MRI,且3.0 T者更加接近模型的脂肪含量。另外,健康志愿者 3.0 T MR(A3、A4)和对应的1.5 T(B3、B4)PDFF测量值的差异无统计学意义,与文献结果类似[1-2],3.0 T MR的测量值也低于1.5 T者。结合本研究志愿者[BMI=(22.33±2.69) kg/m2]更接近非肥胖(BMI<25 kg/m2)和瘦人(BMI<23 kg/m2)肝脏脂肪含量较低的情况[18],笔者推测,3.0 T MR的PDFF测量值可能比1.5 T MR更准确。这也可能提示,在临床应用中,当1.5 T MR测得的PDFF值稍高于脂肪肝诊断值时,其诊断脂肪肝的可靠性可能低于3.0 T MR。
-
IDEAL-IQ序列主要用于脂肪的定量分析[16],而用于铁定量分析的研究较少[19]。IDEAL-IQ序列是基于3.0 T MR梯度回波,并在水脂分离(DIXON)技术的基础上,对T2*衰减进行校正而形成,相较水脂分离(DIXON)技术,其对人体内的R2*测量更准确。T2*与主磁场密切相关,场强越高,磁场越容易受干扰而不均匀,T2*值越不稳定,进而影响代表铁定量的R2*(R2*=1/T2*)的准确性。本研究中,PDFF和R2*测量值的原始数据来自同一IDEAL-IQ序列,总体来看R2*测量值的差异明显,与文献报道类似[3, 20]。笔者推测,MR设备的场强差异可能是影响铁定量(R2*值)的主要因素之一。早期MRI测量铁定量的研究主要基于1.5 T MR设备[21],其R2*值被确定为某些疾病的临床诊断标准[22]。但体外试验结果显示,在铁浓度过高时,3.0 T场强的 MR设备可能无法准确进行铁定量,而1.5 T场强MR更准确,主要原因可能是3.0 T MR的磁敏感影响较1.5 T MR更大[20]。在临床实践中,3.0 T MR图像的磁敏感伪影也较1.5 T MR多见。因此,基于1.5 T场强 MRI参数获得R2*值的评价标准可能不适用于3.0 T场强。虽有体外水模试验结果显示3.0 T 与1.5 T MR的测量值可借助回归方程进行解读[3],但是如何对临床受检者在不同场强MR设备测量的R2*值进行归一化处理、标准化解读,需要进一步研究。
-
(1)研究对象为健康青年志愿者,未能涵盖不同年龄段人群,且样本量偏少,存在选择性偏倚;(2)未进行不同厂家、不同场强机型类似序列的比较研究;(3)主要观察和分析了MR设备场强对PDFF和R2*测量值的影响,其他性能指标和扫描参数的影响未作研究;(4)未纳入有肝脏脂肪和R2*组织病理学结果的受检者进行对照研究;(5)肝脏中的脂肪和R2*情况可能是PDFF和R2*测量值的相互影响因素[23],其随场强变化的情况也未纳入观察。
综上所述,基于IDEAL-IQ序列的3.0 T与1.5 T MR模型、肝脏和皮下脂肪的PDFF测量值无显著差异,但3.0 T MR的PDFF测量值可能比1.5 T MR更接近临床实际情况;而由3.0 T与1.5 T MR测量获得的R2*值有显著差异,其影响因素需进一步研究。
利益冲突 所有作者声明无利益冲突
作者贡献声明 贺小红负责命题与研究方案的设计、数据的采集、论文的撰写;洪居陆负责数据的测量、整理与分析、论文的修改;高明勇负责图像质量的评价、志愿者上腹部平扫图像的分析评估;吴李贤负责志愿者的临床评估、筛选与模型的提供;杨镜全负责图像的质量评价
两种场强磁共振IDEAL-IQ序列对质子密度脂肪分数和铁含量定量分析的初步对比研究
A preliminary quantitative comparative study of proton density fat fraction and iron content on two different strength of magnetic resonance with IDEAL-IQ sequence
-
摘要:
目的 比较3.0 T和1.5 T MR最小二乘法估计和不对称回波迭代分解水和脂肪成像(IDEAL-IQ)序列质子密度脂肪分数(PDFF)和铁含量(R2*)测量值的异同。 方法 于2019年12月选取佛山市第一人民医院健康志愿者20名[其中男性13名、女性7名,年龄(23.7±2.5)岁]并用不同脂肪含量的塑料试管模型进行前瞻性研究,分别在3.0 T(A组)和1.5 T(B组)2台 MRI设备上应用IDEAL-IQ序列进行扫描。在自动生成的FatFrac图和R2*图上自动勾画感兴趣区(ROI),分别测量模型、健康志愿者的肝脏和皮下脂肪的PDFF、R2*值。符合正态分布的计量资料采用配对样本t检验(方差齐)和Mann-Whitney U检验(方差不齐)进行比较。 结果 模型A1组和B1组PDFF的测量平均值分别为(20.59±14.39)%和(21.89±14.95)%,差异无统计学意义(Z=−1.550,P=0.121);A1组和B1组R2*的测量平均值分别为(84.86±116.43) Hz和(43.61±54.59) Hz,差异有统计学意义(Z=−3.448,P=0.001)。健康志愿者3.0 T和1.5 T MRI肝脏、皮下脂肪PDFF测量平均值分别为(3.33±2.95) %和(4.39±2.80) %、(81.78±6.33) %和(81.54±5.53) %,差异均无统计学意义(Z=−1.867、t=−0.301,均P>0.05);A组肝脏、皮下脂肪的R2*测量平均值为(52.42±12.22) Hz、(50.88±10.32) Hz,分别高于对应的B组[(32.73±5.62) Hz、(39.41±9.11) Hz],且差异均有统计学意义(Z=−3.920、t=4.372,均P<0.001)。 结论 基于IDEAL-IQ序列的3.0 T和1.5 T MR模型、健康志愿者肝脏和皮下脂肪的PDFF测量值的差异无统计学意义,但3.0 T MRI的PDFF测量值可能比1.5 T MRI更接近临床实际情况;2种场强获得的R2*值的差异有统计学意义,其影响因素需进一步研究。 Abstract:Objective Aimed to compare similarities and differences of the quantitative measurements of liver proton density fat fraction (PDFF) and iron content (R2*) between 3.0 T and 1.5 T MRI with iterative decomposition of water and fat with asymmetry and least squares estimation quantitative fat imaging (IDEAL-IQ) sequences. Methods Twenty healthy volunteers [13 males and 7 females, aged (23.7±2.5) years] and plastic test tube models with different fat contents were scanned with IDEAL-IQ sequence for prospective research on two MRI equipment of 3.0 T (group A) and 1.5 T (group B) in December 2019 in First People's Hospital of Foshan. The FatFrac images and R2* images automatically generated were used to draw the region of interests (ROIs) automatically. The PDFF and R2* values of the models and the liver and subcutaneous fat of the healthy volunteers were measured and compared between groups A and B. Measurement data that conformed to normal distribution were compared using paired sample t test (equal variances assumed) and Mann-Whitney U test (equal variances not assumed). Results The measured mean PDFF values of the model of groups A1 and B1 were (20.59±14.39)% and (21.89±14.95)%, respectively, with no significant difference (Z=−1.550, P=0.121). The measured mean R2* values of the model of groups A1 and B1 were (84.86±116.43) Hz and (43.61±54.59) Hz, respectively, with a statistically significant difference (Z=−3.448, P=0.001). No significant difference was found in the mean PDFF values of liver and subcutaneous fat of healthy volunteers [(3.33±2.95)% vs. (4.39±2.80)%, (81.78±6.33) Hz vs. (81.54±5.53) Hz)(Z=−1.867, t=−0.301; both P>0.05] with 3.0 T and 1.5 T MRI, respectively. The average R2* measured values of group A of the liver and subcutaneous fat of the healthy volunteers were higher than those of group B, with statistical significantly differences [(52.42±12.22) Hz vs. (32.73±5.62) Hz, (50.88±10.32) Hz vs. (39.41±9.11) Hz)(Z=−3.920, t=4.372; both P<0.001]. Conclusions Results showed no significant differences in the PDFF values of models and the liver and subcutaneous fat of the volunteers measured between 3.0 T MR and 1.5 T MR based on IDEAL-IQ sequences, but the PDFF values of 3.0 T MRI may be closer to the clinical actual situation than that of 1.5 T MRI. The R2* values obtained based on 3.0 T MRI field strength were significantly different from that of 1.5 T MRI, and its influencing factors need to be further studied. -
图 1 同一模型不同场强MRI的PDFF和R2*测量示意图
Figure 1. Schematic diagrams of proton density fat fraction and R2* measurement of the same model MRI with different field strengths
图 2 同一健康志愿者(男性,23岁)不同场强MRI的PDFF和R2*测量示意图
Figure 2. Schematic diagrams of proton density fat fraction and R2* measuring region of interest of the same volunteer (male, 23 years old)
表 1 2种MRI场强模型PDFF测量值的比较(%)
Table 1. Comparison of models' proton density fat fraction measured values of two magnetic resonance imaging field strengths (%)
场强 试管编号 1 2 3 4 5 A1(3.0 T) 0.21±2.67 11.34±2.14 20.36±0.89 30.48±0.77 40.70±0.42 B1(1.5 T) 0.12±0.81 12.13±0.88 22.20±0.66 32.68±1.02 42.59±0.90 Z值 −1.464 −2.153 −4.329 −4.151 −4.979 P值 0.143 0.031 <0.001 <0.001 <0.001 注:1~5号试管模型的脂肪含量分别为0、10%、20%、30%、40%。MRI为磁共振成像;PDFF为质子密度脂肪分数  下载: 导出CSV
表 2 2种场强MRI模型R2* 测量值的比较(Hz)
Table 2. Comparison of models' R2*measured values of two magnetic resonance imaging field strengths (Hz)
场强 试管编号 1 2 3 4 5 A2(3.0 T) 107.76±185.71 90.31±118.00 62.28±77.58 96.40±98.26 67.52±71.61 B2(1.5 T) 39.66±50.30 43.19±47.37 35.83±33.20 43.07±43.23 56.30±86.99 Z值 −1.971 −1.241 −2.029 −2.175 −1.212 P值 0.049 0.215 0.042 0.030 0.226 注:1~5号试管模型的脂肪含量分别为0、10%、20%、30%、40%。MRI为磁共振成像;R2*为铁含量
下载: 导出CSV
表 3 2种MRI场强健康志愿者肝脏和皮下脂肪PDFF及 R2* 测量值的比较(n=20)
Table 3. Comparison of measured values of PDFF and R2* of liver and subcutaneous fat of volunteers with two MRI field strengths (n=20)
场强 PDFF(%) R2*(Hz) 肝脏 皮下脂肪 肝脏 皮下脂肪 3.0 T 3.33±2.95 81.78±6.33 52.42±12.22 50.88±10.32 1.5 T 4.39±2.80 81.54±5.53 32.73±5.62 39.41±9.11 检验值 Z=−1.867 t=−0.301 Z=−3.920 t=4.372 P值 0.062 0.767 <0.001 <0.001 注:MRI为磁共振成像;PDFF为质子密度脂肪分数;R2*为铁含量
下载: 导出CSV
-
[1] 宋宇, 宋清伟, 张楠, 等. 不同场强下磁共振IDEAL-IQ技术对腰椎椎体脂肪含量定量对比分析[J]. 中国临床医学影像杂志, 2019, 30(9): 656−659. DOI: 10.12117/jccmi.2019.09.012.
Song Y, Song QW, Zhang N, et al. Quantitative comparison and analysis of lumbar vertebral fat content by IDEAL-IQ under different field intensities[J]. J Chin Clin Med Imaging, 2019, 30(9): 656−659. DOI: 10.12117/jccmi.2019.09.012.[2] 李承启, 曹代荣, 邢振, 等. MRI场强及设备类型对同反相位成像定量分析健康志愿者腰椎脂肪含量的影响[J]. 中国中西医结合影像学杂志, 2015, 13(2): 122−125. DOI: 10.3969/j.issn.1672-0512.2015.02.002.
Li CQ, Cao DR, Xing Z, et al. Influence of different field strength and different MR scanner with same field on quantitative analysis for lumbar bone marrow fat content with in- and opposed -phase in healthy volunteers[J]. Chin J Integr Tradit West Med, 2015, 13(2): 122−125. DOI: 10.3969/j.issn.1672-0512.2015.02.002.[3] 彭鹏, 杨光鑫, 张灵, 等. 3.0 T和1.5 T MRI定量心肌铁沉积的体外水模对比研究[J]. 实用放射学杂志, 2017, 33(12): 1951−1954. DOI: 10.3969/j.issn.1002-1671.2017.12.037.
Peng P, Yang GX, Zhang L, et al. The study of quantitative myocardial iron deposition in water phantoms at 3.0 T in comparison with 1.5 T MRI[J]. J Pract Radiol, 2017, 33(12): 1951−1954. DOI: 10.3969/j.issn.1002-1671.2017.12.037.[4] Reeder SB, Cruite I, Hamilton G, et al. Quantitative assessment of liver fat with magnetic resonance imaging and spectroscopy[J]. J Magn Reson Imaging, 2011, 34(4): 729−749. DOI: 10.1002/jmri.22775. [5] Pecorelli A, Franceschi P, Braccischi L, et al. MRI appearance of focal lesions in liver iron overload[J/OL]. Diagnostics (Basel), 2022, 12(4): 891[2022-08-06]. https://www.mdpi.com/2075-4418/12/4/891. DOI: 10.3390/diagnostics12040891. [6] França M, Carvalho JG. MR imaging assessment and quantification of liver iron[J/OL]. Abdom Radiol (NY), 2020, 45(11): 3400−3412[2022-08-06]. https://link.springer.com/article/10.1007/s00261-020-02574-8. DOI: 10.1007/s00261-020-02574-8. [7] 安梓铭, 冯琴. 磁共振质子密度脂肪分数——一种具有潜力的非酒精性脂肪性肝炎临床试验替代终点[J]. 临床肝胆病杂志, 2021, 37(6): 1445−1448. DOI: 10.3969/j.issn.1001-5256.2021.06.047.
An ZM, Feng Q. Magnetic resonance imaging-proton density fat fraction: a potential surrogate endpoint for nonalcoholic steatohepatitis clinical trials[J]. J Clin Hepatol, 2021, 37(6): 1445−1448. DOI: 10.3969/j.issn.1001-5256.2021.06.047.[8] Starekova J, Reeder SB. Liver fat quantification: where do we stand?[J/OL]. Abdom Radiol (NY), 2020, 45(11): 3386−3399[2022-08-06]. https://link.springer.com/article/10.1007/s00261-020-02783-1. DOI: 10.1007/s00261-020-02783-1. [9] Stine JG, Munaganuru N, Barnard A, et al. Change in MRI-PDFF and histologic response in patients with nonalcoholic steatohepatitis: a systematic review and meta-analysis[J]. Clin Gastroenterol Hepatol, 2021, 19(11): 2274−2283.e5. DOI: 10.1016/j.cgh.2020.08.061. [10] 洪居陆, 贺小红, 陈婉雯, 等. 对比剂对MRI非对称回波三点法水脂分离测量肝脏脂肪和铁的影响[J]. 放射学实践, 2019, 34(3): 328−331. DOI: 10.13609/j.cnki.1000-0313.2019.03.017.
Hong JL, He XH, Chen WW, et al. A preliminary study on the effect of contrast agents on the quantification of liver fat and iron using MRI IDEAL-IQ sequence[J]. Radiol Pract, 2019, 34(3): 328−331. DOI: 10.13609/j.cnki.1000-0313.2019.03.017.[11] 吴小伟, 陈自谦. 磁共振IDEAL-IQ技术对肝脏脂肪定量的应用研究进展[J]. 功能与分子医学影像学: 电子版, 2017, 6(1): 1159−1162. DOI: 10.3969/j.issn.2095-2252.2017.01.015.
Wu XW, Chen ZQ. Progress in the application of magnetic resonance IDEAL-IQ technique in liver fat quantification[J]. Funct Mol Med Imaging (Electron Ed), 2017, 6(1): 1159−1162. DOI: 10.3969/j.issn.2095-2252.2017.01.015.[12] 胡磊, 查云飞, 林苑, 等. IDEAL-IQ定量评价兔糖尿病模型椎体骨髓脂肪含量的可行性研究[J]. 磁共振成像, 2015, 6(12): 941−946. DOI: 10.3969/j.issn.1674-8034.2015.12.012.
Hu L, Zha YF, Lin Y, et al. The feasibility of IDEAL-IQ quantitative evaluation of vertebral fat fraction content in rabbit models of diabetes mellitus[J]. Chin J Magn Reson Imaging, 2015, 6(12): 941−946. DOI: 10.3969/j.issn.1674-8034.2015.12.012.[13] 朱文雁, 刘朋, 杜婧, 等. 3台不同厂家3.0 T MR设备测量非酒精性脂肪性肝病患者肝脏质子密度脂肪分数的一致性[J]. 中国医学影像学杂志, 2022, 30(2): 111−115, 128. DOI: 10.3969/j.issn.1005-5185.2022.02.004.
Zhu WY, Liu P, Du J, et al. Agreement of proton density fat fraction measurements of 3.0 T MR platforms from three different venders in patients with nonalcoholic fatty liver disease[J]. Chin J Med Imaging, 2022, 30(2): 111−115, 128. DOI: 10.3969/j.issn.1005-5185.2022.02.004.[14] Zhu AT, Hernando D, Johnson KM, et al. Characterizing a short T2* signal component in the liver using ultrashort TE chemical shift-encoded MRI at 1.5 T and 3.0 T[J]. Magn Reson Med, 2019, 82(6): 2032−2045. DOI: 10.1002/mrm.27876. [15] Roberts NT, Hinshaw LA, Colgan TJ, et al. B0 and B1 inhomogeneities in the liver at 1.5 T and 3.0 T[J]. Magn Reson Med, 2021, 85(4): 2212−2220. DOI: 10.1002/mrm.28549. [16] Serai SD, Dillman JR, Trout AT. Proton density fat fraction measurements at 1.5- and 3-T hepatic MR imaging: same-day agreement among readers and across two imager manufacturers[J]. Radiology, 2017, 284(1): 244−254. DOI: 10.1148/radiol.2017161786. [17] Liau J, Shiehmorteza M, Girard OM, et al. Evaluation of MRI fat fraction in the liver and spine pre and post SPIO infusion[J]. Magn Reson Imaging, 2013, 31(6): 1012−1016. DOI: 10.1016/j.mri.2013.01.016. [18] 中国研究型医院学会肝病专业委员会, 中国医师协会脂肪性肝病专家委员会, 中华医学会肝病学分会脂肪肝与酒精性肝病学组, 等. 脂肪性肝病诊疗规范化的专家建议(2019年修订版)[J]. 临床肝胆病杂志, 2019, 35(11): 2426−2430. DOI: 10.3969/j.issn.1001-5256.2019.11.007.
Committee of Hepatology, Chinese Research Hospital Association, Fatty Liver Expert Committee, Chinese Medical Doctor Association, National Workshop on Fatty Liver and Alcoholic Liver Disease, Chinese Society of Hepatology, et al. Expert recommendations on standardized diagnosis and treatment for fatty liver disease (2019 revised edition)[J]. J Clin Hepatol, 2019, 35(11): 2426−2430. DOI: 10.3969/j.issn.1001-5256.2019.11.007.[19] 郭若汨, 唐文杰, 朱叶青, 等. 磁共振IDEAL-IQ序列对肝脏脂肪变性和铁过载的诊断价值[J]. 中山大学学报: 医学科学版, 2015, 36(5): 689−692. DOI: 10.13471/j.cnki.j.sun.yat-sen.univ(med.sci).2015.0111.
Guo RM, Tang WJ, Zhu YQ, et al. Diagnostic value of MRI IDEAL-IQ sequence to hepatic steatosis and hepatic iron-overloaded[J]. J Sun Yat-Sen Univ (Med Sci), 2015, 36(5): 689−692. DOI: 10.13471/j.cnki.j.sun.yat-sen.univ(med.sci).2015.0111.[20] 黄璐, 韩瑞, 夏黎明. 分析1.5 T与3.0 T MR定量评价体外铁浓度模型比较研究[J]. 放射学实践, 2017, 32(10): 1014−1017. DOI: 10.13609/j.cnki.1000-0313.2017.10.004.
Huang L, Han R, Xia LM. Quantitative measurement of iron concentration in vitro model: a comparative study between 1.5 T and 3.0 T MRI[J]. Radiol Pract, 2017, 32(10): 1014−1017. DOI: 10.13609/j.cnki.1000-0313.2017.10.004.[21] Hernando D, Levin YS, Sirlin CB, et al. Quantification of liver iron with MRI: state of the art and remaining challenges[J]. J Magn Reson Imaging, 2014, 40(5): 1003−1021. DOI: 10.1002/jmri.24584. [22] Kirk P, Roughton M, Porter JB, et al. Cardiac T2* magnetic resonance for prediction of cardiac complications in thalassemia major[J]. Circulation, 2009, 120(20): 1961−1968. DOI: 10.1161/CIRCULATIONAHA.109.874487. [23] Karlsson M, Ekstedt M, Dahlström N, et al. Liver R2* is affected by both iron and fat: a dual biopsy-validated study of chronic liver disease[J]. J Magn Reson Imaging, 2019, 50(1): 325−333. DOI: 10.1002/jmri.26601. -

 点击查看大图
计量
- 文章访问数: 2121
- HTML全文浏览量: 1624
- PDF下载量: 8
