


-
目前,食管癌位居全球恶性肿瘤死亡原因的第6位[1],其中东亚地区发病率最高。食管鳞状细胞癌(esophageal squamous cell carcinoma,ESCC)占食管癌的90%以上[2],预后较差,且由于发现不及时,50%以上的患者发现时已为中晚期,无法进行手术,放疗和化疗为其主要的治疗方式。美国癌症联合委员会(American Joint Committee on Cancer, AJCC)食管癌TNM 分期对接受放化疗的ESCC患者的指导意义和预测价值有限[3-4],其预后评估主要依靠影像学方法。18F-FDG PET/CT检查作为一种有前景的影像学检查方法而备受关注[5-8],但之前的研究多局限于原发病灶,对淋巴结及远处器官转移灶的研究较少,尤其是对于部分食管癌原发灶肿瘤负荷小,而转移灶肿瘤负荷大的患者,原发灶的代谢参数无法完全反映整体肿瘤负荷。本研究提出了3个比值参数即治疗前转移灶与原发灶的SUVmax、肿瘤代谢体积(metabolic tumor volume,MTV)以及病灶糖酵解总量(total lesion glycolysis,TLG)的比值(the ratio of SUVmax,R-SUVmax)、(the ratio of MTV,R-MTV)、(the ratio of TLG,R-TLG)。本研究回顾性分析放化疗前基线18F-FDG PET/CT代谢参数对ESCC患者预后的预测价值。
-
回顾性分析2013年11月至2021年4月于青岛大学附属医院PET中心行18F-FDG PET/CT检查的食管癌患者的临床资料。纳入标准:(1)Karnofsky(KPS)评分≥70分,无严重心、肺、肝、肾功能障碍;(2)组织病理学检查确诊为ESCC;(3)伴有淋巴结转移或远处器官转移;(4)18F-FDG PET/CT检查前未接受放化疗等肿瘤相关治疗;(5)检查后2周内开始接受放化疗等相关治疗。排除标准:(1)接受食管癌相关手术;(2)合并其他肿瘤;(3)影像资料及随访资料不完整。本研究共纳入106例患者,其中男性98例、女性8例,年龄(63.9±8.8)岁。本研究已获得青岛大学附属医院伦理委员会批准(批准号:QYFY WZLL 27217)。所有患者均于检查前签署了知情同意书。
-
使用美国GE Discovery VCT 型PET/CT扫描仪进行扫描。18F-FDG由日本Sumitomo公司回旋加速器及自动合成模块生成,放射化学纯度>95%。所有患者行PET/CT检查前禁食6 h以上,血糖水平均<11.1 mmol/L。按体重静脉注射3.7~5.5 MBq/kg剂量的18F-FDG,患者静卧约60 min进行PET/CT扫描,扫描范围自颅骨顶点至股骨中段,获得全身CT图像。扫描参数:探测器覆盖范围40 mm、覆盖速度29.46 mm/s、机架旋转时间0.7 s、管电压120 kV、管电流110 mA、螺距0.516、视野70 cm、矩阵512×512、层厚3.75 mm。CT扫描后进行PET扫描,扫描条件为每个床位采集3 min,共采集7~9个床位(轴位视野70 cm)。PET图像重建采用20个子集、2次迭代的三维有序子集期望最大化算法。增加屏气胸部CT扫描,轴位胸部图像以层厚1.25 mm、间隔1.25 mm进行重建。PET图像经CT数据进行衰减校正,最终得到 PET/CT融合图像。
-
采用美国GE公司Advantage Workstation 4.7软件,参考横断面、矢状面及冠状面上的病灶图像,以40% SUVmax[9]作为阈值,自动勾画治疗前食管癌原发灶及转移灶的ROI,对于自动勾画不准确的区域由有8年以上工作经验的核医学科医师采用手动勾画的方式进行校正,获得相应的食管癌原发灶的SUVmax,原发灶的MTV (MTV of primary lesion,MTVp),原发灶的TLG(TLG of primary lesion, TLGp)和全身病灶的MTV(MTV of whole body,MTVwb),全身病灶的TLG(TLG of whole body,TLGwb),转移灶与原发灶SUVmax,MTV,TLG的比值(R-SUVmax、R-MTV、R-TLG)。所有数据由同一名核医学科医师测量和记录。转移性淋巴结的诊断标准为SUVmax>2.5[10],若其存在明显的CT良性征象,如整体高密度(CT值>71 HU)、伴有成熟钙化、淋巴结门结构清晰等,则无论18F-FDG摄取如何,均认为是良性淋巴结[11-12]。
-
对患者进行定期门诊或电话随访。随访安排在治疗结束后1个月,初始 2 年内 3 个月复查 1 次,2~5 年每半年复查 1 次,5 年以后每年复查 1 次,直至随访结束或研究结束。复查随访方案包括体格检查、实验室检查、胸部增强CT、上消化道钡剂造影、颈部及腹部超声,必要时进行胃镜及PET/CT检查。随访时间至少6个月。评价预后的指标选用无进展生存(progression-free survival,PFS)期及总生存(overall survival,OS)期。PFS期为患者行PET/CT检查之日起,至第一次疾病进展、死亡或随访截止时间;OS期为患者行PET/CT检查之日起,至因任何原因引起死亡或随访截止时间。随访截止日期为2021年11月30日。
-
采用SPSS 25.0软件对数据进行统计学分析。符合正态分布的计量资料以
$ \bar{x}\pm s $ 表示,非正态分布的计量资料以M(Q1,Q3)表示。应用X-tile软件获得原发灶SUVmax、MTVp、TLGp、MTVwb、TLGwb、R-SUVmax、R-MTV、R-TLG的最佳临界值。采用Kaplan-Meier法进行单因素分析,以Log-Rank检验进行显著性检验。通过多重共线性分析去除有影响的因素后采用Cox比例风险模型进行多因素分析。联合独立危险因素进行进一步亚组分析。P<0.05为差异有统计学意义。 -
中位随访时间为11个月。至随访结束时,84例(79.2%)患者疾病进展,其中 76例(71.7%)死亡,中位PFS期为9个月(1~63个月),中位OS期为11个月(1~63个月)。
-
18F-FDG PET/CT代谢参数预测106例ESCC患者PFS期和OS期的最佳临界值如表1所示。
参数 M(Q1, Q3) 最佳临界值 PFS期 OS期 SUVmax 13.36(9.93, 17.28) 11.2 11.2 MTVp(cm3) 20.58(10.15, 31.36) 55.0 55.0 TLGp(g) 136.90(56.65, 258.89) 434.6 223.2 MTVwb(cm3) 32.08(20.11, 65.11) 130.2 130.2 TLGwb(g) 203.47(102.91, 490.70) 466.5 724.0 R-SUVmax 0.49(0.32, 0.82) 0.7 1.9 R-MTV 0.46(0.15, 1.67) 0.1 0.8 R-TLG 0.20(0.04, 1.05) 3.6 3.6 注:FDG为氟脱氧葡萄糖;PET为正电子发射断层显像术;CT为计算机体层摄影术;PFS为无进展生存;OS为总生存;SUVmax为最大标准化摄取值;MTVp为原发灶肿瘤代谢体积;TLGp 为原发灶病灶糖酵解总量;MTVwb为全身病灶肿瘤代谢体积;TLGwb为全身病灶糖酵解总量;R-SUVmax 为转移灶与原发灶最大标准化摄取值比值;R-MTV为转移灶与原发灶肿瘤代谢体积比值;R-TLG为转移灶与原发灶病灶糖酵解总量比值 表 1 18F-FDG PET/CT代谢参数预测106例食管鳞状细胞癌 患者PFS期和OS期的最佳临界值
Table 1. The optimal cut-off values of 18F-FDG PET/CT metabolic parameters for predicting progression-free survival and overall survival in 106 patients with esophageal squamous cell carcinoma
-
单因素分析结果显示,T分期、MTVp、TLGp、MTVwb、TLGwb、R-TLG是影响接受放化疗ESCC患者PFS期及OS期(均P<0.05)的危险因素(表2,表3);多因素分析结果显示,T分期、R-TLG是影响ESCC患者PFS期(HR=2.210,95%CI:1.307~3.737,P=0.003;HR=3.118,95%CI:1.414~6.875,P=0.005)及OS期(HR=1.885,95%CI:1.072~3.317,P=0.028;HR=2.584,95%CI:1.186~5.629,P=0.017)的独立危险因素(表4)。
临床因素 例数 中位PFS期(月) χ2值 P值 中位OS期(月) χ2值 P值 年龄 2.667 0.102 0.843 0.359 ≤64岁 49 8 12 >64岁 57 10 13 性别 0.001 0.992 0.002 0.965 男 98 9 12 女 8 8 10 原发灶位置 4.374 0.112 5.710 0.058 上段 39 11 17 中段 45 9 12 下段 22 6 10 T分期 11.047 0.001 8.120 0.004 T1~2期 42 16 22 T3~4期 64 6 9 N分期 3.358 0.187 1.538 0.464 N1期 33 8 11 N2期 51 11 12 N3期 22 6 12 M分期 1.493 0.222 1.266 0.261 M0期 92 10 12 M1期 14 6 6 临床分期 0.672 0.412 0.296 0.586 Ⅰ~Ⅲ期 45 11 14 Ⅳ期 61 8 12 分化程度 0.012 0.994 0.611 0.736 低 39 9 15 中 57 9 12 高 10 11 11 治疗方式 3.478 0.176 1.997 0.367 放化疗 67 11 15 单纯放疗 14 8 10 单纯化疗 25 5 9 注:PFS为无进展生存;OS为总生存 表 2 106例食管鳞状细胞癌患者的临床特征及单因素分析
Table 2. Clinical features and univariate analysis of 106 patients with esophageal squamous cell carcinoma
因素 例数 中位PFS期 (月) χ2值 P值 因素 例数 中位OS期 (月) χ2值 P值 原发灶SUVmax 2.943 0.086 原发灶SUVmax 3.225 0.072 ≤11.2 36 14 ≤11.2 36 25 >11.2 70 8 >11.2 70 11 MTVp 10.473 0.001 MTVp 8.703 0.003 ≤55.0 cm3 95 11 ≤55.0 cm3 95 12 >55.0 cm3 11 5 >55.0 cm3 11 6 TLGp 11.138 0.001 TLGp 5.682 0.017 ≤434.6 g 90 11 ≤223.2 g 76 14 >434.6 g 16 4 >223.2 g 30 9 MTVwb 22.117 <0.001 MTVwb 14.361 <0.001 ≤130.2 cm3 95 10 ≤130.2 cm3 95 13 >130.2 cm3 11 3 >130.2 cm3 11 5 TLGwb 27.992 <0.001 TLGwb 11.517 0.001 ≤466.5 g 78 12 ≤724.0 g 92 13 >466.5 g 28 4 >724.0 g 14 5 R-SUVmax 3.199 0.074 R-SUVmax 3.758 0.053 ≤0.7 54 8 ≤1.9 90 11 >0.7 52 11 >1.9 16 25 R-MTV 3.043 0.081 R-MTV 2.247 0.134 ≤0.1 21 8 ≤0.8 64 14 >0.1 85 10 >0.8 42 10 R-TLG 6.804 0.009 R-TLG 4.105 0.043 ≤3.6 94 11 ≤3.6 94 13 >3.6 12 5 >3.6 12 7 注:FDG为氟脱氧葡萄糖;PET为正电子发射断层显像术;CT为计算机体层摄影术;PFS为无进展生存;OS为总生存;SUVmax为最大标准化摄取值;MTVp为原发灶肿瘤代谢体积;TLGp为原发灶病灶糖酵解总量;MTVwb为全身病灶肿瘤代谢体积;TLGwb为全身病灶糖酵解总量;R-SUVmax 为转移灶与原发灶最大标准化摄取值比值;R-MTV为转移灶与原发灶肿瘤代谢体积比值;R-TLG为转移灶与原发灶病灶糖酵解总量比值 表 3 18F-FDG PET/CT代谢参数预测106例食管鳞状细胞癌患者PFS期和OS期的单因素分析
Table 3. Univariate analysis of 18F-FDG PET/CT metabolic parameters for predicting progression-free survival and overall survival in 106 patients with esophageal squamous cell carcinoma
因素 PFS期 OS期 β值 Wald值 P值 HR(95%CI) β值 Wald值 P值 HR(95%CI) T分期 0.793 8.762 0.003 2.210(1.307~3.737) 0.634 4.842 0.028 1.885(1.072~3.317) MTVp −0.004 0.001 0.994 0.996(0.315~3.143) 0.424 0.708 0.400 1.528(0.569~4.102) TLGp 0.521 1.390 0.238 1.683(0.708~4.000) 0.232 0.517 0.472 1.261(0.671~2.370) MTVwb 0.715 2.317 0.128 2.045(0.814~5.136) 0.372 0.609 0.435 1.451(0.570~3.692) R-TLG 1.137 7.946 0.005 3.118(1.414~6.875) 0.949 5.711 0.017 2.584(1.186~5.629) 注:FDG为氟脱氧葡萄糖;PET为正电子发射断层显像术;CT为计算机体层摄影术;PFS为无进展生存;OS为总生存;MTVp为原发灶肿瘤代谢体积;TLGp 为原发灶病灶糖酵解总量;MTVwb为全身病灶肿瘤代谢体积;R-TLG为转移灶与原发灶病灶糖酵解总量比值 表 4 106例食管鳞状细胞癌患者PFS期和OS期的多因素分析
Table 4. Multivariate analysis for predicting progression-free survival and overall survival in 106 patients with esophageal squamous cell carcinoma
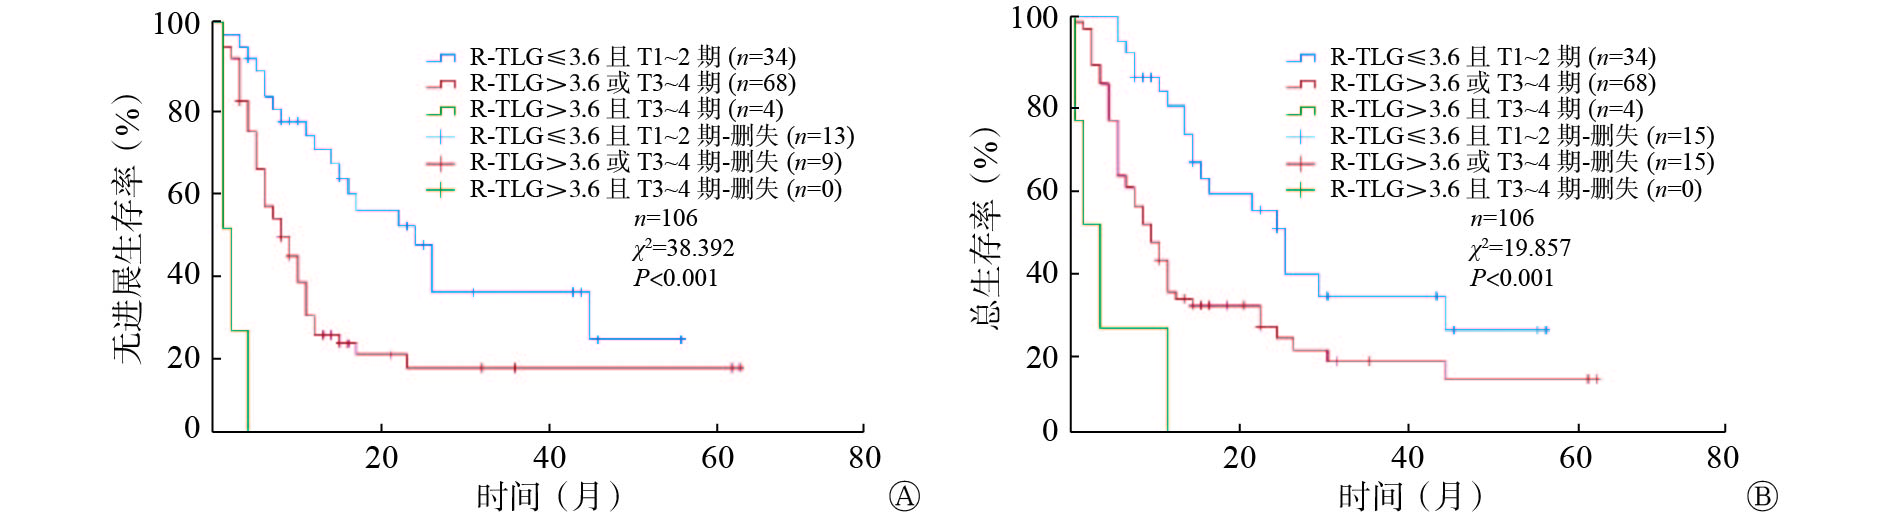
联合T分期及R-TLG将患者分为3组:低 R-TLG且T1~2期为低危组 (n=34)、高R-TLG或T3~4期为中危组(n=68)、高R-TLG且T3~4期为高危组(n=4),结果显示,各组患者间PFS期及OS期的差异均有统计学意义(χ2=38.392、19.857,均P<0.001)(图1)。T分期越高、R-TLG越大,ESCC患者生存期越短,预后越差。典型病例见图2~3。

图 1 18F-FDG PET/CT 代谢参数R-TLG联合T分期预测106例食管鳞状细胞癌患者PFS期(A)和OS期(B)预后的Kaplan-Meier生存曲线
Figure 1. Kaplan-Meier survival curves for progression-free survival and overall survival of 106 patients with esophageal squamous cell carcinoma according to 18F-FDG PET/CT metabolic parameter R-TLG combined with T stage

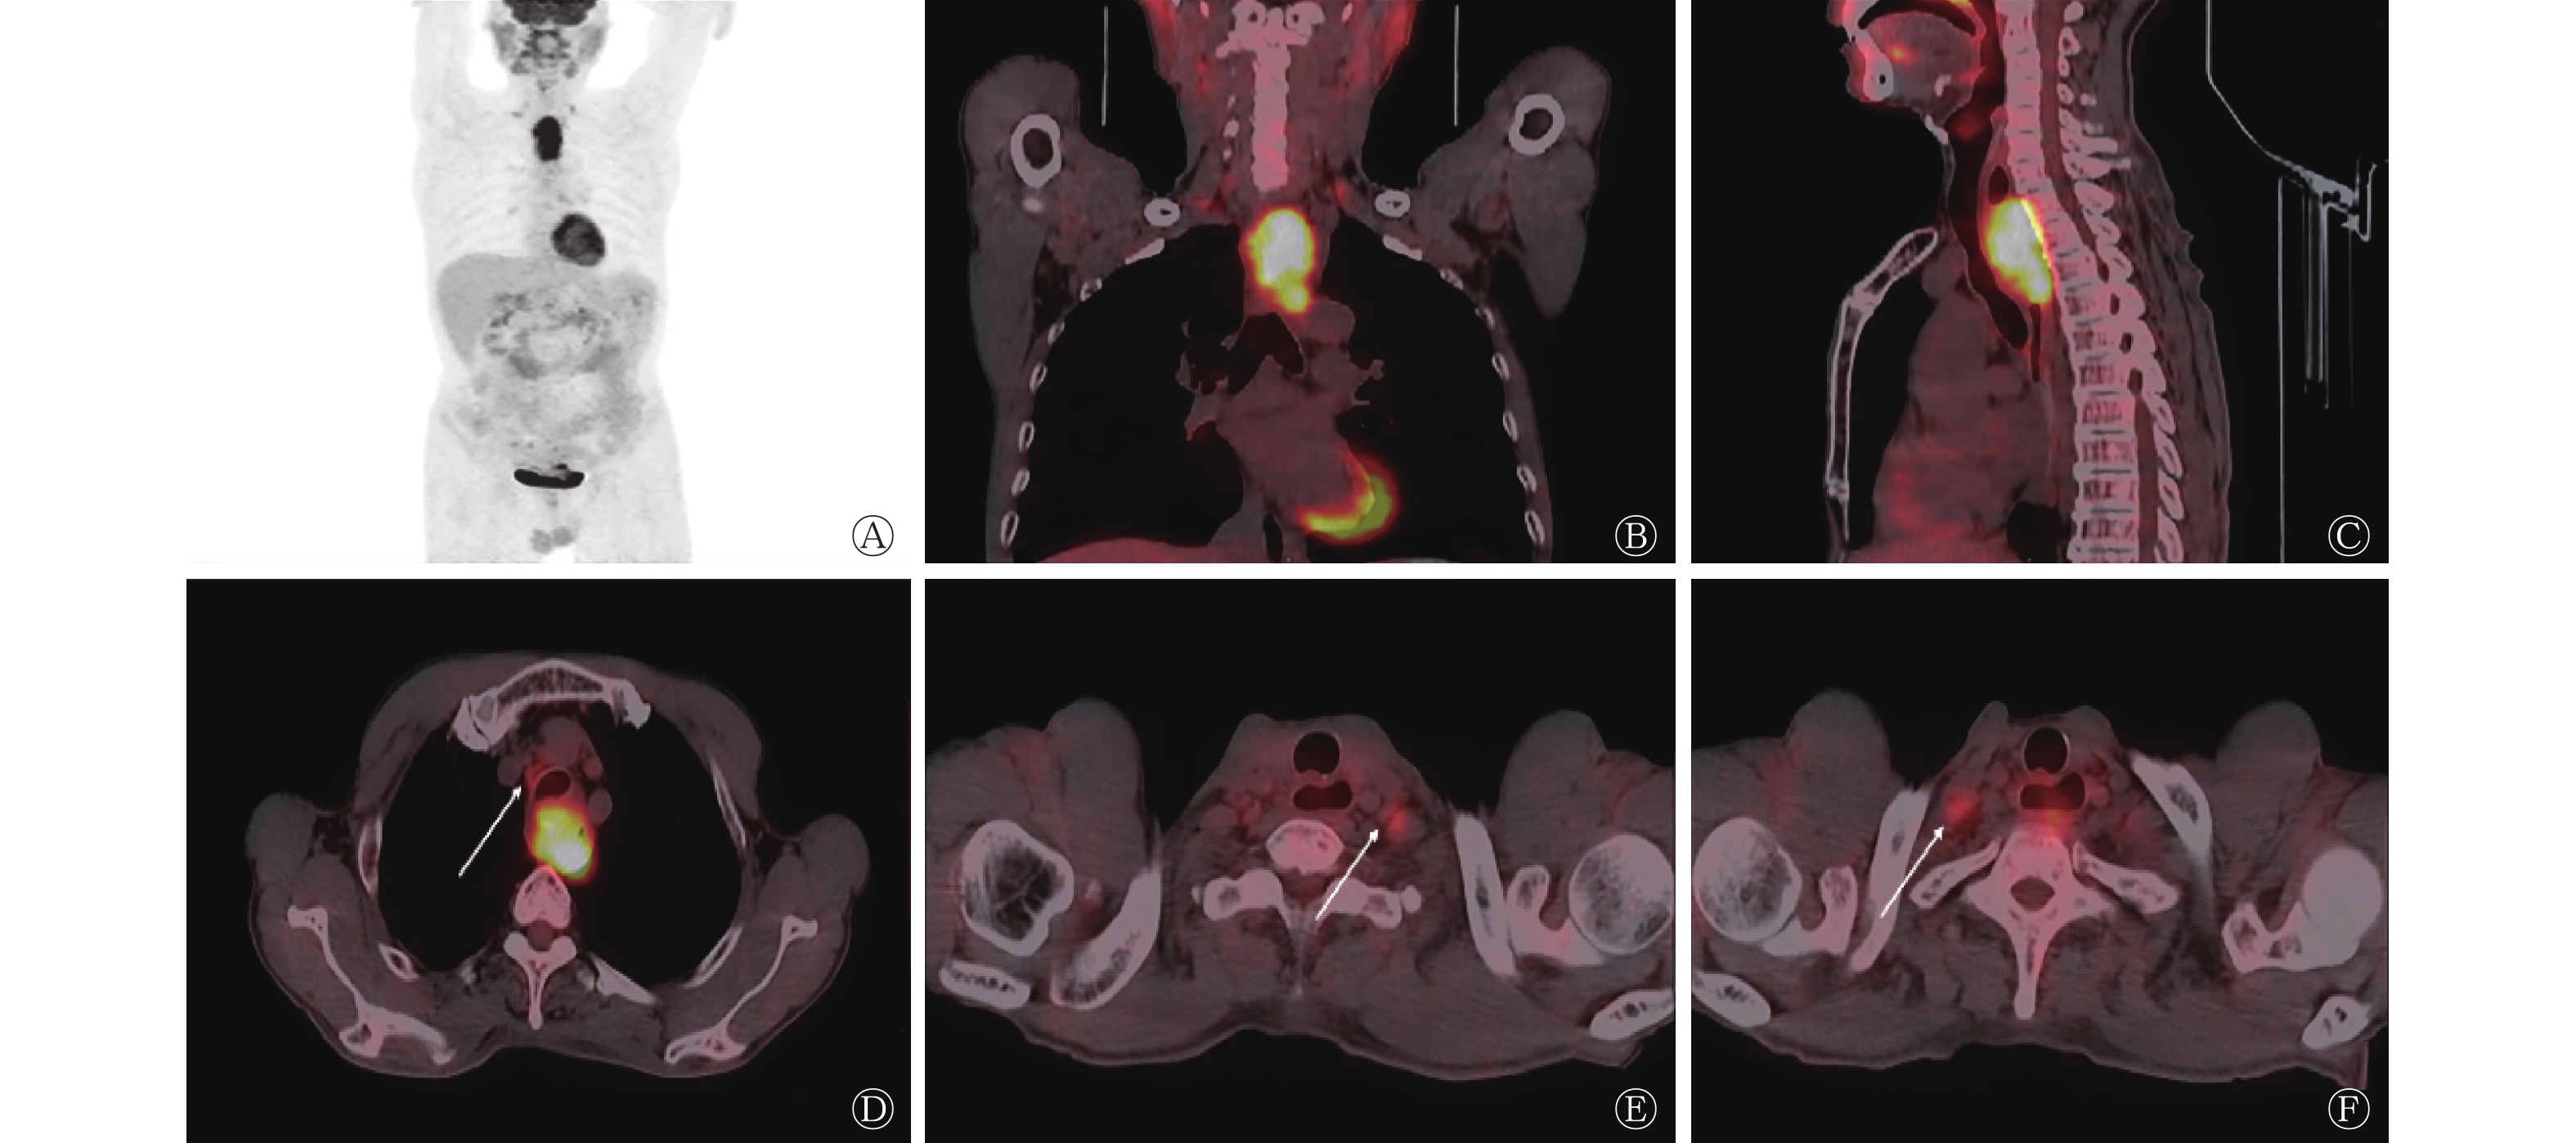
图 2 低R-TLG食管鳞状细胞癌患者(男性,55岁)的18F-FDG PET/CT显像图
Figure 2. 18F-FDG PET/CT images of a patient (male, 55 years old) with esophageal squamous cell carcinoma with low R-TLG

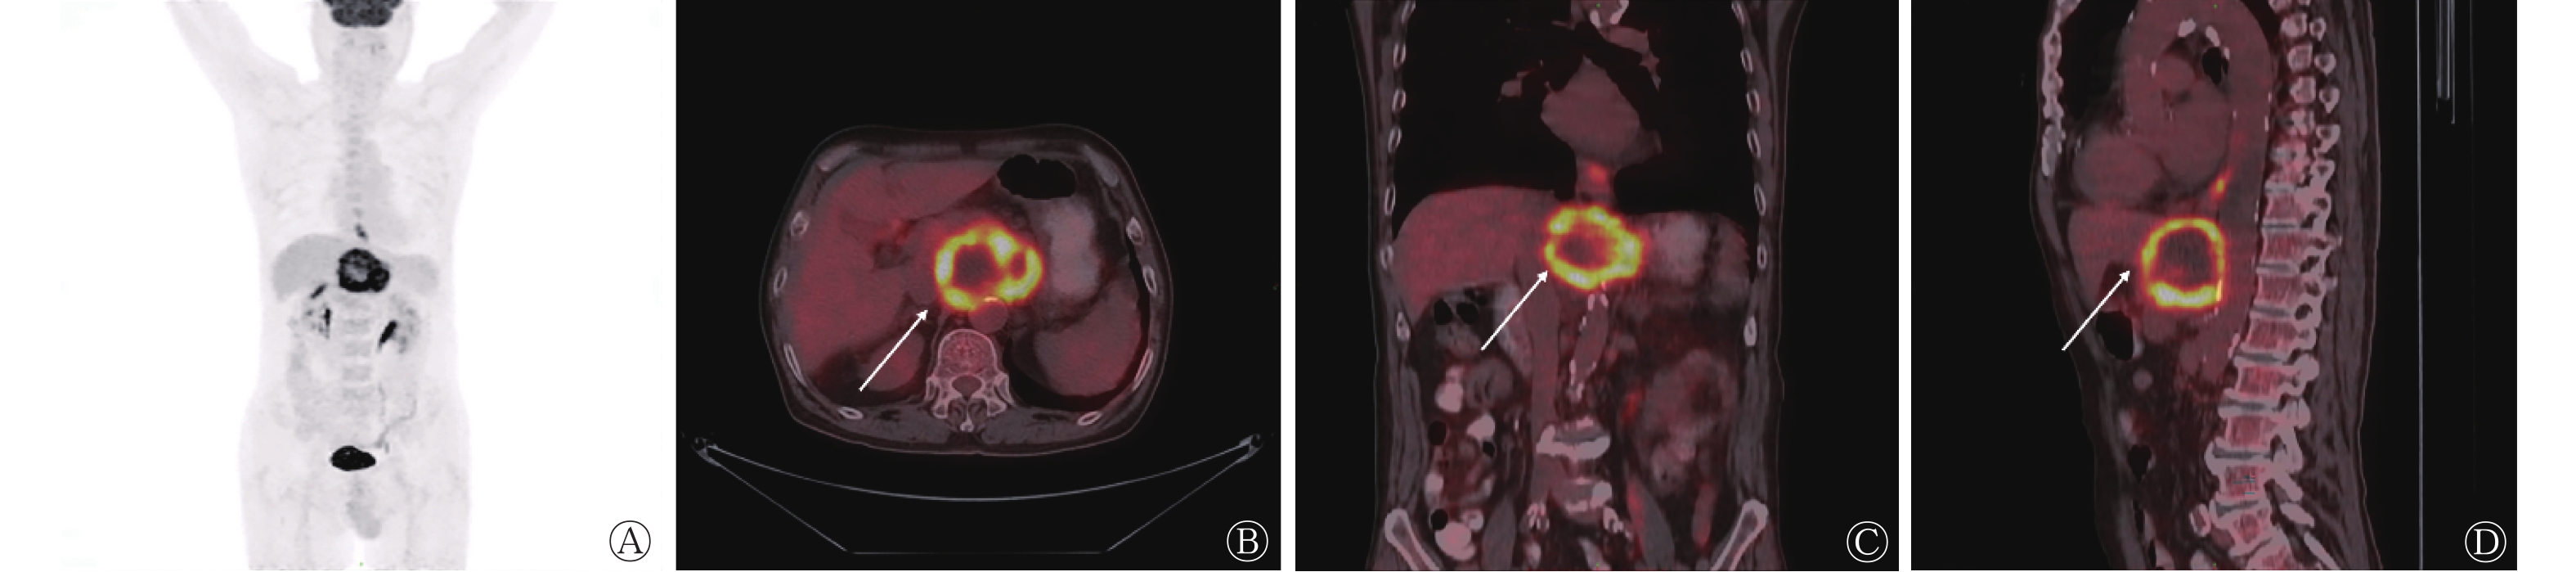
图 3 高R-TLG食管鳞状细胞癌患者(男性,72岁)的18F-FDG PET/CT显像图
Figure 3. 18F-FDG PET/CT images of a patient (male, 72 years old) with esophageal squamous cell carcinoma with high R-TLG
-
食管癌预后较差,尤其对于无法接受手术治疗的中晚期患者[13],其治疗方式主要为放疗和化疗。由于无法取得组织病理学分期,其预后评估主要依靠影像学方法。传统影像学方法对于水肿、坏死、瘢痕或残存肿瘤组织无法准确区分,不能充分反映肿瘤负荷。而18F-FDG PET/CT检查通过糖代谢的变化来评估全身肿瘤负荷,不仅能够提供解剖学信息,还能反应肿瘤的生物学信息。
SUVmax为应用最广泛的代谢参数之一,但目前关于SUVmax在食管癌预后中的意义仍有争议[14-16]。本研究结果表明,SUVmax对预测接受放化疗的ESCC患者预后无参考价值,而MTV及TLG相关参数对预后有参考价值,这与其他研究结果一致[17-19]。本研究的重点为代谢参数比值对于接受放化疗的ESCC患者预后的影响,结果表明,R-TLG对其具有独立预后意义。之前的研究大多基于原发灶本身,而忽视了淋巴结及远处器官转移对预后的影响[5-8]。如Li 等[5] 对86例接受非手术治疗的ESCC患者进行研究,结果证实治疗前MTVp和TLGp是预测ESCC患者预后的良好指标;Shen等[7]的研究结果表明,原发灶SUVmax、MTVp、TLGp和血清鳞状细胞癌抗原(SCC-Ag)为预测ESCC患者OS期的独立预后因素;这些研究均只探讨了原发灶的相关参数。也有研究除TLGp外还分析了TLGwb,结果证实TLGwb是手术治疗ESCC患者OS期和PFS期的重要预后因素[20-21]。汤泊等[22]研究结果表明,食管癌放化疗前的TLGwb为影响食管癌患者预后的独立危险因素。邱云亮等[23]研究了73例老年ESCC患者,结果也表明治疗前TLGwb是老年ESCC患者预后的独立危险因素。根据我们的研究结果,在单因素分析中TLGp及TLGwb与预后相关,但多因素分析结果显示,R-TLG而非TLGp或TLGwb为ESCC患者的独立预后因素,这可能与比值参数的参数校正作用有关,R-TLG能够减少示踪剂剂量和患者体重的不确定性、减少采集时间、图像重建及机器校准等因素所带来的影响[24] ,对预测患者的预后意义更大。
迄今为止,转移灶与原发灶代谢参数比值在食管癌中的研究较少。之前有关于SUVmax比值参数的相关研究,如Lin等[25]分析根治性放化疗前ESCC患者转移淋巴结SUVmax与原发肿瘤SUVmax比值(SUVLN/SUVTumor)的预后价值,结果表明,该比值是患者无远处转移生存率和OS期的独立预后因素;Chen等[26]对于非手术治疗食管癌的研究也得到类似结果。在本研究中,我们不局限于转移淋巴结,远处器官转移也是我们的研究范围,这样更加能够反映患者的整体情况。此外,本研究不仅关注转移灶与原发灶SUVmax的比值,R-MTV和R-TLG比值参数也被纳入研究。本研究结果表明,R-TLG可以从糖代谢负荷方面反映肿瘤的侵袭性,与R-TLG较高的ESCC患者相比,R-TLG较低的患者OS期更长,结果证实了转移灶与原发灶相对代谢负荷的重要性,表明R-TLG在放化疗ESCC患者预后分层中的重要意义。
本研究采用第8版美国癌症联合委员会食管癌 TNM 分期标准[4],结果表明,T分期为影响接受放化疗ESCC患者生存的重要因素。我们联合T分期及R-TLG将患者分为3个亚组进行分析,结果显示各组之间OS期存在差异,进一步表明二者在接受放化疗ESCC患者中的预后价值,可以很好地对患者进行危险分层。
本研究存在一定的局限性:(1)本研究为回顾性研究,存在选择偏倚;(2)本研究为单中心研究且样本量较少;(3)本研究对象为接受放化疗的ESCC患者,结果是否适用于其他患者尚未可知。
综上所述,ESCC患者放化疗前T分期及18F-FDG PET/CT代谢参数R-TLG为PFS期及OS期的独立预后因素,可以指导临床对患者进行危险度的分层,从而制定个体化的治疗方案,使患者获益。
利益冲突 所有作者声明无利益冲突
作者贡献声明 夏连爽负责文献的检索、数据的收集、统计与分析、论文的撰写与修改;王洋洋、董娴宁负责文献的检索与分析;杨光杰负责命题的提出与设计;李晓旭、高宅崧、张驹负责数据的收集、统计与分析;王振光负责命题的提出与设计、论文的修改与审阅
基线18F-FDG PET/CT代谢参数对伴有转移的食管鳞状细胞癌放化疗患者预后的预测价值
Prognostic value of baseline 18F-FDG PET/CT metabolic parameters in the prognosis of patients with metastasis esophageal squamous cell carcinoma with chemoradiotherapy
-
摘要:
目的 探究治疗前18F-氟脱氧葡萄糖(FDG) PET/CT显像原发灶与转移灶代谢参数对接受放化疗的食管鳞状细胞癌(ESCC)患者预后的预测价值。 方法 回顾性分析2013年11月至2021年4月于青岛大学附属医院行18F-FDG PET/CT检查的106例接受放化疗的ESCC患者的临床资料,其中男性98例、女性8例,年龄(63.9±8.8)岁。临床因素包括年龄、性别、原发灶位置、临床分期、分化程度和治疗方式。以40%最大标准化摄取值(SUVmax)作为阈值,勾画治疗前食管癌原发病灶及转移灶的感兴趣区(ROI),获得相应的食管癌原发灶的SUVmax,原发灶的肿瘤代谢体积(MTVp),原发灶的病灶糖酵解总量(TLGp)和全身病灶的MTV(MTVwb),全身病灶的TLG(TLGwb),转移灶与原发灶SUVmax,MTV,TLG的比值(R-SUVmax、R-MTV、R-TLG)。采用Kaplan-Meier法及Log-Rank检验进行单因素分析,采用Cox比例风险模型进行多因素分析,预测影响患者无进展生存(PFS)期及总生存(OS)期的预后因素。 结果 单因素分析结果显示,T分期、MTVp、TLGp、MTVwb、TLGwb及R-TLG是影响接受放化疗ESCC患者PFS期和OS期的危险因素(χ2=4.105~27.992,均P<0.05);多因素分析结果显示,T分期及R-TLG为ESCC患者PFS期(HR=2.210,95%CI:1.307~3.737,P=0.003;HR=3.118,95%CI:1.414~6.875,P=0.005)及OS期(HR=1.885,95%CI:1.072~3.317,P=0.028;HR=2.584,95%CI:1.186~5.629;P=0.017)的独立预后因素。联合T分期及R-TLG将患者分为低、中、高危3组,结果显示,各组患者间PFS期及OS期的差异均有统计学意义(χ2=38.392、19.857,均P<0.001)。 结论 ESCC患者放化疗前T分期和18F-FDG PET/CT代谢参数R-TLG为PFS期及OS期的独立预后因素。 -
关键词:
- 食管肿瘤 /
- 癌,鳞状细胞 /
- 正电子发射断层显像术 /
- 体层摄影术,X线计算机 /
- 氟脱氧葡萄糖F18 /
- 预后
Abstract:Objective To investigate the prognostic value of primary and metastatic metabolic parameters of 18F-fluorodeoxyglucose(FDG) PET/CT imaging before chemoradiotherapy in patients with esophageal squamous cell carcinoma (ESCC). Methods A retrospective analysis was performed on 106 patients [98 males, 8 females, aged (63.9±8.8) years] with metastatic ESCC who received radiochemotherapy and underwent 18F-FDG PET/CT from November 2013 to April 2021 in the Affiliated Hospital of Qingdao University. Clinical factors included age, sex, primary location, clinical stage, degree of differentiation, and treatment. Using 40% maximum standardized uptake value (SUVmax) as the threshold, delineate the region of interest (ROI) of the primary and metastatic lesions of esophageal cancer before treatment. Metabolic parameters included SUVmax of primary lesion, metabolic tumor volume (MTV) of primary lesion (MTVp), total lesion glycolysis (TLG) of primary lesion (TLGp), MTV of whole body (MTVwb), TLG of whole body (TLGwb), and SUVmax, MTV, TLG ratio of metastatic lesion to primary lesion (R-SUVmax, R-MTV, R-TLG). Kaplan-Meier method and Log-Rank test were used for univariate analysis and multivariate analysis was conducted by Cox proportional hazards model to predict the prognostic factors affecting progression-free survival (PFS) and overall survival (OS) of patients. Results Univariate analysis showed that T stage, MTVp, TLGp, MTVwb, TLGwb and R-TLG were prognostic factors for PFS and OS in ESCC patients receiving chemoradiotherapy (χ2=4.105−27.992, all P<0.05). Multivariate analysis showed that T stage and R-TLG were independent prognostic factors for PFS (HR=2.210, 95%CI: 1.307−3.737, P=0.003; HR=3.118, 95%CI: 1.414−6.875, P=0.005) and OS (HR=1.885, 95%CI: 1.072−3.317, P=0.028; HR=2.584, 95%CI: 1.186−5.629, P=0.017) in ESCC patients. Combined with T stage and R-TLG, the patients were divided into low-risk, medium-risk and high-risk groups. The results showed that there were statistically significant differences in PFS and OS among the groups (χ2=38.392, 19.857; both P<0.001). Conclusion T stage and 18F-FDG PET/CT metabolic parameter R-TLG were independent prognostic factors for PFS and OS in ESCC patients before chemoradiotherapy. -
图 1 18F-FDG PET/CT 代谢参数R-TLG联合T分期预测106例食管鳞状细胞癌患者PFS期(A)和OS期(B)预后的Kaplan-Meier生存曲线
Figure 1. Kaplan-Meier survival curves for progression-free survival and overall survival of 106 patients with esophageal squamous cell carcinoma according to 18F-FDG PET/CT metabolic parameter R-TLG combined with T stage
图 2 低R-TLG食管鳞状细胞癌患者(男性,55岁)的18F-FDG PET/CT显像图
Figure 2. 18F-FDG PET/CT images of a patient (male, 55 years old) with esophageal squamous cell carcinoma with low R-TLG
图 3 高R-TLG食管鳞状细胞癌患者(男性,72岁)的18F-FDG PET/CT显像图
Figure 3. 18F-FDG PET/CT images of a patient (male, 72 years old) with esophageal squamous cell carcinoma with high R-TLG
表 1 18F-FDG PET/CT代谢参数预测106例食管鳞状细胞癌 患者PFS期和OS期的最佳临界值
Table 1. The optimal cut-off values of 18F-FDG PET/CT metabolic parameters for predicting progression-free survival and overall survival in 106 patients with esophageal squamous cell carcinoma
参数 M(Q1, Q3) 最佳临界值 PFS期 OS期 SUVmax 13.36(9.93, 17.28) 11.2 11.2 MTVp(cm3) 20.58(10.15, 31.36) 55.0 55.0 TLGp(g) 136.90(56.65, 258.89) 434.6 223.2 MTVwb(cm3) 32.08(20.11, 65.11) 130.2 130.2 TLGwb(g) 203.47(102.91, 490.70) 466.5 724.0 R-SUVmax 0.49(0.32, 0.82) 0.7 1.9 R-MTV 0.46(0.15, 1.67) 0.1 0.8 R-TLG 0.20(0.04, 1.05) 3.6 3.6 注:FDG为氟脱氧葡萄糖;PET为正电子发射断层显像术;CT为计算机体层摄影术;PFS为无进展生存;OS为总生存;SUVmax为最大标准化摄取值;MTVp为原发灶肿瘤代谢体积;TLGp 为原发灶病灶糖酵解总量;MTVwb为全身病灶肿瘤代谢体积;TLGwb为全身病灶糖酵解总量;R-SUVmax 为转移灶与原发灶最大标准化摄取值比值;R-MTV为转移灶与原发灶肿瘤代谢体积比值;R-TLG为转移灶与原发灶病灶糖酵解总量比值  下载: 导出CSV
表 2 106例食管鳞状细胞癌患者的临床特征及单因素分析
Table 2. Clinical features and univariate analysis of 106 patients with esophageal squamous cell carcinoma
临床因素 例数 中位PFS期(月) χ2值 P值 中位OS期(月) χ2值 P值 年龄 2.667 0.102 0.843 0.359 ≤64岁 49 8 12 >64岁 57 10 13 性别 0.001 0.992 0.002 0.965 男 98 9 12 女 8 8 10 原发灶位置 4.374 0.112 5.710 0.058 上段 39 11 17 中段 45 9 12 下段 22 6 10 T分期 11.047 0.001 8.120 0.004 T1~2期 42 16 22 T3~4期 64 6 9 N分期 3.358 0.187 1.538 0.464 N1期 33 8 11 N2期 51 11 12 N3期 22 6 12 M分期 1.493 0.222 1.266 0.261 M0期 92 10 12 M1期 14 6 6 临床分期 0.672 0.412 0.296 0.586 Ⅰ~Ⅲ期 45 11 14 Ⅳ期 61 8 12 分化程度 0.012 0.994 0.611 0.736 低 39 9 15 中 57 9 12 高 10 11 11 治疗方式 3.478 0.176 1.997 0.367 放化疗 67 11 15 单纯放疗 14 8 10 单纯化疗 25 5 9 注:PFS为无进展生存;OS为总生存
下载: 导出CSV
表 3 18F-FDG PET/CT代谢参数预测106例食管鳞状细胞癌患者PFS期和OS期的单因素分析
Table 3. Univariate analysis of 18F-FDG PET/CT metabolic parameters for predicting progression-free survival and overall survival in 106 patients with esophageal squamous cell carcinoma
因素 例数 中位PFS期 (月) χ2值 P值 因素 例数 中位OS期 (月) χ2值 P值 原发灶SUVmax 2.943 0.086 原发灶SUVmax 3.225 0.072 ≤11.2 36 14 ≤11.2 36 25 >11.2 70 8 >11.2 70 11 MTVp 10.473 0.001 MTVp 8.703 0.003 ≤55.0 cm3 95 11 ≤55.0 cm3 95 12 >55.0 cm3 11 5 >55.0 cm3 11 6 TLGp 11.138 0.001 TLGp 5.682 0.017 ≤434.6 g 90 11 ≤223.2 g 76 14 >434.6 g 16 4 >223.2 g 30 9 MTVwb 22.117 <0.001 MTVwb 14.361 <0.001 ≤130.2 cm3 95 10 ≤130.2 cm3 95 13 >130.2 cm3 11 3 >130.2 cm3 11 5 TLGwb 27.992 <0.001 TLGwb 11.517 0.001 ≤466.5 g 78 12 ≤724.0 g 92 13 >466.5 g 28 4 >724.0 g 14 5 R-SUVmax 3.199 0.074 R-SUVmax 3.758 0.053 ≤0.7 54 8 ≤1.9 90 11 >0.7 52 11 >1.9 16 25 R-MTV 3.043 0.081 R-MTV 2.247 0.134 ≤0.1 21 8 ≤0.8 64 14 >0.1 85 10 >0.8 42 10 R-TLG 6.804 0.009 R-TLG 4.105 0.043 ≤3.6 94 11 ≤3.6 94 13 >3.6 12 5 >3.6 12 7 注:FDG为氟脱氧葡萄糖;PET为正电子发射断层显像术;CT为计算机体层摄影术;PFS为无进展生存;OS为总生存;SUVmax为最大标准化摄取值;MTVp为原发灶肿瘤代谢体积;TLGp为原发灶病灶糖酵解总量;MTVwb为全身病灶肿瘤代谢体积;TLGwb为全身病灶糖酵解总量;R-SUVmax 为转移灶与原发灶最大标准化摄取值比值;R-MTV为转移灶与原发灶肿瘤代谢体积比值;R-TLG为转移灶与原发灶病灶糖酵解总量比值
下载: 导出CSV
表 4 106例食管鳞状细胞癌患者PFS期和OS期的多因素分析
Table 4. Multivariate analysis for predicting progression-free survival and overall survival in 106 patients with esophageal squamous cell carcinoma
因素 PFS期 OS期 β值 Wald值 P值 HR(95%CI) β值 Wald值 P值 HR(95%CI) T分期 0.793 8.762 0.003 2.210(1.307~3.737) 0.634 4.842 0.028 1.885(1.072~3.317) MTVp −0.004 0.001 0.994 0.996(0.315~3.143) 0.424 0.708 0.400 1.528(0.569~4.102) TLGp 0.521 1.390 0.238 1.683(0.708~4.000) 0.232 0.517 0.472 1.261(0.671~2.370) MTVwb 0.715 2.317 0.128 2.045(0.814~5.136) 0.372 0.609 0.435 1.451(0.570~3.692) R-TLG 1.137 7.946 0.005 3.118(1.414~6.875) 0.949 5.711 0.017 2.584(1.186~5.629) 注:FDG为氟脱氧葡萄糖;PET为正电子发射断层显像术;CT为计算机体层摄影术;PFS为无进展生存;OS为总生存;MTVp为原发灶肿瘤代谢体积;TLGp 为原发灶病灶糖酵解总量;MTVwb为全身病灶肿瘤代谢体积;R-TLG为转移灶与原发灶病灶糖酵解总量比值
下载: 导出CSV
-
[1] Smyth EC, Lagergren J, Fitzgerald RC, et al. Oesophageal cancer[J/OL]. Nat Rev Dis Primers, 2017, 3: 17048[2022-08-01]. https://www.nature.com/articles/nrdp201748. DOI: 10.1038/nrdp.2017.48. [2] Arnold M, Soerjomataram I, Ferlay J, et al. Global incidence of oesophageal cancer by histological subtype in 2012[J]. Gut, 2015, 64(3): 381−387. DOI: 10.1136/gutjnl-2014-308124. [3] Foley K, Findlay J, Goh V. Novel imaging techniques in staging oesophageal cancer[J]. Best Pract Res Clin Gastroenterol, 2018, 36-37: 17−25. DOI: 10.1016/j.bpg.2018.11.009. [4] Rice TW, Patil DT, Blackstone EH. 8th edition AJCC/UICC staging of cancers of the esophagus and esophagogastric junction: application to clinical practice[J]. Ann Cardiothorac Surg, 2017, 6(2): 119−130. DOI: 10.21037/acs.2017.03.14. [5] Li YM, Lin Q, Zhao L, et al. Pre-treatment metabolic tumor volume and total lesion glycolysis are useful prognostic factors for esophageal squamous cell cancer patients[J]. Asian Pac J Cancer Prev, 2014, 15(3): 1369−1373. DOI: 10.7314/apjcp.2014.15.3.1369. [6] Martínez A, Infante JR, Quirós J, et al. Baseline 18F-FDG PET/CT quantitative parameters as prognostic factors in esophageal squamous cell cancer[J/OL]. Rev Esp Med Nucl Imagen Mol (Engl Ed), 2022, 41(3): 164-170[2022-08-01].https://www.sciencedirect.com/science/article/abs/pii/S2253808921001270?via%3Dihub. DOI: 10.1016/j.remnie.2021.07.006. [7] Shen DHY, Chan HP, Tsai FR, et al. Prognostic value of 18F-FDG PET/CT volume-based metabolic parameters in patients with node-negative stage Ⅱ esophageal squamous cell carcinoma[J/OL]. Metabolites, 2021, 12(1): 7[2022-08-01].https://www.mdpi.com/2218-1989/12/1/7. DOI: 10.3390/metabo12010007. [8] 林虹霄, 钱立庭, 潘博, 等. FDG PET-CT显像代谢参数与食管癌放疗预后相关性研究[J]. 中华放射肿瘤学杂志, 2017, 26(12): 1394−1398. DOI: 10.3760/cma.j.issn.1004-4221.2017.12.008.
Lin HX, Qian LT, Pan B, et al. Prognostic value of FDG PET-CT metabolic parameters before radiotherapy in patients with esophageal cancer receiving radiotherapy[J]. Chin J Radiat Oncol, 2017, 26(12): 1394−1398. DOI: 10.3760/cma.j.issn.1004-4221.2017.12.008.[9] Lemarignier C, Di Fiore F, Marre C, et al. Pretreatment metabolic tumour volume is predictive of disease-free survival and overall survival in patients with oesophageal squamous cell carcinoma[J]. Eur J Nucl Med Mol Imaging, 2014, 41(11): 2008−2016. DOI: 10.1007/s00259-014-2839-y. [10] Tanabe S, Naomoto Y, Shirakawa Y, et al. F-18 FDG PET/CT contributes to more accurate detection of lymph nodal metastasis from actively proliferating esophageal squamous cell carcinoma[J]. Clin Nucl Med, 2011, 36(10): 854−859. DOI: 10.1097/RLU.0b013e318217adc9. [11] Liao SQ, Wei WW, Zhang SL, et al. Modified method to improve the diagnostic efficiency of 18F-FDG PET/CT in regional lymph node metastasis of esophageal squamous cell carcinoma[J]. Ann Transl Med, 2021, 9(20): 1549. DOI: 10.21037/atm-21-4926. [12] Kim SH, Lee KN, Kang EJ, et al. Hounsfield units upon PET/CT are useful in evaluating metastatic regional lymph nodes in patients with oesophageal squamous cell carcinoma[J]. Br J Radiol, 2012, 85(1013): 606−612. DOI: 10.1259/bjr/73516936. [13] Minsky BD, Pajak TF, Ginsberg RJ, et al. INT 0123 (Radiation Therapy Oncology Group 94-05) phase Ⅲ trial of combined-modality therapy for esophageal cancer: high-dose versus standard-dose radiation therapy[J]. J Clin Oncol, 2002, 20(5): 1167−1174. DOI: 10.1200/jco.2002.20.5.1167. [14] Lee S, Choi Y, Park G, et al. 18F-FDG PET/CT parameters for predicting prognosis in esophageal cancer patients treated with concurrent chemoradiotherapy[J]. Technol Cancer Res Treat, 2021, 20: 1−7. DOI: 10.1177/15330338211024655. [15] Jayachandran P, Pai RK, Quon A, et al. Postchemoradiotherapy positron emission tomography predicts pathologic response and survival in patients with esophageal cancer[J]. Int J Radiat Oncol Biol Phys, 2012, 84(2): 471−477. DOI: 10.1016/j.ijrobp.2011.12.029. [16] Hatt M, Visvikis D, Albarghach NM, et al. Prognostic value of 18F-FDG PET image-based parameters in oesophageal cancer and impact of tumour delineation methodology[J]. Eur J Nucl Med Mol Imaging, 2011, 38(7): 1191−1202. DOI: 10.1007/s00259-011-1755-7. [17] Chang S, Kim SJ. Prediction of recurrence and mortality of locally advanced esophageal cancer patients using pretreatment F-18 FDG PET/CT parameters: intratumoral heterogeneity, SUV, and volumetric parameters[J]. Cancer Biother Radiopharm, 2016, 31(1): 1−6. DOI: 10.1089/cbr.2015.1932. [18] Krengli M, Ferrara E, Guaschino R, et al. 18F-FDG PET/CT as predictive and prognostic factor in esophageal cancer treated with combined modality treatment[J]. Ann Nucl Med, 2022, 36(5): 450−459. DOI: 10.1007/s12149-022-01733-9. [19] Han S, Kim YJ, Woo S, et al. Prognostic value of volumetric parameters of pretreatment 18F-FDG PET/CT in esophageal cancer: a systematic review and meta-analysis[J]. Clin Nucl Med, 2018, 43(12): 887−894. DOI: 10.1097/rlu.0000000000002291. [20] Park SY, Lee SJ, Yoon JK. The prognostic value of total lesion glycolysis via 18F-fluorodeoxyglucose PET-CT in surgically treated esophageal squamous cell carcinoma[J]. Ann Nucl Med, 2016, 30(1): 81−88. DOI: 10.1007/s12149-015-1034-y. [21] Takahashi N, Umezawa R, Takanami K, et al. Whole-body total lesion glycolysis is an independent predictor in patients with esophageal cancer treated with definitive chemoradiotherapy[J]. Radiother Oncol, 2018, 129(1): 161−165. DOI: 10.1016/j.radonc.2017.10.019. [22] 汤泊, 周东亚, 刘敏, 等. 18F-FDG PET/CT测算病灶糖酵解总量预测食管癌患者经放射及化学治疗预后[J]. 中国医学影像技术, 2021, 37(11): 1680−1684. DOI: 10.13929/j.issn.1003-3289.2021.11.021.
Tang B, Zhou DY, Liu M, et al. 18F-FDG PET/CT measurement of total lesion glycolysis for predicting prognosis of patients with esophageal cancer after radiotherapy and chemotherapy[J]. Chin J Med Imaging Technol, 2021, 37(11): 1680−1684. DOI: 10.13929/j.issn.1003-3289.2021.11.021.[23] 邱云亮, 郭喆, 孙晋, 等. 18F-FDG PET/CT代谢参数预测老年食管鳞癌预后的价值[J]. 中国医学影像学杂志, 2021, 29(10): 998−1002. DOI: 10.3969/j.issn.1005-5185.2021.10.009.
Qiu YL, Guo Z, Sun J, et al. Prognostic value of 18F-FDG PET/CT metabolic parameters in elderly esophageal squamous cell carcinoma[J]. Chin J Med Imaging, 2021, 29(10): 998−1002. DOI: 10.3969/j.issn.1005-5185.2021.10.009.[24] Bütof R, Hofheinz F, Zöphel K, et al. Prognostic value of standardized uptake ratio in patients with trimodality treatment of locally advanced esophageal carcinoma[J]. J Nucl Med, 2019, 60(2): 192−198. DOI: 10.2967/jnumed.117.207670. [25] Lin CH, Hung TM, Chang YC, et al. Prognostic value of lymph node-to-primary tumor standardized uptake value ratio in esophageal squamous cell carcinoma treated with definitive chemoradiotherapy[J/OL]. Cancers (Basel), 2020, 12(3): 607[2022-08-01]. https://www.mdpi.com/2072-6694/12/3/607. DOI: 10.3390/cancers12030607. [26] Chen PJ, Yap WK, Chang YC, et al. Prognostic value of lymph node to primary tumor standardized uptake value ratio in unresectable esophageal cancer[J/OL]. BMC Cancer, 2020, 20(1): 545[2022-08-01]. https://bmccancer.biomedcentral.com/articles/10.1186/s12885-020-07044-4. DOI: 10.1186/s12885-020-07044-4. -

 点击查看大图
计量
- 文章访问数: 2932
- HTML全文浏览量: 2269
- PDF下载量: 33
