


-
移动式CT可应用于床旁CT检查等普通CT难以使用的条件下,被广泛应用于重症监护室[1-2]、手术室[3]、野战医院[4]等场所,减少了搬运的麻烦,并降低了外出对重症患者造成的风险[5],为医学诊断和治疗提供了便利,为更好地服务重症、急症患者提供了保障,更是为院外诊疗提供了丰富和适用的放射诊断设备。移动式CT还可用于传染病爆发期间需要严格隔离感染者的检查和诊断,可以防止交叉感染,减少传染病的传播[6]。移动式CT设备机架的周围剂量当量率远低于常规CT,对陪检者、公众和医护人员的辐射影响相对较小,更利于野外急救场所、方舱医院、临时放射科等临时放射工作场所使用[7]。对于多用于无屏蔽机房或辐射屏蔽设施缺乏场所的移动式CT,其曝光时的辐射剂量场分布的研究对于工作场所控制区和监督区的划分具有重要的指导作用,对于辐射安全管理[8]、职业照射和公众照射的控制具有重要作用。目前,国内外对于移动式CT辐射剂量场分布的测量方案的研究较少[9]。本研究旨在通过对国内新研发的平板探测器EVISION-720型移动式头部锥形束CT(简称EVISION-720型移动式CT)不同点位的周围剂量当量率进行测量,明确该移动式CT的辐射防护方案,并为其辐射屏蔽设计和现场使用条件下防护设施的设置提供技术指导。
-
EVISION-720型移动式CT(天津金曦医疗设备有限公司)的额定参数有3种:70 kV/60 mA、90 kV/40 mA和110 kV/20 mA;扫描视野为250 mm,重建视野为54~250 mm,扫描口中心距离地面0.8 m,扫描孔径为420 mm,360°轴扫,每旋转1周即完成全部扫描,无需多次曝光,曝光时间为12 s/周。设备内部设置铅防护板,其中底部为1 mm铅板,其余位置为0.8 mm铅板;扫描孔两侧安装0.8 mm Pb铅防护帘。
-
辐射剂量仪为白俄罗斯ATOMTEX公司AT1123型X、γ辐射剂量仪(以下简称辐射剂量仪);散射体(天津金曦医疗设备有限公司)为直径20 cm的均质圆形水模体(以下简称CT水模体);单联铅屏风(天津金曦医疗设备有限公司),铅当量厚度为2 mm Pb,规格为1.2 m×2.0 m。
-
检测点位分布在角度为0°(EVISION-720型移动式CT正前方)、45°、90°、135°、180°、225°、270°和315°逆时针方向上,选取距地面0.3、0.8和1.3 m高度处的3个平面,以扫描中心为0点位置,分别在距离EVISION-720型移动式CT表面1~10 m处以等间隔1 m的方式布点。
-
在EVISION-720型移动式CT扫描孔径内放置CT水模体,在给定条件下曝光,使用辐射剂量仪的剂量率模式测量检测点位的周围剂量当量率,测量数据经校准后获得结果[10]。测量时,EVISION-720型移动式CT除管电压和管电流外,其他扫描条件均不变,扫描时间12 s/周,靶角16°,固有滤过1.8 mm Al,附加滤过2.5 mm Al+0.5 mm Cu,扫描1次旋转360°。分别在110 kV/20 mA、90 kV/40 mA、70 kV/60 mA的额定参数下,测量距离EVISION-720型移动式CT表面6 m处的检测点位(临床应用时设置的操作位)的周围剂量当量率。在110 kV/20 mA额定参数下,测量所有检测点位的周围剂量当量率。测量时,检测仪器探头垂直朝向设备。
-
采用OriginLab Origin 2021软件,在110 kV/20 mA额定参数下,以距地面0.3、0.8和1.3 m高度处的3个平面的测量结果,绘制1、5、10、20、40、100 μSv/h等剂量曲线,即辐射剂量场分布图。
-
检测仪器每年定期到中国计量科学研究院进行检定和校准,确保检测仪器在检定有效期限内,功能正常;检测数据严格按照中国计量科学研究院给定的校准系数进行数据修正,确保数据的准确性和客观性。
-
采用SPSS 23.0软件对数据进行统计学分析。计量资料符合正态分布,采用
$ \bar x \pm s $ 表示,对在不同额定参数下,距地面相同高度处的周围剂量当量率,以及在相同额定参数下,不同距地面高度处的周围剂量当量率分别进行配对分析,配对数据不符合正态分布,采用Wilcoxon秩和检验。P<0.05为差异有统计学意义。 -
3种额定参数及3种距地面高度处,距离EVISION-720型移动式CT表面6 m处的周围剂量当量率测量结果见表1,配对Wilcoxon秩和检验的结果见表2和表3。由表1~3可知,在110 kV/20 mA额定参数下,0°方向上即扫描中心孔上的周围剂量当量率最大,为(34.44±0.09) μSv/h;仅有270°方向上的检测位点在90 kV/40 mA额定参数下、距地面0.3 m高度处的周围剂量当量率略高于110 kV/20 mA额定参数下的测量结果,其余检测位点,在90 kV/40 mA和70 kV/60 mA额定参数下,距地面不同高度处的测量结果均低于110 kV/20 mA额定参数下的测量结果;周围剂量当量率基本上随3种额定参数中管电压的增大逐渐增大,而不随测量处距地面高度的变化而变化。在不同额定参数下,距地面相同高度处的周围剂量当量率的差异均有统计学意义(Z=−2.527~2.524,均P<0.05)。在相同额定参数下,距地面不同高度处的周围剂量当量率的差异均无统计学意义(Z=−1.690~−0.169,均P>0.05)。
额定参数 距地面高度(m) 检测点位角度 0° 45° 90° 135° 180° 225° 270° 315° 110 kV/20 mA 0.3 34.44±0.09 12.04±0.37 12.56±0.29 1.23±0.04 9.66±0.11 1.43±0.05 4.70±0.05 9.58±0.03 0.8 28.98±0.05 11.29±0.07 8.69±0.06 1.53±0.03 6.05±0.02 1.54±0.02 9.91±0.06 9.74±0.07 1.3 28.98±0.06 11.40±0.57 12.85±0.04 1.72±0.10 6.55±0.11 1.63±0.05 10.42±0.09 9.26±0.09 90 kV/40 mA 0.3 25.20±0.41 7.93±0.10 8.23±0.07 0.76±0.03 2.01±0.10 0.52±0.05 5.04±0.10 5.46±0.11 0.8 22.60±0.33 7.31±0.12 5.88±0.19 0.73±0.04 2.00±0.16 0.69±0.04 5.63±0.13 4.87±0.17 1.3 21.84±0.42 6.64±0.20 7.81±0.25 0.78±0.05 1.93±0.12 0.69±0.05 5.96±0.19 5.12±0.07 70 kV/60 mA 0.3 9.74±0.20 2.77±0.11 0.92±0.04 0.13±0.02 0.32±0.04 0.19±0.02 0.60±0.04 2.12±0.05 0.8 8.23±0.09 2.69±0.20 0.79±0.07 0.24±0.02 0.35±0.04 0.17±0.02 0.63±0.10 1.80±0.15 1.3 7.81±0.13 2.69±0.20 0.93±0.07 0.18±0.03 0.39±0.05 0.19±0.02 0.71±0.09 1.83±0.10 表 1 3种额定参数及3种距地面高度处距离EVISION-720型移动式头部锥形束CT表面6 m处的周围剂量当量率(
$ \bar x \pm s $ Table 1. Ambient dose equivalent rates at six meters from the surface of EVISION-720 mobile head cone-beam CT at the three heights from the floor and under three rated parameters (
$ \bar x \pm s $ 额定参数 距地面0.3 m 距地面0.8 m 距地面1.3 m Z值 P值 Z值 P值 Z值 P值 110 kV/20 mA −2.313a 0.021a −2.524a 0.012a 2.521a 0.012a 90 kV/40 mA −2.521b 0.012b −2.527b 0.012b 2.521b 0.012b 70 kV/60 mA −2.521c 0.012c −2.524c 0.012c 2.524c 0.012c 注:a表示与90 kV/40 mA额定参数比较;b表示与70 kV/60 mA额定参数比较;c表示与110 kV/20 mA额定参数比较 表 2 距地面相同高度处、不同额定参数下距离EVISION-720型移动式头部锥形束CT表面6 m处的周围剂量当量率 的比较
Table 2. Comparison of ambient dose equivalence rates at six meters from the surface of EVISION-720 mobile head cone-beam CT at the same height from the floor and under different rated parameters
距地面高度
(m)70 kV/60 mA 90 kV/40 mA 110 kV/20 mA Z值 P值 Z值 P值 Z值 P值 0.3 −1.192a 0.233a −1.472a 0.141a −0.700a 0.484a 0.8 −0.507b 0.612b −0.169b 0.866b −1.690b 0.091b 1.3 −0.507c 0.612c −1.120c 0.263c −0.420c 0.674c 注:a表示与距地面0.8 m比较;b表示与距地面1.3 m比较;c表示与距地面0.3 m比较 表 3 相同额定参数下、距地面不同高度处距离EVISION-720型移动式头部锥形束CT表面6 m处的周围剂量当量率 的比较
Table 3. Comparison of ambient dose equivalence rates at six meters from the surface of EVISION-720 mobile head cone-beam CT at different heights from the floor and under the same rated parameter
-
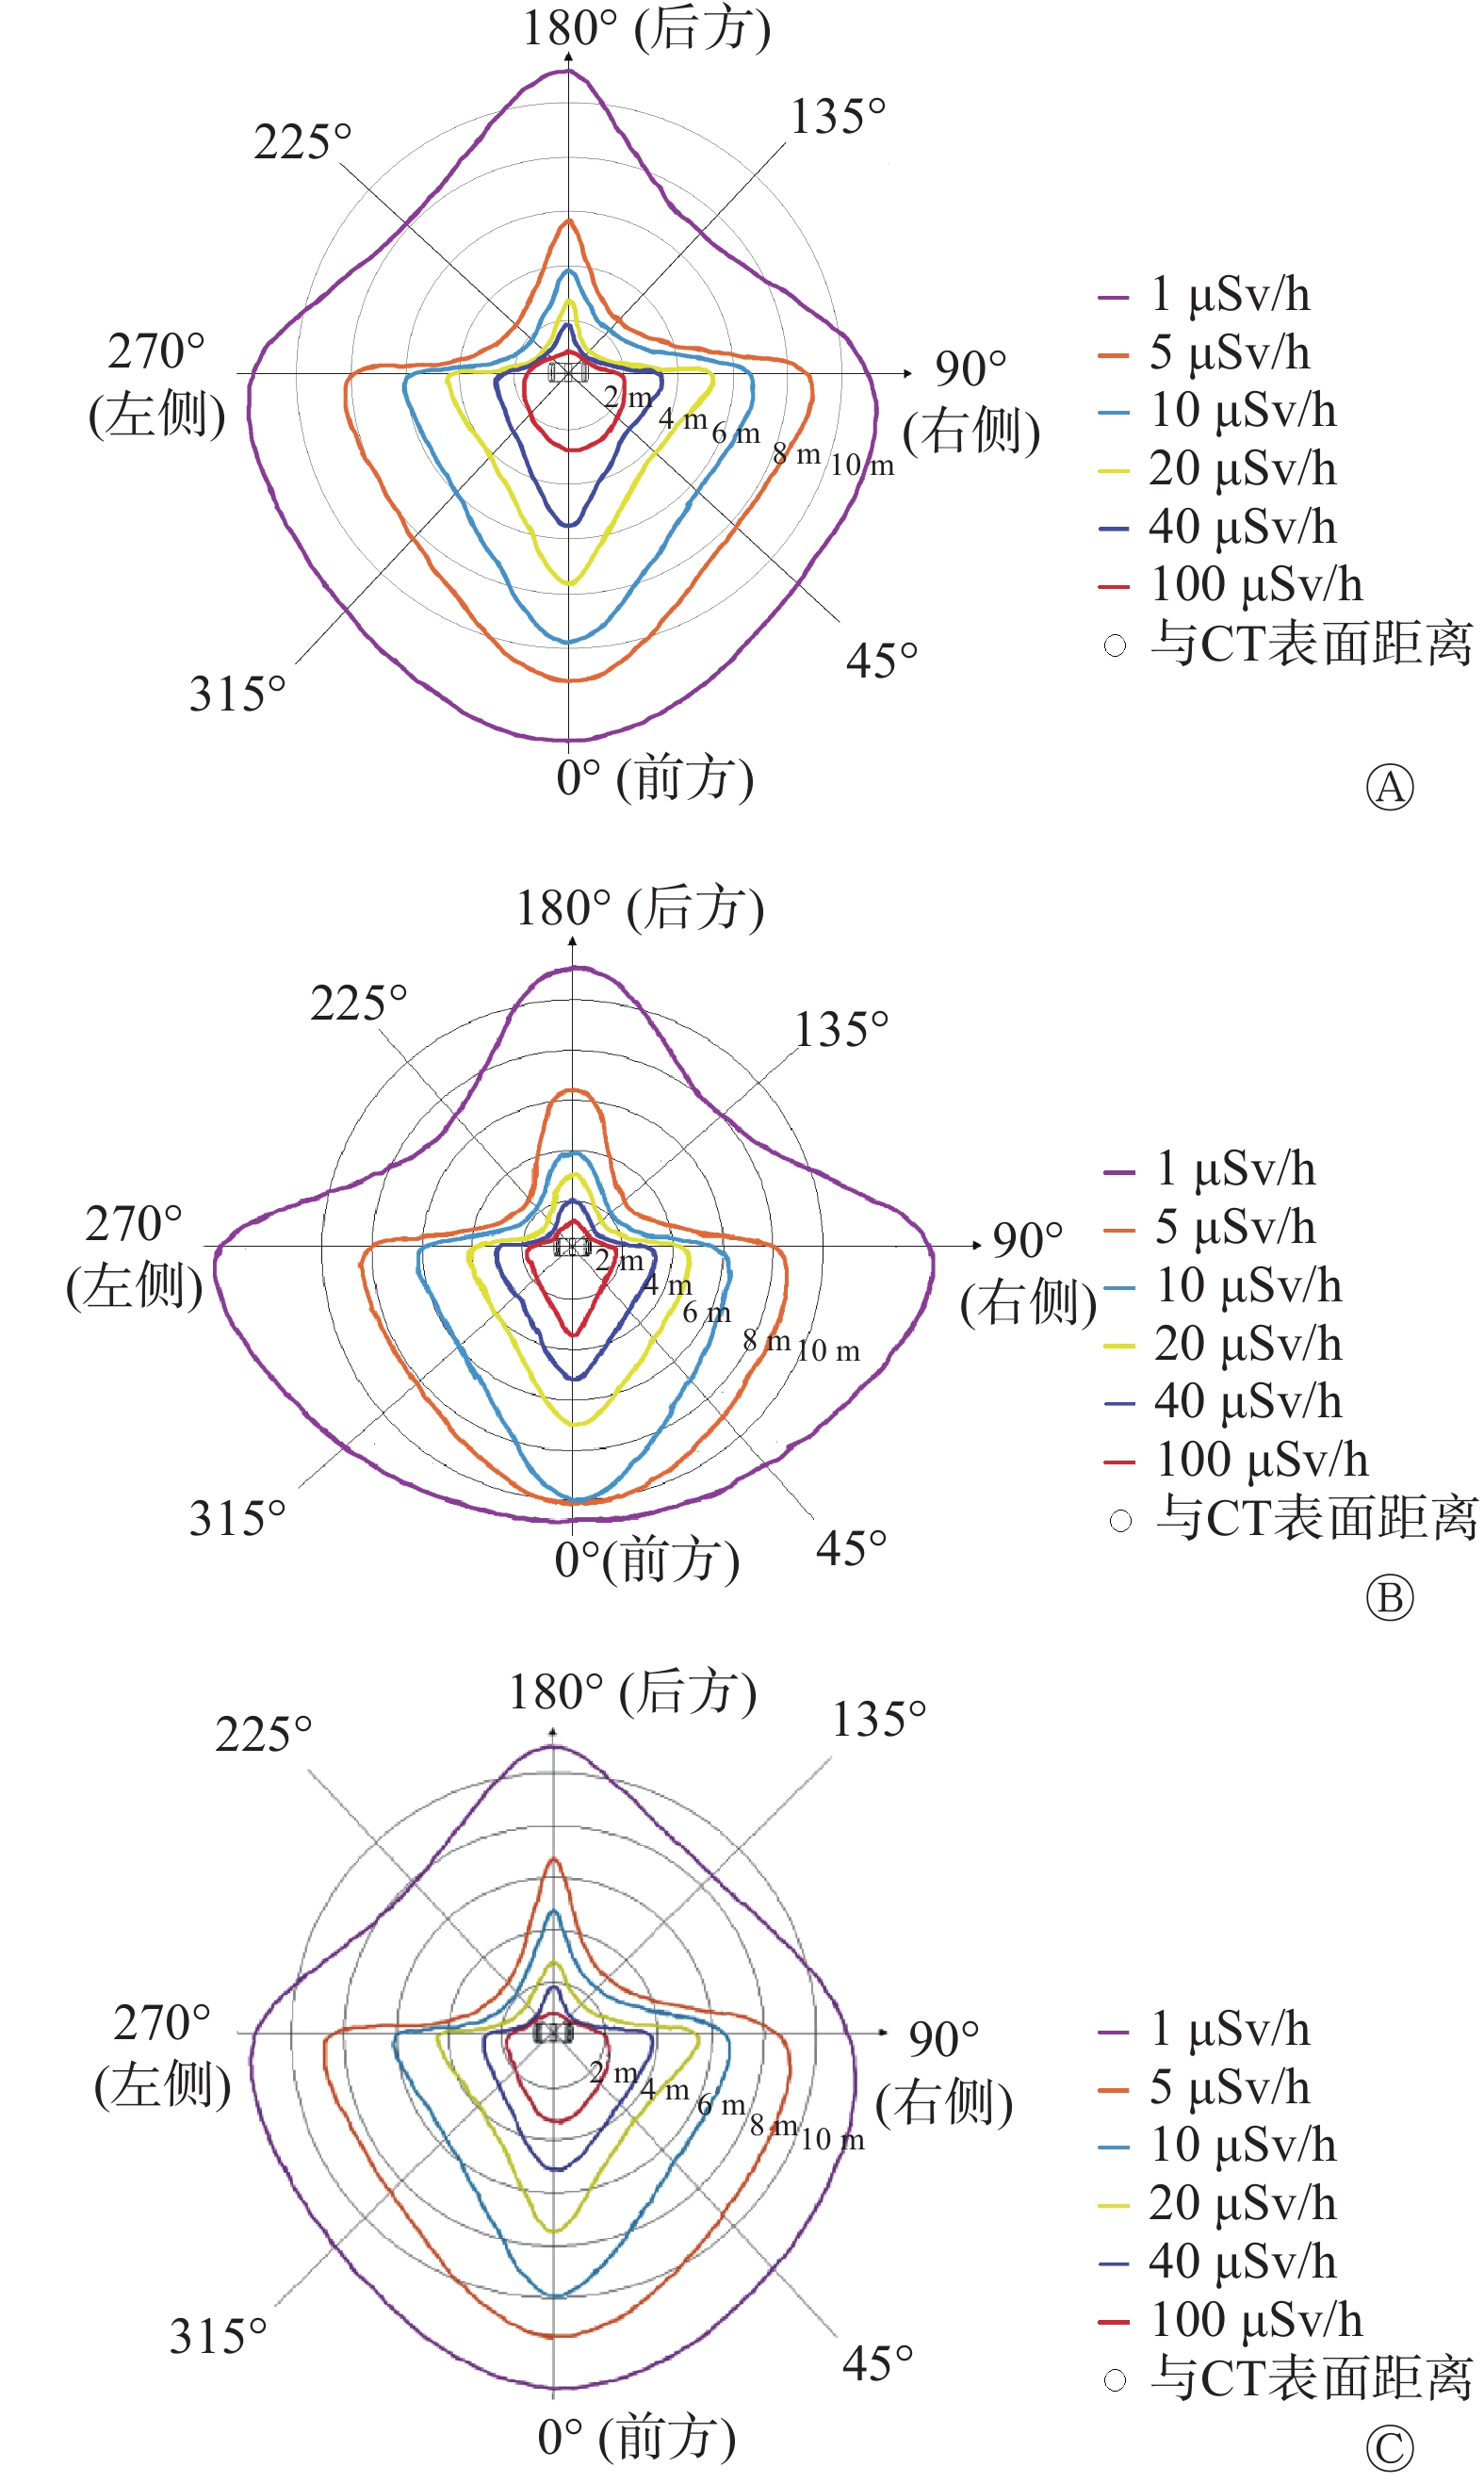
在110 kV/20 mA额定参数下,以距地面0.3、0.8和1.3 m高度处的3个平面的周围剂量当量率绘制的等剂量曲线(即辐射剂量场分布图)见图1,辐射剂量场呈“对称性”和“三角形”分布。由图1可见:(1)两侧的周围剂量当量率对称,如图中90°与270°方向所示;(2)前方的周围剂量当量率高于两侧和后方,如图中0°与180°方向所示;(3)后方的2个45°方向,即135°和225°方向上的周围剂量当量率最低;(4)正前方,即0°方向上的周围剂量当量率最高,如图中0°方向所示。

图 1 EVISION-720型移动式头部锥形束CT在110 kV/20 mA额定参数下,距地面不同高度的辐射剂量场分布图
Figure 1. Distribution maps of radiation dose field around EVISION-720 mobile head cone-beam CT under rated parameter of 110 kV/20 mA and at different heights from the floor
-
本研究结果显示,EVISION-720型移动式CT在110 kV/20 mA额定参数下的周围剂量当量率最高,约是90 kV/40 mA额定参数下的1.5~3倍,70 kV/60 mA额定参数下的3~10倍;在相同额定参数下,相同角度、距地面不同高度处的周围剂量当量率基本处于相同水平,与距地面高度无显著的相关性,这可能与设备曝光过程中其内部铅防护板和扫描孔铅防护帘等的泄漏辐射、模体散射有关。
本研究结果表明,对于EVISION-720型移动式CT,采用高千伏额定参数时的高剂量区域范围大于低千伏额定参数时,检测点位距地面高度对周围剂量当量率无明显影响,这为临床使用场所的辐射防护检测提供了重要的参考。对于EVISION-720型移动式CT工作场所的分区应参照高千伏额定参数下的周围剂量当量率水平进行划分更为合理,这有利于降低放射工作人员和公众的受照剂量并保护他们的健康。
常规CT扫描室内等剂量曲线分布近似“8字型”,扫描架两侧为低剂量区,扫描孔中心至两侧45°范围内为高剂量区,越靠近扫描架开口处的中心剂量越高[11]。移动式CT的辐射剂量场分布具有与常规CT的剂量场分布不同的特点,张金戈等[9]通过热释光探测器测量的CereTom移动式多排CT的辐射剂量场呈从前向后的“三角形”分布。本研究中EVISION-720型移动式CT辐射剂量场呈“对称性”和“三角形”分布,其中“三角形”分布的特点与张金戈等[9]的研究结果基本一致:两侧的周围剂量当量率对称,前方的周围剂量当量率高于两侧和后方;后方的2个45°方向,即135°和225°方向上的周围剂量当量率最低;正前方,即0°方向上的周围剂量当量率最高。这可能是由于曝光时扫描孔前侧的铅帘处于打开状态,而后侧铅帘封闭扫描孔后侧,进而导致扫描孔前侧的散射剂量远远大于后侧的散射剂量。因此,放射工作人员在使用移动式CT时,应避免在设备的前方进行操作,而应在设备的侧后方进行操作,从而避免受到高剂量率的照射。
本研究是在空旷的实验场所测得的辐射剂量场分布,避免了周围环境中墙面、屋顶等的散射和反射对测量结果的影响。移动式CT在狭窄或密闭空间等场所使用时,由于墙面、屋顶反射和散射的影响,可能会出现不同形状的辐射剂量场[9],后期还需针对病房、手术室、移动车辆等移动式CT实际应用的场所和环境进行辐射剂量场的测量。为了保护放射工作人员和公众的健康,移动式CT的辐射剂量场的分布应根据移动式CT的实际摆放位置进行检测,并根据其辐射剂量场分布特点明确移动式CT的辐射工作场所分区。
利益冲突 所有作者声明无利益冲突
作者贡献声明 高杰负责现场测量、数据的收集、论文的撰写;魏超负责研究思路的提供与设计、现场测量、数据的处理;翟贺争负责现场测量;武权负责数据的审核、论文的审阅;苏锴骏负责数据的审核;周鹏跃负责数据的收集与整理
EVISION-720型移动式头部锥形束CT辐射剂量场空间分布特点分析
Analysis of spatial distribution characteristics of radiation dose field around EVISION-720 mobile head cone-beam CT
-
摘要:
目的 探讨EVISION-720型移动式头部锥形束CT(简称EVISION-720型移动式CT)周围剂量当量率的检测方案并分析其辐射剂量场的空间分布特点。 方法 在0°(EVISION-720型移动式CT正前方)、45°、90°、135°、180°、225°、270°和315°逆时针分布的方向上,选取距地面0.3、0.8和1.3 m高度处的3个平面,以扫描中心为0点位置,分别在距离EVISION-720型移动式CT表面1~10 m处以等间隔1 m的方式布点。采用辐射剂量仪分别在110 kV/20 mA、90 kV/40 mA、70 kV/60 mA的额定参数下,测量距离EVISION-720型移动式CT表面6 m处的检测点位(临床应用时设置的操作位)的周围剂量当量率。在110 kV/20 mA额定参数下,测量所有检测点位的周围剂量当量率。在110 kV/20 mA额定参数下,以距地面0.3、0.8和1.3 m高度处的3个平面的测量结果,绘制1、5、10、20、40、100 μSv/h等剂量曲线,即辐射剂量场分布图。对在不同额定参数下,距地面相同高度处的周围剂量当量率,以及在相同额定参数下,距地面不同高度处的周围剂量当量率分别进行配对Wilcoxon秩和检验。 结果 在3种额定参数下,周围剂量当量率随管电压的增大逐渐增大,不随测量处距地面高度的变化而变化。3种额定参数中,110 kV/20 mA额定参数下0°方向上的周围剂量当量率最大,为(34.44±0.09) μSv/h。在不同额定参数下,距地面相同高度处的周围剂量当量率的差异均有统计学意义(Z=−2.527~2.524,均P<0.05)。在相同额定参数下,距地面不同高度处的周围剂量当量率的差异均无统计学意义(Z=−1.690~−0.169,均P>0.05)。EVISION-720型移动式CT辐射剂量场呈“对称性”和“三角形”分布:后方的2个45°方向,即135°和225°方向上的周围剂量当量率最低;正前方,即0°方向上的周围剂量当量率最高。 结论 EVISION-720型移动式CT辐射剂量场呈左右两侧“对称性”分布和前后“三角形”分布,前方的周围剂量当量率水平高于两侧和后方,医疗机构在使用时应加强对设备前方的辐射防护管理。 -
关键词:
- 辐射剂量 /
- 移动式CT /
- 辐射防护 /
- 体层摄影术,X线计算机
Abstract:Objective To explore the detection scheme of ambient dose equivalent rates around EVISION-720 mobile head cone-beam CT (EVISION-720 mobile CT) and analyze the spatial distribution characteristics of its radiation dose field. Methods Three planes at a height of 0.3, 0.8, and 1.3 m from the floor were selected in the counterclockwise direction of 0° (in front of EVISION-720 mobile CT), 45°, 90°, 135°, 180°, 225°, 270°, and 315°. Using the scanning center as the zero-point position, the detection sites were arranged at a distance of 1–10 m from the surface of EVISION-720 mobile CT at an interval of 1 m. A radiation dosimeter was used to measure the ambient dose equivalent rates from the detection sites (operation sites set at the time of clinical application) at 6 m from the surface of EVISION-720 mobile CT under rated parameters of 110 kV/20 mA, 90 kV/40 mA, and 70 kV/60 mA. In addition, ambient dose equivalent rates were measured at all detection sites under rated parameter of 110 kV/20 mA. Measurements of the three planes at a height of 0.3, 0.8, and 1.3 m from the floor under rated parameter of 110 kV/20 mA were plotted for 1, 5, 10, 20, 40, and 100 μSv/h isodose curves, that is, radiation dose field distribution map. The Wilcoxon test was used for comparison among ambient dose equivalent rates at the same heights from the floor under the different rated parameters, and ambient dose equivalent rates at different heights from the floor under the same rated parameters, respectively. Results Under the three rated parameters, the measurement results of ambient dose equivalent rate gradually increase with the increase of tube voltage, but they do not change with the change of height from the floor. Moreover, the ambient dose equivalent rate in the 0° direction under rated parameter of 110 kV/20 mA was the highest ((34.44±0.09) μSv/h). At the same height from the floor under different rated parameters, the differences in ambient dose equivalent rates were statistically significant (Z=−2.527 to 2.524, all P<0.05). Furthermore, the differences in ambient dose equivalent rates at different heights from the floor under the same rated parameter are not statistically significant (Z=−1.690 to −0.169, all P>0.05). Based on the radiation dose field of EVISION-720 mobile CT, the "symmetry" and "triangle" distribution are obtained: the ambient dose equivalent rate in the 135° and 225° direction was the lowest, and the ambient dose equivalent rate in the 0° direction was the highest. Conclusions The radiation dose field around EVISION-720 mobile CT presents a symmetry distribution on both sides and a triangle distribution in front and at back of the equipment. In addition, the ambient dose equivalent rate in the front is higher than that on both sides and at the back. Therefore, medical institutions should strengthen radiation protection management in front of the equipment. -
Key words:
- Radiation dosage /
- Mobile CT /
- Radiation protection /
- Tomography, X-ray computed
-
图 1 EVISION-720型移动式头部锥形束CT在110 kV/20 mA额定参数下,距地面不同高度的辐射剂量场分布图
Figure 1. Distribution maps of radiation dose field around EVISION-720 mobile head cone-beam CT under rated parameter of 110 kV/20 mA and at different heights from the floor
表 1 3种额定参数及3种距地面高度处距离EVISION-720型移动式头部锥形束CT表面6 m处的周围剂量当量率(
$ \bar x \pm s $ Table 1. Ambient dose equivalent rates at six meters from the surface of EVISION-720 mobile head cone-beam CT at the three heights from the floor and under three rated parameters (
$ \bar x \pm s $ 额定参数 距地面高度(m) 检测点位角度 0° 45° 90° 135° 180° 225° 270° 315° 110 kV/20 mA 0.3 34.44±0.09 12.04±0.37 12.56±0.29 1.23±0.04 9.66±0.11 1.43±0.05 4.70±0.05 9.58±0.03 0.8 28.98±0.05 11.29±0.07 8.69±0.06 1.53±0.03 6.05±0.02 1.54±0.02 9.91±0.06 9.74±0.07 1.3 28.98±0.06 11.40±0.57 12.85±0.04 1.72±0.10 6.55±0.11 1.63±0.05 10.42±0.09 9.26±0.09 90 kV/40 mA 0.3 25.20±0.41 7.93±0.10 8.23±0.07 0.76±0.03 2.01±0.10 0.52±0.05 5.04±0.10 5.46±0.11 0.8 22.60±0.33 7.31±0.12 5.88±0.19 0.73±0.04 2.00±0.16 0.69±0.04 5.63±0.13 4.87±0.17 1.3 21.84±0.42 6.64±0.20 7.81±0.25 0.78±0.05 1.93±0.12 0.69±0.05 5.96±0.19 5.12±0.07 70 kV/60 mA 0.3 9.74±0.20 2.77±0.11 0.92±0.04 0.13±0.02 0.32±0.04 0.19±0.02 0.60±0.04 2.12±0.05 0.8 8.23±0.09 2.69±0.20 0.79±0.07 0.24±0.02 0.35±0.04 0.17±0.02 0.63±0.10 1.80±0.15 1.3 7.81±0.13 2.69±0.20 0.93±0.07 0.18±0.03 0.39±0.05 0.19±0.02 0.71±0.09 1.83±0.10  下载: 导出CSV
表 2 距地面相同高度处、不同额定参数下距离EVISION-720型移动式头部锥形束CT表面6 m处的周围剂量当量率 的比较
Table 2. Comparison of ambient dose equivalence rates at six meters from the surface of EVISION-720 mobile head cone-beam CT at the same height from the floor and under different rated parameters
额定参数 距地面0.3 m 距地面0.8 m 距地面1.3 m Z值 P值 Z值 P值 Z值 P值 110 kV/20 mA −2.313a 0.021a −2.524a 0.012a 2.521a 0.012a 90 kV/40 mA −2.521b 0.012b −2.527b 0.012b 2.521b 0.012b 70 kV/60 mA −2.521c 0.012c −2.524c 0.012c 2.524c 0.012c 注:a表示与90 kV/40 mA额定参数比较;b表示与70 kV/60 mA额定参数比较;c表示与110 kV/20 mA额定参数比较
下载: 导出CSV
表 3 相同额定参数下、距地面不同高度处距离EVISION-720型移动式头部锥形束CT表面6 m处的周围剂量当量率 的比较
Table 3. Comparison of ambient dose equivalence rates at six meters from the surface of EVISION-720 mobile head cone-beam CT at different heights from the floor and under the same rated parameter
距地面高度
(m)70 kV/60 mA 90 kV/40 mA 110 kV/20 mA Z值 P值 Z值 P值 Z值 P值 0.3 −1.192a 0.233a −1.472a 0.141a −0.700a 0.484a 0.8 −0.507b 0.612b −0.169b 0.866b −1.690b 0.091b 1.3 −0.507c 0.612c −1.120c 0.263c −0.420c 0.674c 注:a表示与距地面0.8 m比较;b表示与距地面1.3 m比较;c表示与距地面0.3 m比较
下载: 导出CSV
-
[1] John S, Stock S, Cerejo R, et al. Brain imaging using mobile CT: current status and future prospects[J]. J Neuroimaging, 2016, 26(1): 5−15. DOI: 10.1111/jon.12319. [2] 郑全乐, 陈文锦, 李春虎, 等. 16排移动CT在ICU床旁与车载头部扫描结果对比分析[J]. 中华脑科疾病与康复杂志:电子版, 2020, 10(1): 21−24. DOI: 10.3877/cma.j.issn.2095-123X.2020.01.005.
Zheng QL, Chen WJ, Li CH, et al. Comparison and analysis of 16-row mobile CT scanning results in ICU bedside and on vehicle-mounted scanning[J]. Chin J Brain Dis Rehabil (Elect Ed), 2020, 10(1): 21−24. DOI: 10.3877/cma.j.issn.2095-123X.2020.01.005.[3] Keil H, Beisemann N, Schnetzke M, et al. First experiences with the Airo mobile intraoperative CT scanner in acetabular surgery—an analysis of 10 cases[J]. Int J Med Robot, 2019, 15(2): e1986. DOI: 10.1002/rcs.1986. [4] Dag N. Mobile computed tomography scanner in trailer: a field hospital experience[J]. Eur Rev Med Pharmacol Sci, 2022, 26(19): 6953−6957. DOI: 10.26355/eurrev_202210_29876. [5] 余松祚, 汤树洪, 覃重桥, 等. 移动 CT 血管成像对于创伤性脑血管损伤的临床应用价值分析[J]. 广东医学, 2020, 41(7): 718−721. DOI: 10.13820/j.cnki.gdyx.20192579.
Yu SZ, Tang SH, Qin ZQ, et al. The clinical application of mobile CTA for traumatic cerebrovascular injury[J]. Guangdong Med J, 2020, 41(7): 718−721. DOI: 10.13820/j.cnki.gdyx.20192579.[6] Parmar HA, Lim TCC, Goh JSK, et al. Providing optimal radiology service in the severe acute respiratory syndrome outbreak: use of mobile CT[J]. AJR Am J Roentgenol, 2004, 182(1): 57−60. DOI: 10.2214/ajr.182.1.1820057. [7] 刘伟, 张倩, 陈思运, 等. 移动CT相对于传统CT存在的优势[J]. 生物医学工程与临床, 2020, 24(3): 343−345. DOI: 10.13339/j.cnki.sglc.20200414.012.
Liu W, Zhang Q, Chen SY, et al. Advantages of mobile CT over traditional CT[J]. BME & Clin Med, 2020, 24(3): 343−345. DOI: 10.13339/j.cnki.sglc.20200414.012.[8] 郑全乐, 陈文锦, 吴国华, 等. 重症监护患者床旁移动CT与常规CT头部扫描结果对比分析[J]. 中华脑科疾病与康复杂志:电子版, 2021, 11(5): 300−304. DOI: 10.3877/cma.j.issn.2095-123X.2021.05.009.
Zheng QL, Chen WJ, Wu GH, et al. Comparative analysis of head scan results of bedside mobile CT and conventional CT in intensive care patients[J]. Chin J Brain Dis Rehabil (Elect Ed), 2021, 11(5): 300−304. DOI: 10.3877/cma.j.issn.2095-123X.2021.05.009.[9] 张金戈, 彭婉琳, 李真林, 等. 移动CT头部扫描辐射剂量场的空间分布[J]. 中华放射医学与防护杂志, 2017, 37(4): 302−305. DOI: 10.3760/cma.j.issn.0254-5098.2017.04.014.
Zhang JG, Peng WL, Li ZL, et al. Spatial distribution of radiation dose field from mobile CT head scanning[J]. Chin J Radiol Med Prot, 2017, 37(4): 302−305. DOI: 10.3760/cma.j.issn.0254-5098.2017.04.014.[10] 张震, 练德幸, 侯长松, 等. 辐射检测仪器时间响应修正方法验证与探讨[J]. 中华放射医学与防护杂志, 2018, 38(1): 48−51. DOI: 10.3760/cma.j.issn.0254-5098.2018.01.010.
Zhang Z, Lian DX, Hou CS, et al. Validation and discussion of the time response correction formula for radiation detectors[J]. Chin J Radiol Med Prot, 2018, 38(1): 48−51. DOI: 10.3760/cma.j.issn.0254-5098.2018.01.010.[11] Zutz H, Alikhani B. Dose measurements in the stray field of a GE Optima CT660[J]. Radiat Prot Dosimetry, 2016, 170(1−4): 261−264. DOI: 10.1093/rpd/ncv392. -

 点击查看大图
计量
- 文章访问数: 2193
- HTML全文浏览量: 1799
- PDF下载量: 22
