


-
肺癌是全球性公共卫生问题。2020年全球癌症统计数据显示,肺癌的发病率仅次于乳腺癌,居于第2位,然而其病死率居于第1位[1]。近年来,随着肺癌基因组学的不断发展,肺癌的治疗取得了实质性进展,但是对早期肺癌的筛查、管理、治疗等仍未达到共识[2]。早期肺腺癌以磨玻璃样密度为主,高分辨率CT(high resolution CT,HRCT)可对其进行薄层扫描及多平面重建,具有良好的灵敏度和特异度[3]。多种肺癌相关免疫组织化学(immunohistochemistry,IHC)检查指标的表达对评估肺癌的发生、发展及生物学行为有一定的价值,其临床组织病理学特征与肺腺癌的病理分期、分化程度、指导预后、辅助诊断和治疗等息息相关。目前未见同时检测多种IHC蛋白表达与肺磨玻璃结节(ground-glass nodule,GGN)影像特征相关性的报道,因此,本研究旨在探讨肺GGN的HRCT影像特征与IHC检查指标的相关性,为临床医师早期诊断肺GGN及评估其浸润性提供参考。
-
回顾性分析2019年1月至2020年5月于南方医科大学顺德医院(佛山市顺德区第一人民医院)经手术和组织病理学检查结果确诊的144例肺GGN患者的临床资料,其中男性46例、女性98例,年龄28~80(51.9±11.9)岁。所有患者均行手术及IHC检查,根据2021年世界卫生组织肺肿瘤组织新分类方法[4],将144例肺GGN患者分为3组:浸润前病变(pre-invasive lesion,PI)组35例、微浸润性腺癌(microinvasive adenocarcinoma,MIA)组46例和浸润性腺癌(invasive adenocarcinoma,IA)组63例。纳入标准:(1)具有完整的影像资料、组织病理学检查资料及临床资料;(2)肺GGN手术切除前已做胸部HRCT检查;(3)组织病理学检查结果诊断为肺GGN;(4)无其他恶性肿瘤病史。排除标准:(1)CT图像存在严重伪影;(2)术前接受过肺GGN的肿瘤相关治疗(如靶向治疗、放化疗等)。本研究获得南方医科大学顺德医院(佛山市顺德区第一人民医院)伦理委员会的批准(批准号:KYLS20220710),且所有患者均已签署知情同意书。
-
使用德国西门子公司Somatom Definition AS 128层螺旋CT机。扫描上下范围由肺尖到膈面,左右范围包括两侧腋窝及胸壁。扫描参数:视野300 mm×300 mm、管电流200 mA、管电压120 kV、螺距1.2、准直宽64×0.625 mm、扫描时间5~7 s、重建层厚0.6 mm、矩阵512×512。由2位高年资胸部放射科诊断主任医师使用盲法阅片,意见不一致时与第3位高年资胸部放射科诊断主任医师协商达成一致。GGN的长径和平均密度精确到小数点后2位数,每个样本测量3次并取其平均值。GGN的7种CT形态特征记录为“有”或“无”,若结果难以判断,则记录为“无”。选择分叶征、毛刺征、胸膜牵拉征、瘤-肺边界、微血管穿行征、空泡征和空气支气管征7种CT特征进行统计学分析。
-
所有IHC切片均从病理科获得。在扫描仪(型号:Pannoramic MIDI,厂家:匈牙利3D HISTECH)的镜头下移动IHC切片。将IHC切片上所有的染色点用Pannoramic viewer软件打开,以1~400倍任意倍数放大后进行观察,并截取图片。用Quant center分析软件自动识别相应细胞,并设置IHC切片上所有的深棕色为强阳性、棕黄色为中度阳性、浅黄色为弱阳性、蓝色为阴性,进而使用Image J 1.8.0软件对每个染色点进行识别并分析IHC检查指标[细胞增殖核抗原Ki-67(简称Ki-67)、p53、血管内皮生长因子(vascular endothelial growth factor,VEGF)、p40、甲状腺转录因子1(thyriod transcription factor-1,TTF-1)、细胞角蛋白7(cytokeratin 7,CK7)、表皮生长因子受体(epidermal growth factor receptor,EGFR)、CK5/6、新天冬氨酸蛋白酶A(noval asparticproteinase of pepsin family A,Napsin A)、癌胚抗原(carcinoembryonic antigen,CEA)]的相对表达水平(单位:像素)。
-
应用SPSS 22.0软件对数据进行统计学分析并绘制ROC曲线。正态分布的计量资料以
$ \bar x \pm s$ 表示,计数资料以例(百分比)表示,组间比较采用方差分析或χ2检验。采用单因素及多因素Logistic回归模型分析影响因素并建立预测模型:模型Ⅰ(MIA组,参考组为PI组);模型Ⅱ(IA组,参考组为PI组);模型Ⅲ(MIA组,参考组为IA组),并绘制ROC曲线,获得最佳诊断临界值,分析该模型的诊断效能。采用χ2检验分析HRCT影像特征与IHC检查指标表达水平的相关性。P<0.05为差异有统计学意义。 -
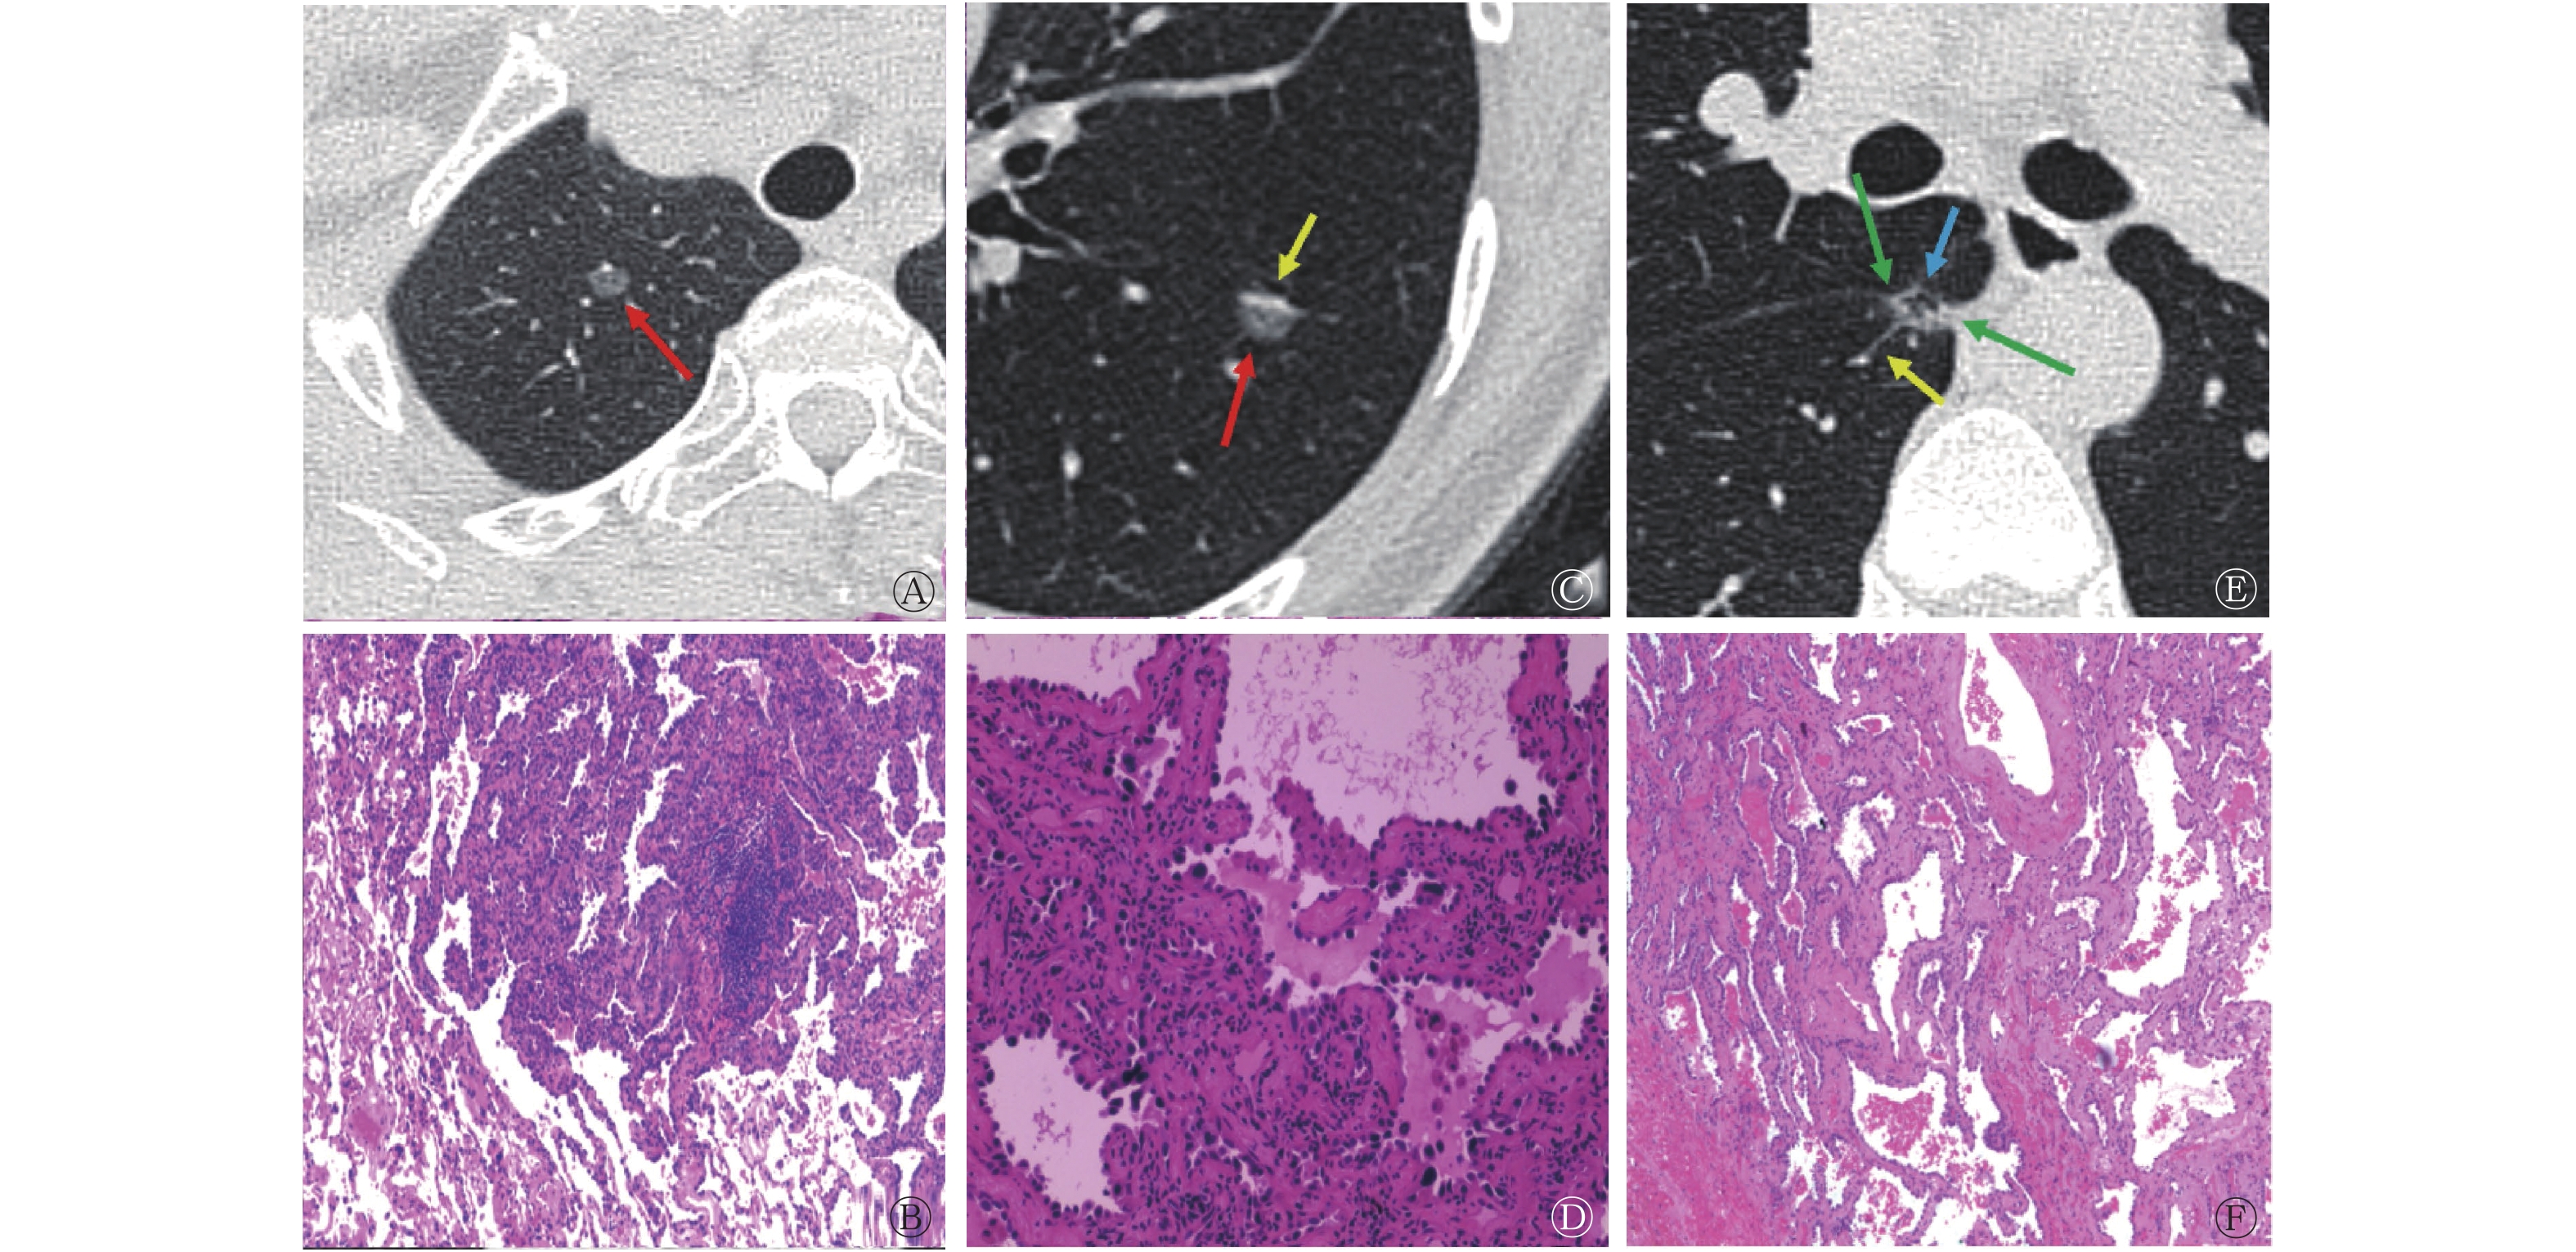
图1分别列举了3组中3例肺GGN患者的HRCT影像特征和组织病理学检查图。组间单因素Logistic回归分析结果显示,除了空泡征(F=5.758,P=0.218),其余影像特征(GGN长径、分叶征、毛刺征、胸膜牵拉征、瘤-肺边界、微血管穿行征、空气支气管征)在3组间的差异均有统计学意义(F=8.952~82.901,均P<0.05)(表1)。
组别 GGN长径
(mm)分叶征(例,%) 毛刺征(例,%) 胸膜牵拉征(例,%) 瘤-肺边界(例,%) 微血管穿行征(例,%) 空泡征(例,%) 空气支气管征(例,%) 无 有 无 有 无 有 无 有 无 有 无 有 无 有 PI组(n=35) 5.03±1.52 34(97.1) 1(2.9) 32(91.4) 3(8.6) 35(100) 0 29(82.9) 6(17.1) 9(25.7) 26(74.3) 30(85.7) 5(14.3) 35(100) 0 MIA组(n=46) 7.80±2.01 40(86.9) 6(13.1) 42(91.3) 4(8.7) 27(58.7) 19(41.3) 24(52.1) 22(47.9) 8(17.4) 38(82.6) 31(67.4) 15(32.6) 39(84.8) 7(15.2) IA组(n=63) 11.76±3.10 22(34.9) 41(65.1) 20(31.7) 43(68.3) 20(31.7) 43(68.3) 11(17.5) 52(82.5) 3(4.8) 60(95.2) 44(69.8) 19(30.2) 47(74.6) 16(25.4) F值 82.901 51.722 55.560 42.837 40.607 8.952 5.758 10.842 P值 <0.001 <0.001 <0.001 <0.001 <0.001 0.011 0.218 0.004 注:GGN为磨玻璃结节;PI为浸润前病变;MIA为微浸润性腺癌;IA为浸润性腺癌 表 1 3组肺GGN患者的单因素Logistic回归分析结果
Table 1. Results of univariate Logistics regression analysis among three groups of patients with pulmonary ground-glass nodules

图 1 3例肺GGN患者(女性,55岁、42岁;男性,39岁)的高分辨率CT横断面图(A、C、E)及组织病理学检查图(B、D、F)(苏木精-伊红染色,×400)
Figure 1. High resolution CT transverse images (A, C, E) and histopathological examination images (B, D, F) of 3 patients (female, 55 years old, 42 years old; male, 39 years old) with pulmonary ground-glass nodules
3组肺GGN患者多因素Logistic回归分析结果显示,模型的-2对数拟然值为130.685,拟合自由度为18(χ2=177.47,P<0.05),所建模型有效且只有GGN长径可作为评估3组肺GGN浸润性的独立危险因素(B=0.628、0.894、−0.265,均P<0.05)(表2)。模型Ⅰ、模型Ⅱ、模型Ⅲ ROC曲线的AUC分别为0.870、0.860、0.976,灵敏度分别为85.7%、84.8%、85.7%,特异度分别为73.9%、79.4%、98.4%,最佳诊断临界值分别为6.5、10.0、6.5。当GGN长径<6 mm时,倾向于PI;当6 mm≤GGN长径≤10 mm时,倾向于MIA;当GGN长径>10 mm时,倾向于IA(图2)。
变量类别 变量设定 模型Ⅰ 模型Ⅱ 模型Ⅲ B值 OR值 P值 B值 OR值 P值 B值 OR值 P值 GGN长径 0.628 1.874 0.003 0.894 2.444 <0.001 −0.265 0.767 0.020 分叶征 无 −0.947 0.388 0.473 −2.850 0.058 0.047 1.903 6.708 0.009 有 0 1 − 0 1 − 0 − − 毛刺征 无 1.499 4.476 0.191 −1.335 0.263 0.259 2.834 17.016 <0.001 有 0 1 − 0 1 − 0 − − 胸膜牵拉征 无 −18.994 5.635×10⁻⁸ 0.994 −18.961 5.826×10⁻⁹ 0.994 −0.033 0.967 0.961 有 0 1 − 0 1 − 0 − − 瘤-肺边界 无 −0.893 0.410 0.225 −2.720 0.066 0.004 1.827 6.216 0.011 有 0 1 − 0 1 − 0 − − 微血管穿刺征 无 −0.243 0.784 0.784 −1.516 0.220 0.255 1.273 3.571 0.233 有 0 1 − 0 1 − 0 − − 空气支气管征 无 −16.080 1.039×10⁻⁷ <0.001 −15.835 1.327×10⁻⁷ <0.001 −0.244 0.783 0.805 有 0 1 − 0 1 − 0 − − 注:GGN为磨玻璃结节;OR为优势比;模型Ⅰ为微浸润性腺癌,参考组为浸润前病变;模型Ⅱ为浸润性腺癌,参考组为浸润前病变;模型Ⅲ为微浸润性腺癌,参考组为浸润性腺癌;−表示无此项数据 表 2 3组肺GGN患者的多因素Logistic回归分析结果
Table 2. Results of multivariate Logistic regression analysis in three groups of patients with pulmonary ground-glass nodules

图 2 Logistic回归模型评估GGN长径对3组肺GGN患者的诊断效能受试者工作特征曲线
Figure 2. Evaluation of diagnostic efficacy of ground-glass nodules diameter in three groups of pulmonary ground-glass nodules patients by Logistic regression model receiver operator characteristic curves
-
以肺GGN浸润的程度为状态变量,IHC检查指标为检验变量进行ROC分析(图3),结果显示,Ki-67、p53和VEGF对肺GGN浸润程度具有较高的预测价值,其AUC分别为0.760、0.773和0.829,灵敏度分别为69.8%、66.7%和76.2%,特异度分别为76.5%、81.5和75.3%,其他IHC检查指标对应的AUC均<0.700。因此,Ki-67、p53和VEGF对IA有着较高的诊断价值,其最佳诊断临界值分别为3.9、3.8和3.9。

图 3 免疫组织化学检查指标评估肺GGN浸润程度的受试者工作特征曲线
Figure 3. Receiver operator characteristic curves of immunohistochemical examination indexes for evaluating the invasion degree of pulmonary ground-glass nodules
以最佳诊断临界值区分VEGF、p53及Ki-67表达水平的高低,并分析HRCT影像特征与VEGF、p53及Ki-67表达水平的相关性,由表3可知,GGN长径>10 mm、分叶征、毛刺征、胸膜牵拉征、瘤-肺边界与VEGF、p53、Ki-67的高表达水平具有相关性(χ2=13.582~41.351,均P<0.05);微血管穿行征与Ki-67的高表达水平具有相关性,而与VEGF、p53的低表达水平具有相关性(χ2=15.111、15.644、16.121,均P<0.05);空泡征、空气支气管阳性与Ki-67、p53及VEGF的表达水平均无相关性(χ2=4.825~24.651,均P>0.05)。
指标 表达水平 GGN长径 分叶征 毛刺征 胸膜牵拉征 瘤-肺边界 微血管穿行征 空泡征 空气支气管征 ≤10 mm >10 mm 有 无 有 无 有 无 有 无 有 无 有 无 有 无 VEGF 低表达(n=86) 55 31 18 68 19 67 25 61 37 49 66 20 17 20 9 77 高表达(n=58) 17 41 30 28 31 27 37 21 43 15 58 0 22 0 14 44 χ2值 16.629 14.781 15.025 17.034 13.582 15.644 5.787 4.825 P值 <0.001 <0.001 <0.001 <0.001 <0.001 <0.001 0.065 0.272 p53 低表达(n=85) 61 24 11 74 12 73 18 67 30 55 65 20 10 75 6 79 高表达(n=59) 11 48 37 22 38 21 44 15 50 9 59 0 29 30 17 42 χ2值 39.309 38.821 38.858 40.505 34.493 16.121 24.651 12.281 P值 <0.001 <0.001 <0.001 <0.001 <0.001 <0.001 0.102 0.150 Ki-67 低表达(n=79) 56 23 12 67 12 67 15 64 28 51 60 19 11 68 6 73 高表达(n=65) 16 49 36 29 38 27 47 18 52 13 64 1 28 37 17 48 χ2值 30.539 25.926 29.459 41.351 28.672 15.111 15.347 9.152 P值 <0.001 <0.001 <0.001 <0.001 <0.001 <0.001 0.081 0.170 注:CT为计算机体层摄影术;VEGF为血管内皮生长因子;p53为抑癌基因53;Ki-67为细胞增殖核抗原;GGN为磨玻璃结节 表 3 高分辨率CT影像特征与VEGF、p53和Ki-67表达水平的相关性(例)
Table 3. Correlation between high resolution CT images features and expression level of vascular endothelial growth factor, p53 and Ki-67 (case)
-
近年来,随着HRCT的广泛应用,肺GGN的检出率明显提高[5-6]。随着病程的进展,肺GGN可表现出一些以组织病理学和分子生物学为基础的影像特征。IHC检查指标的表达水平对肺癌的诊断、分类和治疗具有重要的作用,通过探讨HRCT影像特征与IHC检查指标表达水平的相关性,可为肺GGN的临床诊断、治疗及预后提供有价值的方案。
既往多项研究结果显示,可根据GGN长径、分叶征、毛刺征、胸膜牵拉征、空泡征、空气支气管征等形态学特征区分GGN的良恶性[7-9]。本研究结果显示,GGN长径、分叶征、毛刺征、胸膜牵拉征、瘤-肺边界、微血管穿行征及空气支气管征的组间差异有统计学意义,这与上述研究结果一致,然而空泡征组间差异无统计学意义。空泡征的组织病理学基础是未被肿瘤侵犯的含气肺组织、未封闭的细支气管或沿肺泡壁生长的肿瘤细胞、未封闭的肺泡腔,而本研究的研究对象为早期肺腺癌GGN,其主要形态为附壁生长未封闭管腔。因此,空泡征的组间差异在本研究中无统计学意义。
随着肿瘤细胞的浸润性不断增强,其增殖能力相应提高,并向不同方向生长,GGN也逐渐出现分叶征、毛刺征、胸膜牵拉征等形态学特征,肿瘤细胞需要的氧气、营养物质相应增多,促使微血管形成。本研究多因素Logistic回归分析结果显示,分叶征、毛刺征、胸膜牵拉征、瘤-肺边界、微血管穿行征及空气支气管征不是评估3组肺GGN浸润性的独立危险因素。有研究者也提出,毛刺征、分叶征和胸膜牵拉征不足以作为预测肺GGN良恶性的独立危险因素[10-12]。肺GGN中微血管穿行征的发生率与其长径和胸膜距离有关,与浸润性无显著关联,因此微血管穿行征不能作为预测肺GGN浸润性的独立危险因素[6],这与本研究结果一致。在肺癌的TNM分期中,T分期根据肿瘤长径进行评估,肺GGN长径一直被认为是评估肺癌浸润程度的重要参考因子[13],本研究结果显示,GGN长径是评估3组肺GGN患者的独立危险因素,这与上述研究结果一致。有研究结果显示,GGN长径为10 mm是评估肺腺癌良恶性的最佳临界值[13-14]。本研究结果显示,当GGN长径<6 mm时,倾向于PI;当6 mm≤GGN长径≤10 mm时,倾向于MIA;当GGN长径>10 mm时,倾向于IA。因此本研究结果对评估肺GGN的浸润性具有更好的诊断价值,更有利于临床对肺GGN的管理、诊断及治疗。
Ki-67是一种重要的肿瘤细胞增殖生物标志物,在细胞增殖周期(G1、S、G2期和M期)中过表达,但在G0期细胞中几乎不表达[15],并与肿瘤细胞的增殖、侵袭、转移和预后有关[16],随着GGN浸润程度的增加,Ki-67的表达水平也相应升高[17]。p53为抑癌基因,通过激活大量的效应通路来抑制肿瘤的发生,其发生基因突变后转化为癌基因,随着GGN浸润程度的增加,p53的表达水平也相应升高[18]。肿瘤的生长和转移需要充足的氧气和营养物质,其血管生成依赖于肿瘤细胞间的相互作用等高度复杂的机制[19]。VEGF是促血管生成的最关键驱动因子,其与肺GGN的侵袭性相关,随着肺GGN浸润程度的增加,VEGF的表达水平相应升高[20-21]。有研究结果表明,不同浸润程度的肺GGN影像特征与VEGF表达水平具有相关性[21-22]。我们进一步分析肺GGN的HRCT影像特征与VEGF、p53及Ki-67表达水平的相关性,结果显示,GGN长径>10 mm、分叶征、毛刺征、胸膜牵拉征和瘤-肺边界与VEGF、p53和Ki-67的高表达水平具有相关性,这表明随着肿瘤体积逐渐增大,肿瘤细胞微血管生成速度较快,细胞增殖能力较强,需要大量营养物质促使肿瘤周围组织血管内皮细胞增殖,进而对周围肺组织也产生间质性改变;微血管穿行征与Ki-67的高表达和VEGF、p53的低表达水平具有相关性,这可能由于本研究的研究对象为肺GGN,其存在惰性生物学行为,虽然肿瘤细胞在增殖,但是其增殖能力及浸润程度比较弱。空泡征、空气支气管征与Ki-67、p53和VEGF的表达水平无相关性,这可能与早期肺腺癌组织主要为附壁生长有关。也有文献报道,空泡征、空气支气管征在PI和IA中的差异无统计学意义[23]。综上,肺GGN长径>10 mm、分叶征、毛刺征、胸膜牵拉征、瘤-肺边界与VEGF、p53和Ki-67高表达具有相关性;微血管穿行征与Ki-67高表达具有相关性,而与VEGF及p53低表达具有相关性;空泡征、空气支气管征与VEGF、p53和Ki-67的表达无相关性。
本研究的局限性:(1)病例数较少,需要扩大样本量进行前瞻性队列分析;(2)影像医师和病理医师的评估具有差异性;(3)未对纳入患者的性别和年龄等相关指标进行分层分析。
综上所述,肺GGN长径是评估其浸润程度的独立危险因素,具有较好的诊断效能。HRCT影像特征与Ki-67、VEGF和p53的表达水平具有相关性,二者综合分析可以有效评估肺GGN的病理分型、肿瘤细胞的增殖活性及浸润程度,为临床管理肺GGN、选择合适的治疗方案提供参考。
利益冲突 所有作者声明无利益冲突
作者贡献声明 张榕负责资料的收集、研究方法的设计、图像的分析、数据的统计与分析、论文的撰写;毛莉莉负责研究方法的设计、数据的统计与分析;杨少民负责图像的分析、数据的统计分析、论文的审阅与修改;刘子蔚、周翠铷负责图像的分析、文献的搜集、论文的修改;胡秋根负责论文的修改与最终版本的修订
肺磨玻璃结节高分辨率CT影像特征及其与血管内皮生长因子、Ki-67、p53的相关性研究
High resolution CT imaging features of pulmonary ground-glass nodules and their correlation with vascular endothelial growth factor, Ki-67, p53
-
摘要:
目的 探讨肺磨玻璃结节(GGN)高分辨率CT(HRCT)影像特征及其与免疫组织化学(IHC)检查指标的相关性,评估其对临床的应用价值。 方法 回顾性分析2019年1月至2020年5月于南方医科大学顺德医院(佛山市顺德区第一人民医院)经手术和组织病理学检查结果确诊的144例肺GGN患者的临床资料,其中男性46例、女性98例,年龄28~80(51.9±11.9)岁。所有患者均行手术及IHC检查,根据2021年世界卫生组织肺肿瘤组织新分类方法,将144例肺GGN患者分为浸润前病变(PI)、微浸润性腺癌(MIA)和浸润性腺癌(IA)3组,比较3组肺GGN患者HRCT影像特征的差异及其与IHC检查指标的相关性。影像特征的组间比较采用方差分析或χ2检验。采用单因素及多因素Logistic回归模型分析影响因素及建立预测模型,并绘制受试者工作特征曲线,获得最佳诊断临界值。采用χ2检验分析HRCT影像特征与IHC检查指标表达水平的相关性。 结果 单因素Logistic回归分析结果显示,GGN长径、分叶征、毛刺征、胸膜牵拉征、瘤-肺边界、微血管穿行征、空气支气管征在3组间的差异均有统计学意义(F=8.952~82.901,均P<0.05)。多因素Logistic回归分析结果显示,GGN长径是评估肺GGN浸润性的独立危险因素。当GGN长径<6 mm时倾向于PI;当6 mm≤GGN长径≤10 mm时倾向于MIA;当GGN长径>10 mm时倾向于IA。IHC检查结果显示,血管内皮生长因子(VEGF)、p53、细胞增殖核抗原(Ki-67)对肺GGN浸润程度的预测价值较高,曲线下面积分别为0.829、0.773、0.760。相关性分析结果显示,GGN长径>10 mm、分叶征、毛刺征、胸膜牵拉征、瘤-肺边界与VEGF、p53、Ki-67的高表达水平具有相关性(χ2=13.582~41.351,均P<0.05);微血管穿行征与Ki-67的高表达和VEGF、p53的低表达水平具有相关性(χ2=15.111、15.644、16.121,均P<0.05)。 结论 GGN长径是评估肺GGN浸润性的独立危险因素,具有较好的诊断效能。肺GGN的HRCT影像特征与Ki-67、p53和VEGF表达水平具有相关性,将肺GGN的HRCT影像特征和IHC检查指标综合分析可以有效评估组织病理学分型、肿瘤细胞的增殖活性及浸润程度,为临床对肺GGN患者的管理及选择合适的治疗方案提供有价值的参考。 -
关键词:
- 肺腺癌 /
- 磨玻璃结节 /
- 体层摄影术,X线计算机 /
- 免疫组织化学
Abstract:Objective To investigate the high resolution CT (HRCT) imaging features of pulmonary ground-glass nodules (GGN) and their correlation with immunohistochemical (IHC) examination indexes and evaluate their clinical value. Methods The clinical data of 144 patients with pulmonary GGN diagnosed by surgery and histopathological examination in Shunde Hospital of Southern Medical University (the First People's Hospital of Shunde) from January 2019 to May 2020 were retrospectively analyzed, including 46 males and 98 females, aged 28–80 (51.9±11.9) years old. All patients underwent surgery and IHC. Based on the new classification of lung tumor tissue by the World Health Organization in 2021, 144 patients with pulmonary GGN were divided into three groups: pre-invasive lesion (PI), microinvasive adenocarcinoma (MIA), and invasive adenocarcinoma (IA). The differences in HRCT imaging features of the three groups of pulmonary GGN patients and their correlation with IHC examination indexes were compared. The image features were compared between groups by analysis of variance or χ2 test. Univariate and multivariate Logistic regression models were used to analyze the influencing factors and establish a prediction model. In addition, the receiver operator characteristic curves were drawn to obtain the best diagnostic cut-off value. χ2 test was used to analyze the correlation between HRCT image features and the expression level of IHC examination indexes. Results Results of univariate Logistic regression analysis showed that the GGN diameter, lobulation, spiculation, pleural traction sign, tumor-lung boundary, microvascular perforation sign and air bronchial sign were significantly different among the three groups (F=8.952–82.901, all P<0.05). Meanwhile, the results of multivariate Logistic regression analysis showed that the GGN diameter was an independent risk factor for the evaluation of pulmonary GGN infiltration. It tended to PI when the GGN diameter was <6 mm, MIA when the GGN diameter was 6 mm≤GGN diameter≤10 mm, and IA when the GGN diameter was >10 mm. Results of IHC showed that vascular endothelial growth factor (VEGF), p53, and proliferating cell nuclear antigen (Ki-67) had high predictive values in predicting the degree of pulmonary GGN infiltration, with area under curves of 0.829, 0.773, and 0.760, respectively. Moreover, results of correlation analysis showed that patients with GGN diameter of >10 mm, lobulation, spiculation, and pleural traction sign as well as tumor-lung boundary were correlated with the expression of VEGF, p53, Ki-67 (χ2=13.582–41.351, all P<0.05). Microvascular perforation sign was correlated with the high expression level of Ki-67, and the low expression level of VEGF and p53 (χ2=15.111, 15.644, 16.121; all P<0.05). Conclusions GGN diameter was an independent risk factor for the evaluation of pulmonary GGN infiltration and has good diagnostic efficacy. The HRCT imaging features of the pulmonary GGN were correlated with the expression levels of Ki-67, p53, and VEGF. The comprehensive analysis of HRCT imaging features and IHC examination indexes of pulmonary GGN can evaluate the histopathological classification, proliferative activity, and infiltration of tumor cells, as well as provide valuable references for clinical management and selection of appropriate treatment for patients with pulmonary GGN. -
图 1 3例肺GGN患者(女性,55岁、42岁;男性,39岁)的高分辨率CT横断面图(A、C、E)及组织病理学检查图(B、D、F)(苏木精-伊红染色,×400)
Figure 1. High resolution CT transverse images (A, C, E) and histopathological examination images (B, D, F) of 3 patients (female, 55 years old, 42 years old; male, 39 years old) with pulmonary ground-glass nodules
图 2 Logistic回归模型评估GGN长径对3组肺GGN患者的诊断效能受试者工作特征曲线
Figure 2. Evaluation of diagnostic efficacy of ground-glass nodules diameter in three groups of pulmonary ground-glass nodules patients by Logistic regression model receiver operator characteristic curves
图 3 免疫组织化学检查指标评估肺GGN浸润程度的受试者工作特征曲线
Figure 3. Receiver operator characteristic curves of immunohistochemical examination indexes for evaluating the invasion degree of pulmonary ground-glass nodules
表 1 3组肺GGN患者的单因素Logistic回归分析结果
Table 1. Results of univariate Logistics regression analysis among three groups of patients with pulmonary ground-glass nodules
组别 GGN长径
(mm)分叶征(例,%) 毛刺征(例,%) 胸膜牵拉征(例,%) 瘤-肺边界(例,%) 微血管穿行征(例,%) 空泡征(例,%) 空气支气管征(例,%) 无 有 无 有 无 有 无 有 无 有 无 有 无 有 PI组(n=35) 5.03±1.52 34(97.1) 1(2.9) 32(91.4) 3(8.6) 35(100) 0 29(82.9) 6(17.1) 9(25.7) 26(74.3) 30(85.7) 5(14.3) 35(100) 0 MIA组(n=46) 7.80±2.01 40(86.9) 6(13.1) 42(91.3) 4(8.7) 27(58.7) 19(41.3) 24(52.1) 22(47.9) 8(17.4) 38(82.6) 31(67.4) 15(32.6) 39(84.8) 7(15.2) IA组(n=63) 11.76±3.10 22(34.9) 41(65.1) 20(31.7) 43(68.3) 20(31.7) 43(68.3) 11(17.5) 52(82.5) 3(4.8) 60(95.2) 44(69.8) 19(30.2) 47(74.6) 16(25.4) F值 82.901 51.722 55.560 42.837 40.607 8.952 5.758 10.842 P值 <0.001 <0.001 <0.001 <0.001 <0.001 0.011 0.218 0.004 注:GGN为磨玻璃结节;PI为浸润前病变;MIA为微浸润性腺癌;IA为浸润性腺癌  下载: 导出CSV
表 2 3组肺GGN患者的多因素Logistic回归分析结果
Table 2. Results of multivariate Logistic regression analysis in three groups of patients with pulmonary ground-glass nodules
变量类别 变量设定 模型Ⅰ 模型Ⅱ 模型Ⅲ B值 OR值 P值 B值 OR值 P值 B值 OR值 P值 GGN长径 0.628 1.874 0.003 0.894 2.444 <0.001 −0.265 0.767 0.020 分叶征 无 −0.947 0.388 0.473 −2.850 0.058 0.047 1.903 6.708 0.009 有 0 1 − 0 1 − 0 − − 毛刺征 无 1.499 4.476 0.191 −1.335 0.263 0.259 2.834 17.016 <0.001 有 0 1 − 0 1 − 0 − − 胸膜牵拉征 无 −18.994 5.635×10⁻⁸ 0.994 −18.961 5.826×10⁻⁹ 0.994 −0.033 0.967 0.961 有 0 1 − 0 1 − 0 − − 瘤-肺边界 无 −0.893 0.410 0.225 −2.720 0.066 0.004 1.827 6.216 0.011 有 0 1 − 0 1 − 0 − − 微血管穿刺征 无 −0.243 0.784 0.784 −1.516 0.220 0.255 1.273 3.571 0.233 有 0 1 − 0 1 − 0 − − 空气支气管征 无 −16.080 1.039×10⁻⁷ <0.001 −15.835 1.327×10⁻⁷ <0.001 −0.244 0.783 0.805 有 0 1 − 0 1 − 0 − − 注:GGN为磨玻璃结节;OR为优势比;模型Ⅰ为微浸润性腺癌,参考组为浸润前病变;模型Ⅱ为浸润性腺癌,参考组为浸润前病变;模型Ⅲ为微浸润性腺癌,参考组为浸润性腺癌;−表示无此项数据
下载: 导出CSV
表 3 高分辨率CT影像特征与VEGF、p53和Ki-67表达水平的相关性(例)
Table 3. Correlation between high resolution CT images features and expression level of vascular endothelial growth factor, p53 and Ki-67 (case)
指标 表达水平 GGN长径 分叶征 毛刺征 胸膜牵拉征 瘤-肺边界 微血管穿行征 空泡征 空气支气管征 ≤10 mm >10 mm 有 无 有 无 有 无 有 无 有 无 有 无 有 无 VEGF 低表达(n=86) 55 31 18 68 19 67 25 61 37 49 66 20 17 20 9 77 高表达(n=58) 17 41 30 28 31 27 37 21 43 15 58 0 22 0 14 44 χ2值 16.629 14.781 15.025 17.034 13.582 15.644 5.787 4.825 P值 <0.001 <0.001 <0.001 <0.001 <0.001 <0.001 0.065 0.272 p53 低表达(n=85) 61 24 11 74 12 73 18 67 30 55 65 20 10 75 6 79 高表达(n=59) 11 48 37 22 38 21 44 15 50 9 59 0 29 30 17 42 χ2值 39.309 38.821 38.858 40.505 34.493 16.121 24.651 12.281 P值 <0.001 <0.001 <0.001 <0.001 <0.001 <0.001 0.102 0.150 Ki-67 低表达(n=79) 56 23 12 67 12 67 15 64 28 51 60 19 11 68 6 73 高表达(n=65) 16 49 36 29 38 27 47 18 52 13 64 1 28 37 17 48 χ2值 30.539 25.926 29.459 41.351 28.672 15.111 15.347 9.152 P值 <0.001 <0.001 <0.001 <0.001 <0.001 <0.001 0.081 0.170 注:CT为计算机体层摄影术;VEGF为血管内皮生长因子;p53为抑癌基因53;Ki-67为细胞增殖核抗原;GGN为磨玻璃结节
下载: 导出CSV
-
[1] Sung H, Ferlay J, Siegel RL, et al. Global cancer statistics 2020: GLOBOCAN estimates of incidence and mortality worldwide for 36 cancers in 185 countries[J]. CA Cancer J Clin, 2021, 71(3): 209−249. DOI: 10.3322/caac.21660. [2] Duruisseaux M, Esteller M. Lung cancer epigenetics: from knowledge to applications[J]. Semin Cancer Biol, 2018, 51: 116−128. DOI: 10.1016/j.semcancer.2017.09.005. [3] Zhang PH, Lee YI, Zhang JL. A review of high-resolution X-ray computed tomography applied to petroleum geology and a case study[J]. Micron, 2019, 124: 102702. DOI: 10.1016/j.micron.2019.102702. [4] 李媛, 谢惠康, 武春燕. WHO胸部肿瘤分类(第5版)中肺肿瘤部分解读[J]. 中国癌症杂志, 2021, 31(7): 574−580. DOI: 10.19401/j.cnki.1007-3639.2021.07.003.
Li Y, Xie HK, Wu CY. Interpretation of lung tumours in the WHO classification of thoracic tumours (5th edition)[J]. China Oncol, 2021, 31(7): 574−580. DOI: 10.19401/j.cnki.1007-3639.2021.07.003.[5] Tsutani Y, Miyata Y, Nakayama H, et al. Appropriate sublobar resection choice for ground glass opacity-dominant clinical stage IA lung adenocarcinoma: wedge resection or segmentectomy[J]. Chest, 2014, 145(1): 66−71. DOI: 10.1378/chest.13-1094. [6] 姜雯雯, 房娜, 靳飞, 等. 18F-FDG PET/CT对浸润性肺腺癌磨玻璃结节危险程度的诊断价值[J]. 国际放射医学核医学杂志, 2021, 45(12): 750−758. DOI: 10.3760/cma.j.cn121381-202010010-00124.
Jiang WW, Fang N, Jin F, et al. Value of 18F-FDG PET/CT in the diagnosis of risk level of pulmonary invasive adenocarcinoma appearing as ground-glass nodules[J]. Int J Radiat Med Nucl Med, 2021, 45(12): 750−758. DOI: 10.3760/cma.j.cn121381-202010010-00124.[7] Fu BJ, Lv FJ, Li WJ, et al. Significance of intra-nodular vessel sign in differentiating benign and malignant pulmonary ground-glass nodules[J/OL]. Insights Imaging, 2021, 12(1): 65[2021-10-10]. https://insightsimaging.springeropen.com/articles/10.1186/s13244-021-01012-7. DOI: 10.1186/s13244-021-01012-7. [8] Chen ML, Li XT, Wei YY, et al. Can spectral computed tomography imaging improve the differentiation between malignant and benign pulmonary lesions manifesting as solitary pure ground glass, mixed ground glass, and solid nodules?[J]. Thorac Cancer, 2019, 10(2): 234−242. DOI: 10.1111/1759-7714.12937. [9] Qin YZ, Xu Y, Ma DJ, et al. Clinical characteristics of resected solitary ground-glass opacities: comparison between benign and malignant nodules[J]. Thorac Cancer, 2020, 11(10): 2767−2774. DOI: 10.1111/1759-7714.13575. [10] 李镭, 刘丹, 朱盈盈, 等. 肺磨玻璃结节临床研究进展[J]. 中国肺癌杂志, 2016, 19(2): 102−107. DOI: 10.3779/j.issn.1009-3419.2016.02.08.
Li L, Liu D, Zhu YY, et al. Overview of clinical progress in pulmonary ground-glass nodules[J]. Chin J Lung Cancer, 2016, 19(2): 102−107. DOI: 10.3779/j.issn.1009-3419.2016.02.08.[11] Meng Y, Liu CL, Cai Q, et al. Contrast analysis of the relationship between the HRCT sign and new pathologic classification in small ground glass nodule-like lung adenocarcinoma[J]. Radiol Med, 2019, 124(1): 8−13. DOI: 10.1007/s11547-018-0936-x. [12] Li WJ, Lv FJ, Tan YW, et al. Pulmonary benign ground-glass nodules: CT features and pathological findings[J/OL]. Int J Gen Med, 2021, 14: 581−590[2021-10-10]. https://www.dovepress.com/pulmonary-benign-ground-glass-nodules-ct-features-and-pathological-fin-peer-reviewed-fulltext-article-IJGM. DOI: 10.2147/IJGM.S298517. [13] Hu HY, Wang QG, Tang HM, et al. Multi-slice computed tomography characteristics of solitary pulmonary ground-glass nodules: differences between malignant and benign[J]. Thorac Cancer, 2016, 7(1): 80−87. DOI: 10.1111/1759-7714.12280. [14] 陈相猛, 段晓蓓, 龙晚生, 等. 高分辨CT影像学特征对非实性肺结节微浸润性腺癌与浸润性腺癌的鉴别诊断[J]. 国际放射医学核医学杂志, 2020, 44(5): 309−316. DOI: 10.3760/cma.j.cn121381-201909041-00038.
Chen XM, Duan XB, Long WS, et al. High resolution CT features of pulmonary non-solid nodules for distinguishing minimally invasive adenocarcinoma from invasive adenocarcinoma[J]. Int J Radiat Med Nucl Med, 2020, 44(5): 309−316. DOI: 10.3760/cma.j.cn121381-201909041-00038.[15] Xie S, Liu Y, Qiao X, et al. What is the prognostic significance of Ki-67 positivity in oral squamous cell carcinoma?[J/OL]. J Cancer, 2016, 7(7): 758−767[2021-10-10]. https://www.jcancer.org/v07p0758.htm. DOI: 10.7150/jca.14214. [16] Klapper W, Hoster E, Determann O, et al. Ki-67 as a prognostic marker in mantle cell lymphoma-consensus guidelines of the pathology panel of the European MCL network[J]. J Hematop, 2009, 2(2): 103−111. DOI: 10.1007/s12308-009-0036-x. [17] Xiong LF, Lou YM, Wang L. Expressions of Kif2c and Ki-67 in non-small cell lung cancer and their relationship with invasion and metastasis[J]. J Biol Regul Homeost Agents, 2020, 34(2): 541−546. DOI: 10.23812/19-513-L-8. [18] Duffy MJ, Synnott NC, Crown J. Mutant p53 as a target for cancer treatment[J]. Eur J Cancer, 2017, 83: 258−265. DOI: 10.1016/j.ejca.2017.06.023. [19] Haibe Y, Kreidieh M, El Hajj H, et al. Resistance mechanisms to anti-angiogenic therapies in cancer[J/OL]. Front Oncol, 2020, 10: 221[2021-10-10]. https://www.frontiersin.org/articles/10.3389/fonc.2020.00221/full. DOI: 10.3389/fonc.2020.00221. [20] Moon Y, Park JK, Lee KY, et al. Predictive factors for invasive adenocarcinoma in patients with clinical non-invasive or minimally invasive lung cancer[J]. J Thorac Dis, 2018, 10(11): 6010−6019. DOI: 10.21037/jtd.2018.10.83. [21] Barratt SL, Flower VA, Pauling JD, et al. VEGF (vascular endothelial growth factor) and fibrotic lung disease[J/OL]. Int J Mol Sci, 2018, 19(5): 1269[2021-10-10]. https://www.mdpi.com/1422-0067/19/5/1269. DOI: 10.3390/ijms19051269. [22] Abolfathi H, Sheikhpour M, Shahraeini SS, et al. Studies in lung cancer cytokine proteomics: a review[J]. Expert Rev Proteomics, 2021, 18(1): 49−64. DOI: 10.1080/14789450.2021.1892491. [23] 李西, 肖湘生, 于红, 等. >5 mm肺部纯磨玻璃结节的MDCT表现与病理对照研究[J]. 实用放射学杂志, 2016, 32(7): 1023−1027. DOI: 10.3969/j.issn.1002-1671.2016.07.008.
Li X, Xiao XS, Yu H, et al. MDCT features of pure ground-glass nodule more than 5 mm: a compared study with pathology[J]. J Pract Radiol, 2016, 32(7): 1023−1027. DOI: 10.3969/j.issn.1002-1671.2016.07.008. -

 点击查看大图
计量
- 文章访问数: 3078
- HTML全文浏览量: 2115
- PDF下载量: 16
