


-
肺腺癌具有高度异质性,包括4种类型,分别为浸润前病变、微浸润性肺腺癌、浸润性肺腺癌和浸润性肺腺癌变异亚型。其中,浸润性肺腺癌按生长模式的不同可分为5种亚型,分别为贴壁为主型腺癌(lepidic predominant adenocarcinoma, LPA)、腺泡为主型腺癌(acinar predominant adenocarcinoma, APA)、乳头为主型腺癌(papillary predominant adenocarcinoma, PPA)、实体为主型腺癌(solid predominant adenocarcinoma, SPA)和微乳头为主型腺癌(micropapillary predominant adenocarcinoma, MPA),这些组织学亚型与患者预后密切相关,其中SPA、MPA的恶性程度比LPA、APA、PPA更高,肺腺癌组织学分型出现SPA、MPA则趋向预后更差[1-3]。多层螺旋CT(multislice spiral CT, MSCT)因在呈现肺结节细节上的独特优势,已被广泛应用于各类肺结节的诊断。18F-FDG PET/CT在肿瘤的诊断与鉴别诊断中具有常规影像学检查无法替代的优势。肿瘤是机体在各种致瘤因子的作用下,局部组织细胞增生所形成的新生物,且其异常增殖需要摄取大量葡萄糖,因此相比正常组织,肿瘤对显像剂的摄取更高。在MSCT上表现为磨玻璃结节(ground-glass nodule,GGN)的浸润性肺腺癌,因其检出率逐年上升、鉴别诊断存在一定难度而受到越来越多的重视。本研究将18F-FDG PET/CT的2种检查手段(PET和MSCT)充分结合起来,从18F-FDG PET代谢参数、MSCT征象特点及二者联合上探讨对浸润性肺腺癌GGN的危险程度的诊断价值,并将影像资料与组织学亚型进行对照,以期及时发现含有SPA和(或)MPA的浸润性肺腺癌高危病灶,为临床治疗决策提供更准确的信息。
-
回顾性分析2015年6月至2019年6月于青岛市中心医院经组织病理学检查或随访结果证实为浸润性肺腺癌的143例患者的临床资料,其中男性54例、女性89例,年龄30~79(60.2±8.9)岁。纳入标准:均行18F-FDG PET/CT全身显像后经手术切除肺孤立性GGN;MSCT上表现为肺内孤立性GGN且8 mm≤径线≤30 mm,GGN包括单纯磨玻璃结节(pure ground-glass nodule, pGGN)和混合磨玻璃结节(mixed ground-glass nodule, mGGN);经手术后组织病理学检查结果证实为浸润性肺腺癌,组织学分型按腺癌生长模式分为LPA、APA、PPA、SPA、MPA,各亚型所占百分比达到5%即可在诊断结果中进行描述[1-4]。排除标准:多发肺结节;肺转移瘤;肺腺癌变异亚型。分组标准:含有LPA和(或)APA和(或)PPA病灶的患者归入低危组,含有SPA和(或)MPA病灶的患者归入高危组。所有患者或其家属均于检查前签署了知情同意书。本研究符合《赫尔辛基宣言》的原则。
-
所有患者均行18F-FDG PET/CT全身显像(其中,50例行18F-FDG PET/CT双时相显像),显像仪器为德国西门子公司Biograph 16型PET/CT,显像剂18F-FDG由美国CTI公司RDS111回旋加速器及FDG4合成模块生产,pH值为6.0~7.0,放射化学纯度>95%。受检者禁食4~6 h,注射前测量身高、体重及检测血糖,血糖浓度控制在<11.1 mmol/L。18F-FDG注射剂量按体重3.70~5.55 MBq/kg计算,患者于安静、避光环境中平卧60 min后,先行胸部MSCT扫描,再行全身PET/CT显像;延迟显像为注射后2 h,再次以病灶为中心行1个床位的显像。MSCT扫描条件:管电压120 kV,管电流50 mA,病灶层面重建层厚1 mm,骨性重建,肺窗显示,肺窗窗宽1200 HU,窗位−700 HU。
-
由2位中级职称以上的PET/CT诊断医师分别阅片,意见不同时经协商讨论获得一致。人工观察排除PET显像浓聚灶与病灶CT边界严重偏离的病例,在病灶放射性摄取最浓聚的位置勾画ROI,根据患者体重、注射剂量和时间、ROI放射性计数计算SUVmax和平均标准化摄取值(mean standardized uptake value,SUVmean)。SUVmean为基于PET/CT融合图像上肺窗的病灶CT边界勾画ROI,肺本底测量为在与病灶对称的对侧正常肺组织勾画面积相同的ROI。
分别测量或记录以下内容。(1)病灶位置:左肺上叶、下叶,右肺上叶、中叶和下叶;(2)径线:横断面最大层面长径和垂直短径的平均值[5-6];(3)密度:需避开血管等组织,以及空腔、钙化等,测量3次并计算CT均值;(4)SUVmax、SUVmean:SUV=病灶比活度/(静脉注入活度/体重);(5)双时相显像滞留指数(retention index, RI):RI=(延迟显像SUVmax −常规显像SUVmax)/ 常规显像SUVmax×100%;(6)肿瘤与对侧正常肺本底SUVmax的比值(T/N);(7)基于SUVmax的肿瘤与对侧正常肺本底的比值变化率(ΔT/Nmax):ΔT/Nmax=(延迟显像T/N−常规显像T/N)/常规显像T/N;(8)MSCT征象:分叶征、毛刺征、空泡征、支气管气相、胸膜尾征、血管集束征。
-
应用SPSS 19.0软件和MedCalc 19.0软件进行统计学分析。符合正态分布的计量资料以
$\bar x $ ±s表示,组间的比较采用独立样本t检验(方差齐);计数资料组间的比较采用χ2检验;对组间差异有统计学意义的因素进行多因素非条件Logistic回归分析。对鉴别诊断浸润性肺腺癌GGN低危组和高危组差异有统计学意义的因素进行ROC曲线分析,确定最佳临界值,计算诊断的灵敏度、特异度和准确率;比较不同因素及其联合诊断鉴别浸润性肺腺癌GGN危险程度的效能。P<0.05为差异有统计学意义。 -
由表1可知,在143例患者中,高危组26例、低危组117例。高危组男性15例(57.7%)、女性11例(42.3%);低危组男性39例(33.3%)、女性78例(66.7%),2组患者性别的差异无统计学意义(P>0.05)。另外,2组患者年龄、病灶位置的差异亦均无统计学意义(均P>0.05)。
参数 高危组(n=26) 低危组(n=117) 检验值 P值 性别(男/女,例) 15/11 39/78 χ2=3.071 0.084 年龄( $\bar x $ 

60.81±7.78 60.13±9.20 t=0.814 0.420 病灶位置(例) χ2=3.713 0.449 左肺上叶 5 26 左肺下叶 8 17 右肺上叶 9 44 右肺中叶 0 5 右肺下叶 4 25 病灶径线( $ \bar x $ 

17.61±4.48 14.33±4.18 t=−3.242 0.002 病灶密度( $ \bar x $ 

−308.37±221.37 −352.45±187.79 t=−0.944 0.353 SUVmax( $\bar x $ 

2.00±1.25 1.32±1.07 t=−2.568 0.012 SUVmean( $\bar x $ 

1.66±1.11 1.07±0.85 t=−2.392 0.023 T/N( $\bar x $ 

3.37±1.80 2.56±2.59 t=−1.391 0.168 MSCT征象[例(%)] 分叶征 24(92.3) 89(76.1) χ2=4.773 0.030 毛刺征 7 (26.9) 13(11.1) χ2=1.878 0.171 空泡征 9 (34.6) 43(36.8) χ2=0.000 0.993 支气管气相 9 (34.6) 46(39.3) χ2=0.112 0.744 胸膜尾征 18(69.2) 46(39.3) χ2=6.766 0.010 血管集束征 25(96.2) 92(78.6) χ2=3.542 0.063 注:病灶经线为横断面最大层面长径和垂直短径的平均值;SUVmax为最大标准化摄取值;SUVmean为平均标准化摄取值;T/N为肿瘤与对侧正常肺本底SUVmax的比值;MSCT为多层螺旋计算机体层摄影术 表 1 浸润性肺腺癌磨玻璃结节低危组与高危组患者的临床资料和影像学特征的比较
Table 1. Analysis of the clinical data and imaging features of the low-risk and high-risk groups with pulmonary invasive adenocarcinoma appearing as ground-glass nodules
-
143例浸润性肺腺癌患者病灶径线为8.20~26.74(15.10±4.46) mm。117例低危组患者中,40例(34.2%)表现为pGGN、77例(65.8%)表现为mGGN;26例高危组患者均表现为mGGN。由表1可知,高危组的病灶径线、SUVmax、SUVmean均高于低危组,且差异均有统计学意义(均P<0.05);2组在病灶密度、T/N间的差异均无统计学意义(均P>0.05)。高危组的病灶出现分叶征、胸膜尾征的比例高于低危组,且差异均有统计学意义(均P<0.05);2组在毛刺征、空泡征、支气管气相、血管集束征之间的差异均无统计学意义(均P>0.05)。典型病例的18F-FDG PET/CT显像图见图1、2。

图 1 右肺浸润性肺腺癌GGN患者(男性,64岁)的18F-FDG PET/CT显像图
Figure 1. 18F-FDG PET/CT images of a patient (male, 64 years old) with pulmonary invasive adenocarcinoma appearing as ground-glass nodules of the right lung
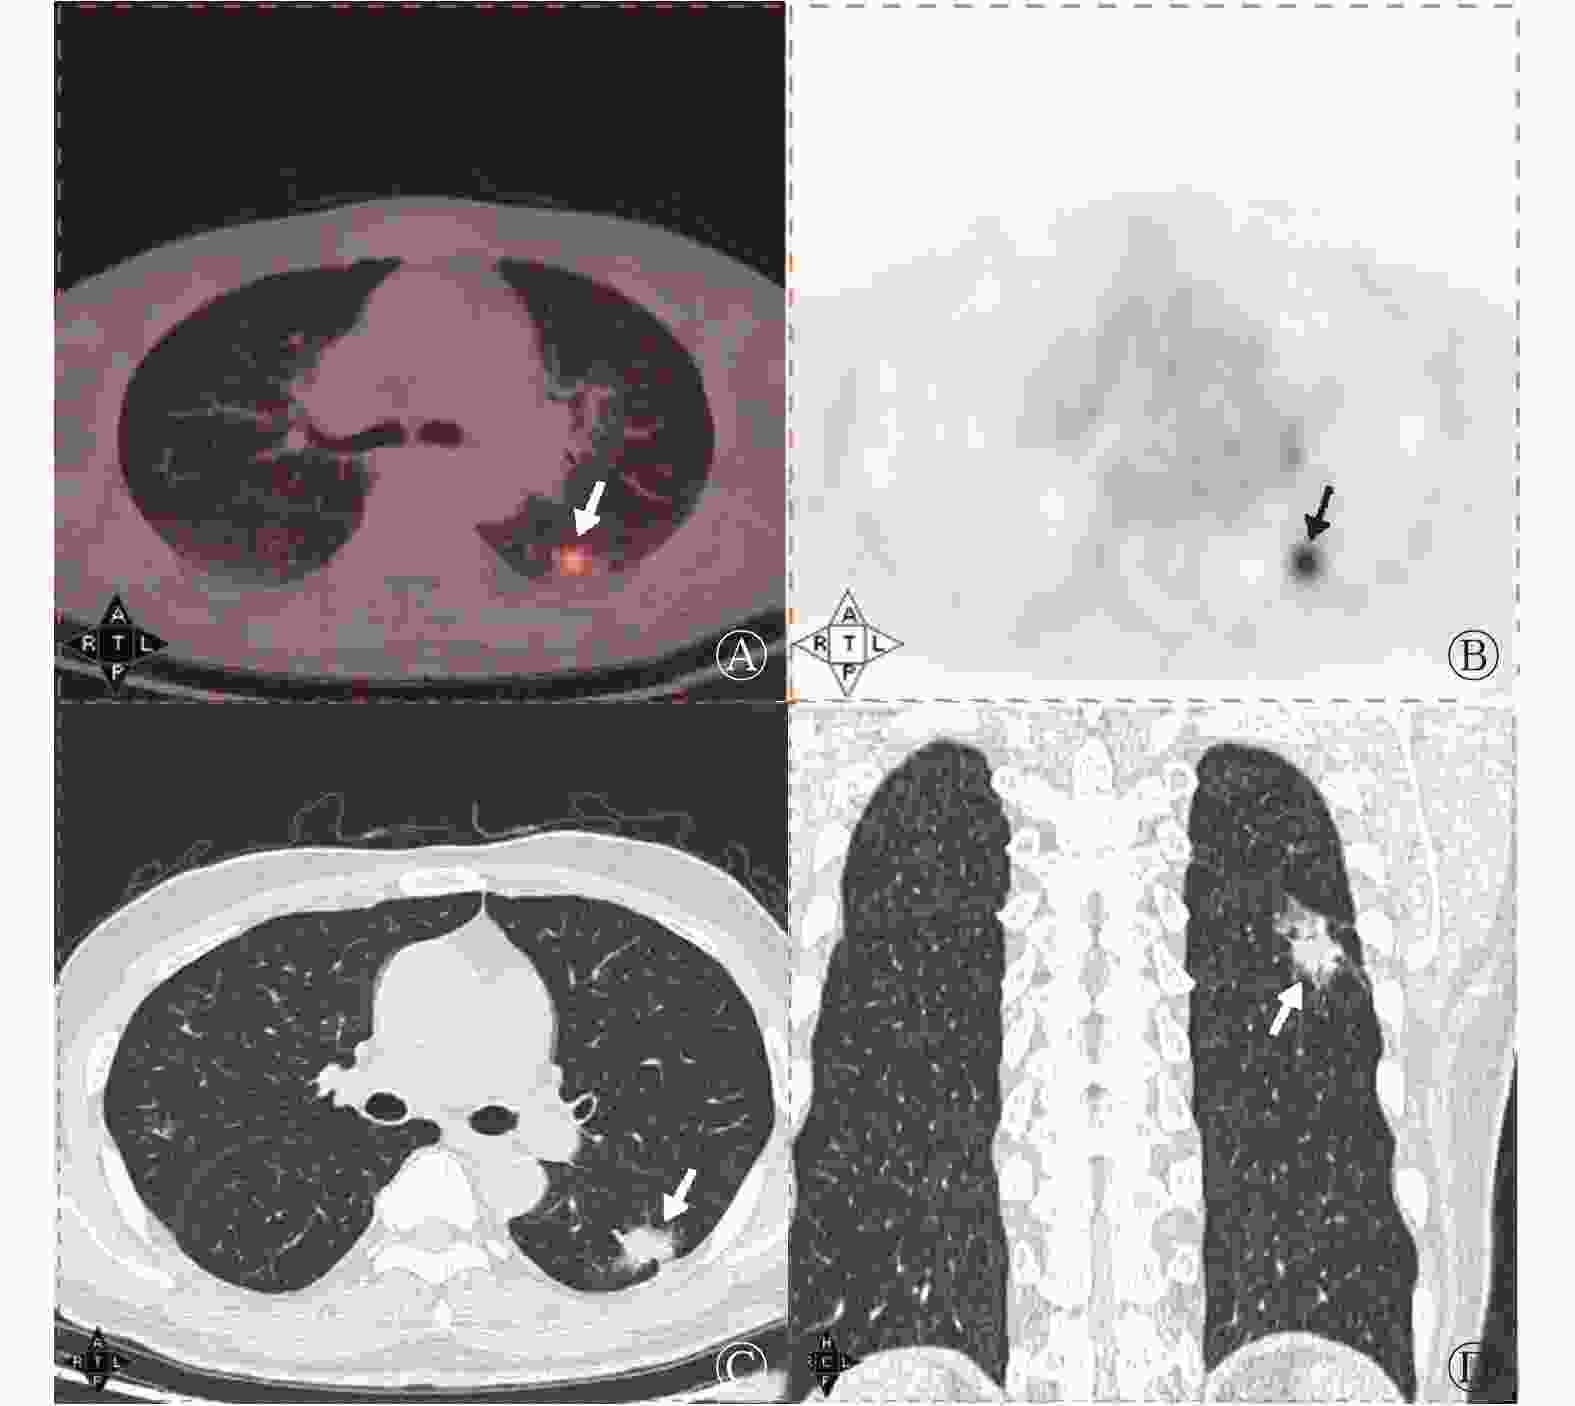
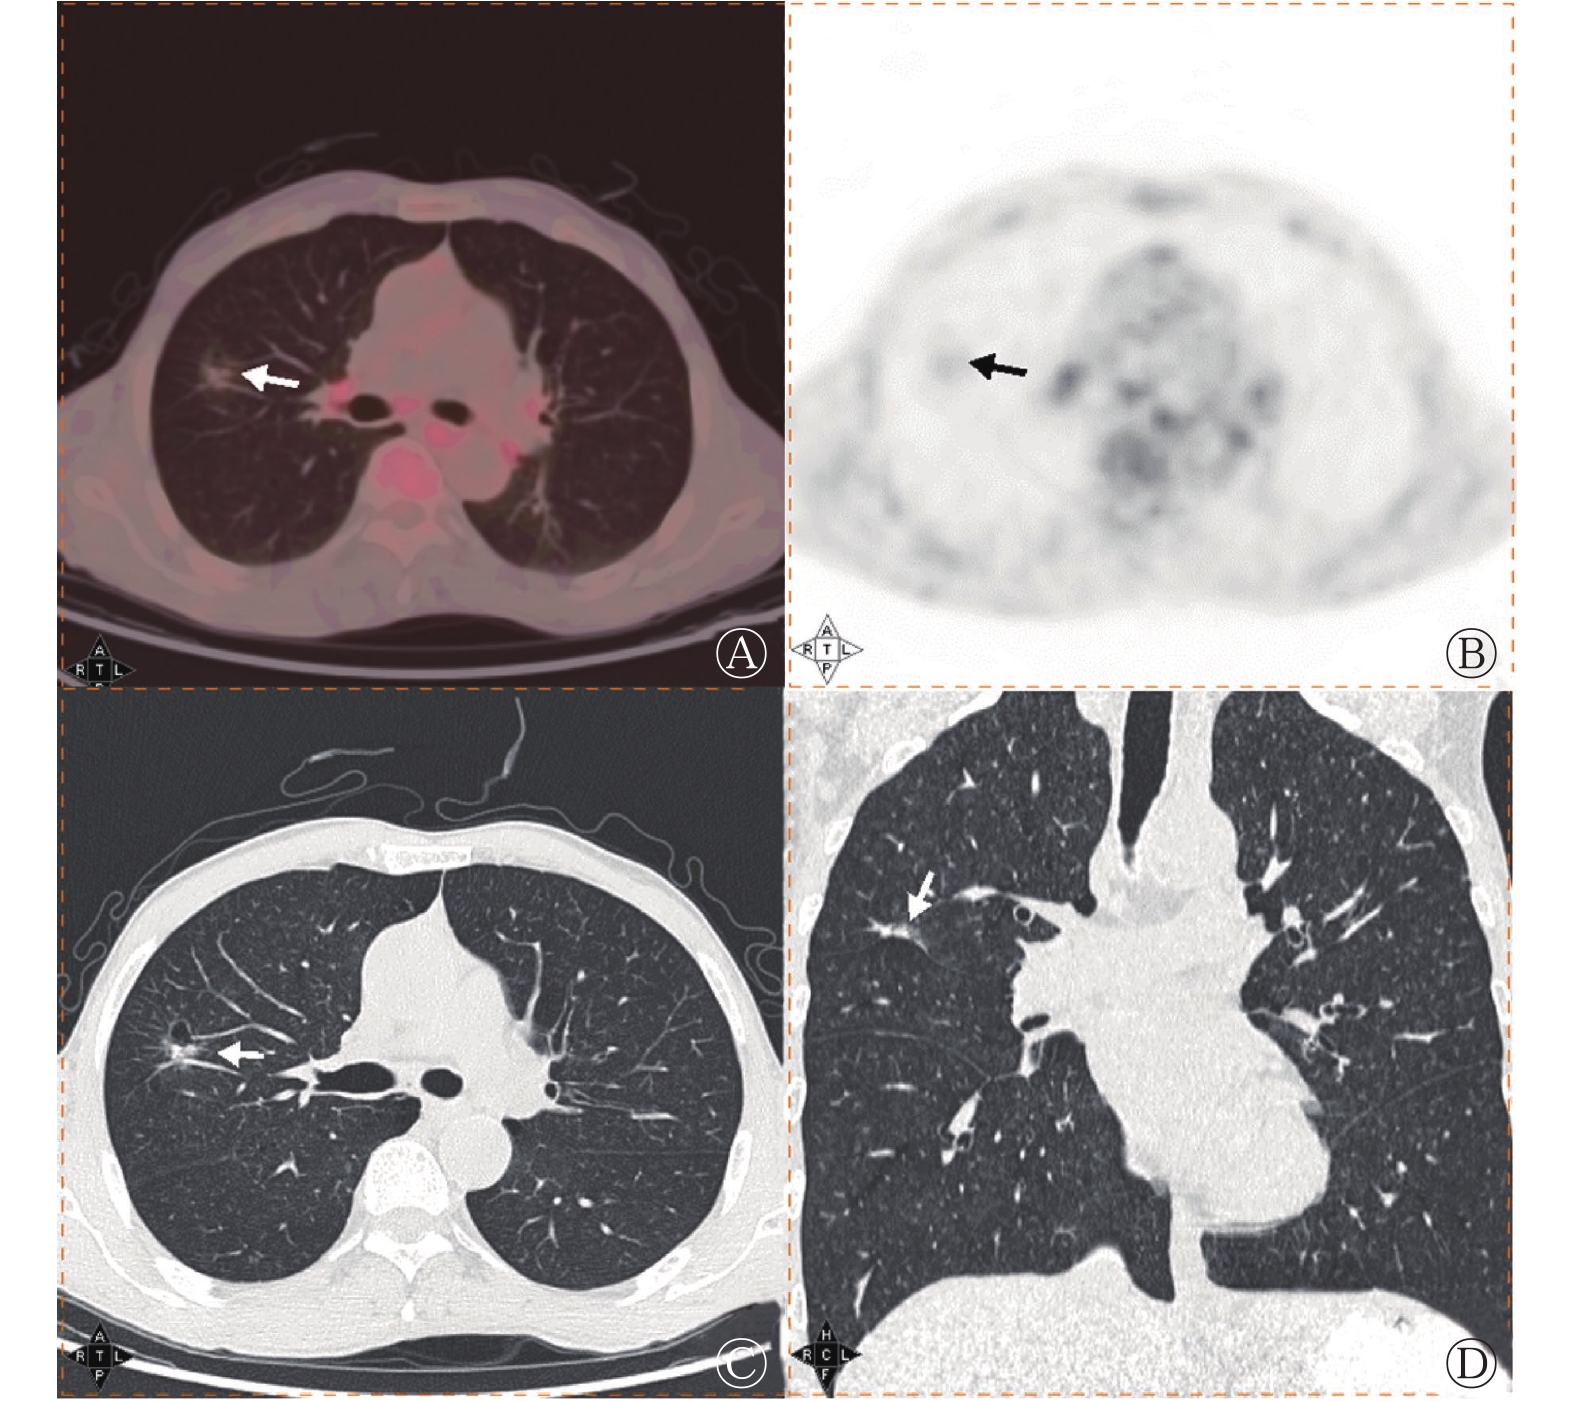
图 2 左肺浸润性肺腺癌GGN患者(男性,65岁)的18F-FDG PET/CT显像图
Figure 2. 18F-FDG PET/CT images of a patient (male, 65 years old) with pulmonary invasive adenocarcinoma appearing as ground-glass nodules of the left lung
-
多因素非条件Logistic回归分析结果显示,SUVmean、病灶径线和胸膜尾征为鉴别诊断低危组与高危组的独立影响因素(表2)。ROC曲线分析结果显示,当SUVmax=1.625时,AUC为0.699,约登指数为0.363,鉴别诊断低危组与高危组的灵敏度为57.7%(15/26)、特异度为78.6%(92/117)、准确率为74.8%(107/143);当SUVmean=0.845时,AUC为0.698,约登指数为0.244,鉴别诊断低危组与高危组的灵敏度为80.8%(21/26)、特异度为43.6%(51/117)、准确率为50.3%(72/143);当病灶径线=13.765 mm时,AUC为0.716,约登指数为0.355,鉴别诊断低危组与高危组的灵敏度为80.8%(21/26)、特异度为54.7%(64/117)、准确率为59.4%(85/143)。
分析因素 B值 标准误 Wald χ2值 P值 OR值 95%CI 病灶径线 0.184 0.083 4.887 0.027 1.202 1.021~1.416 SUVmax 0.234 0.267 0.766 0.381 1.263 0.748~2.133 SUVmean 0.627 0.285 4.844 0.028 1.872 1.071~3.271 分叶征 1.628 1.145 2.021 0.155 5.093 0.540~48.045 胸膜尾征 1.350 0.522 6.681 0.010 3.857 1.386~10.735 注:病灶经线为横断面最大层面长径和垂直短径的平均值;SUVmax为最大标准化摄取值;SUVmean为平均标准化摄取值;CI为置信区间 表 2 143例浸润性肺腺癌磨玻璃结节低危组与高危组患者病灶的多因素非条件Logistic回归分析结果
Table 2. Multivariate unconditional Logistic regression analysis for the diagnosis of 143 cases of pulmonary invasive adenocarcinoma appearing as ground-glass nodules in the low-risk group and high-risk groups
-
50例行18F-FDG PET/CT双时相显像的患者中,高危组10例、低危组40例。18F-FDG PET/CT双时相显像结果显示,高危组病灶RI及延迟显像的SUVmax、SUVmean、T/N均高于低危组,2组之间的差异均有统计学意义(均P<0.05);2组ΔT/Nmax之间的差异无统计学意义(P>0.05,表3)。在此基础上行多因素非条件Logistic回归分析,结果显示双时相显像RI及延迟显像的SUVmax、SUVmean、T/N均不是鉴别诊断低危组与高危组的独立影响因素。
组别 延迟显像SUVmax 延迟显像SUVmean 延迟显像T/N 双时相显像RI ΔT/Nmax 高危组(n=10) 2.85±1.82 2.72±1.69 5.84±3.83 0.20±0.07 0.23±0.18 低危组(n=40) 1.18±0.63 0.92±0.43 2.55±1.33 0.01±0.36 0.06±0.28 t值 −2.867 −3.359 −2.678 −3.042 −1.759 P值 0.018 0.008 0.024 0.004 0.085 注:FDG为氟脱氧葡萄糖;PET/CT为正电子发射断层显像计算机体层摄影术;SUVmax为最大标准化摄取值;SUVmean为平均标准化摄取值;T/N为肿瘤与对侧正常肺本底SUVmax的比值;RI为滞留指数;ΔT/Nmax为基于SUVmax的肿瘤与对侧正常肺本底的比值变化率 表 3 50例浸润性肺腺癌磨玻璃结节低危组与高危组患者病灶18F-FDG PET/CT双时相显像的代谢参数(
$\bar x $ Table 3. 18F-FDG PET/CT dual-phase imaging metabolism of 50 cases of pulmonary invasive adenocarcinoma appearing as ground-glass nodules in the low-risk and high-risk groups (
$\bar x $ -
由表4可知,不同因素的联合诊断对鉴别浸润性GGN危险程度的差异均有统计学意义(均P<0.05),其中,SUVmax+SUVmean+病灶径线+胸膜尾征+分叶征联合诊断的AUC(0.774)最高。由图3可见,SUVmax+SUVmean+病灶径线+胸膜尾征+分叶征联合诊断的诊断效能均高于独立影响因素SUVmean、病灶径线、胸膜尾征的单独诊断效能。
分析因素 AUC 95%CI P值 灵敏度 特异度 准确率 约登
指数阳性预测值 阴性预测值 SUVmax 0.699 0.572~0.827 0.004 0.577(15/26) 0.786(92/117) 0.748(107/143) 0.363 0.375(15/40) 0.893(92/103) SUVmean 0.698 0.573~0.823 0.004 0.808(21/26) 0.436(51/117) 0.503(72/143) 0.244 0.241(21/87) 0.911(51/56) 病灶径线 0.716 0.599~0.833 0.002 0.808(21/26) 0.547(64/117) 0.594(85/143) 0.355 0.284(21/74) 0.928(64/69) 胸膜尾征 0.654 0.527~0.781 0.025 0.692(18/26) 0.607(71/117) 0.622(89/143) 0.299 0.281(18/64) 0.899(71/79) 分叶征 0.605 0.484~0.726 0.129 0.923(24/26) 0.239(28/117) 0.364(52/143) 0.162 0.212(24/113) 0.933(28/30) SUVmax+病灶径线 0.727 0.612~0.842 0.001 0.538(14/26) 0.786(92/117) 0.741(106/143) 0.324 0.359(14/39) 0.885(92/104) SUVmax+胸膜尾征 0.738 0.626~0.849 0.001 0.423(11/26) 0.863(101/117) 0.783(112/143) 0.286 0.407(11/27) 0.871(101/116) SUVmax+SUVmean 0.701 0.580~0.823 0.004 0.577(15/26) 0.786(92/117) 0.748(107/143) 0.363 0.375(15/40) 0.893(92/103) SUVmax+分叶征 0.728 0.610~0.845 0.001 0.577(15/26) 0.803(94/117) 0.762(109/143) 0.380 0.395(15/38) 0.895(94/105) SUVmax+SUVmean+ 病灶径线 0.738 0.629~0.847 0.001 0.538(14/26) 0.786(92/117) 0.741(106/143) 0.324 0.359(14/39) 0.885(92/104) SUVmax+SUVmean+ 胸膜尾征 0.724 0.609~0.839 0.001 0.423(11/26) 0.863(101/117) 0.783(112/143) 0.286 0.407(11/27) 0.871(101/116) SUVmax+SUVmean+ 分叶征 0.718 0.605~0.830 0.002 0.577(15/26) 0.803(94/117) 0.762(109/143) 0.380 0.395(15/38) 0.895(94/105) SUVmax+SUVmean+ 病灶径线+胸膜 尾征 0.755 0.648~0.861 <0.01 0.385(10/26) 0.863(101/117) 0.776(111/143) 0.248 0.385(10/26) 0.863(101/117) SUVmax+SUVmean+ 病灶径线+胸膜 尾征+分叶征 0.774 0.672~0.876 <0.01 0.385(10/26) 0.863(101/117) 0.776(111/143) 0.248 0.385(10/26) 0.863(101/117) 注:病灶经线为横断面最大层面长径和垂直短径的平均值;SUVmax为最大标准化摄取值;SUVmean为平均标准化摄取值;AUC为曲线下面积;CI为置信区间 表 4 不同因素及其联合鉴别浸润性肺腺癌磨玻璃结节危险程度的诊断效能
Table 4. Efficacy of different factors and their combined diagnosis in differentiating the risk levels of ground-glass nodules in pulmonary invasive adenocarcinoma

图 3 独立影响因素SUVmean、病灶径线、胸膜尾征单独诊断与SUVmax+SUVmean+病灶径线+胸膜尾征+分叶征联合诊断鉴别浸润性肺腺癌磨玻璃结节危险程度的受试者工作特征曲线病灶径线为横断面最大层面长径和垂直短径的平均值;SUVmean为平均标准化摄取值;SUVmax为最大标准化摄取值
Figure 3. Receiver operating characteristic curves of independent influencing factors mean standardized uptake value, lesion size and pleural indentation sign, and maximum standardized uptake value combined with mean standardized uptake value, lesion size, pleural indentation and lobulation sign to diagnose the risk level of ground-glass nodules in pulmonary invasive adenocarcinoma
-
近年来的研究结果显示,浸润性肺腺癌的SPA或MPA这2种组织学亚型是肺腺癌的不良预后因素,LPA、APA、PPA、SPA和MPA的5年总生存率分别为94%、82%、77%、69%和57%,其中,SPA、MPA患者复发可能性更高[4, 7-8],故本研究中将含有SPA和(或)MPA病灶的患者归入高危组,与含有LPA和(或)APA和(或)PPA的低危组患者进行比较。18F-FDG PET/CT在肿瘤诊断中具有常规影像学检查无法替代的优势[9],考虑到<8 mm GGN的肺癌常无18F-FDG摄取增高,国内外有多项指南建议仅对≥8 mm的GGN行18F-FDG PET/CT检查[6, 10],PET/CT摄取参数结合临床病理因素可辅助肺癌的分型[11],然而关于18F-FDG摄取情况及MSCT征象对肺腺癌组织病理学不同危险程度诊断方面的研究尚不充分[12-13]。
本研究结果显示,高危组结节边缘更易出现分叶征、胸膜尾征,考虑与肿瘤细胞对周围组织的侵犯程度不同有关[14];病灶径线是鉴别低危组与高危组的独立影响因素,与以往的相关研究结果相符[7, 15-17]。本研究中病灶径线=13.765 mm可作为临界值鉴别诊断低危组与高危组结节,其灵敏度为80.8%、特异度为54.7%、准确率为59.4%。由于浸润性肺腺癌高危组GGN的CT征象与低危组相似,单一因素诊断存在一定局限性,与其他因素联合诊断的效能更高,因此,可采用分子水平影像学检查18F-FDG PET显像辅助鉴别。
18F-FDG PET/CT显像病灶的SUVmax鉴别诊断部分实性结节良恶性的价值较高[18]。国内外均有研究结果支持18F-FDG代谢参数与浸润性肺腺癌的预后密切相关[7, 19]。本研究中浸润性肺腺癌高危组的SUVmax、SUVmean均显著高于低危组;ROC曲线分析结果表明,SUVmax=1.625、SUVmean=0.845可以作为临界值用来鉴别低危组与高危组结节,但其灵敏度、特异度、准确率分别为57.7%、78.6%、74.8%和80.8%、43.6%、50.3%,提示单一因素诊断的临床价值有限。有研究结果显示,SUVmax、SUVmean与肿瘤的组织病理学评分、肺腺癌术后复发风险密切相关 [13, 15-16];浸润性肺腺癌不同组织病理学亚型的SUV存在差异,提示SUV对不同组织病理学亚型的浸润性肺腺癌有诊断价值[7, 15]。虽然一部分肺腺癌GGN的SUVmax<3,但因其具有影像与代谢表现相匹配的特点,可与表现为磨玻璃改变的炎症病灶相鉴别,后者的代谢较高,影像与代谢不匹配。本研究结果显示,低危组与高危组患者的18F-FDG PET/CT双时相显像RI以及延迟显像的SUVmax、SUVmean、T/N的差异均有统计学意义,提示高危组结节对18F-FDG的摄取程度更高,这说明了双时相显像对于鉴别低危组与高危组更有价值。
本研究结果还显示, SUVmax、SUV、病灶径线、分叶征、胸膜尾征联合诊断的效能优于单一因素诊断,可以更有效地识别高危病灶,其AUC为0.774、灵敏度为38.5%、特异度为86.3%、准确率为77.6%,AUC高于其他组合,这说明了联合诊断的临床应用价值更高。本研究具有一定的实际意义,对于不能或不愿进行手术的GGN患者,18F-FDG PET/CT将影像学特点与代谢特点相结合,可辅助诊断患者预后;当患者性别和年龄相近、CT征象相似时,借助高危组GGN的18F-FDG代谢水平高于低危组的诊断可对二者加以鉴别。
本研究的局限性:(1)病例分布不均衡,浸润性肺腺癌高危组与低危组病例数差距较大;(2)本研究是对组织病理学检查结果为肺腺癌或癌前病变的病例进行回顾性研究,是对可疑肿瘤患者行PET/CT显像,故组织病理学检查结果为炎症或者随访病灶消失的病例太少,无法进行对照研究,以后会继续积累相关病例进行对照研究;(3)SUVmean易受图像误差引起的波动影响,且本研究未涉及呼吸动度对结果的影响,以后会纳入更多可降低呼吸动度影响的指标进行深入探讨。
综上所述,在浸润性肺腺癌GGN的18F-FDG PET/CT诊断中,SUVmax>1.625、SUVmean>0.845、病灶径线>13.765 mm、分叶征、胸膜尾征联合鉴别有助于提示其为高危结节。
利益冲突 本研究由署名作者按以下贡献声明独立开展,不涉及任何利益冲突。
作者贡献声明 姜雯雯负责数据的采集和分析、论文的撰写;房娜负责论文的审阅、数据的分析;靳飞负责数据的统计学处理;李超伟、林帅、刘翠玉负责数据的采集、文献的检索和分析;曾磊负责论文的审阅;王艳丽负责研究命题的提出和设计。
18F-FDG PET/CT对浸润性肺腺癌磨玻璃结节危险程度的诊断价值
Value of 18F-FDG PET/CT in the diagnosis of risk level of pulmonary invasive adenocarcinoma appearing as ground-glass nodules
-
摘要:
目的 探讨18F-氟脱氧葡萄糖(FDG) PET/CT对浸润性肺腺癌磨玻璃结节(GGN)危险程度的诊断价值。 方法 回顾性分析2015年6月至2019年6月于青岛市中心医院经组织病理学检查或随访证实为浸润性肺腺癌的143例患者的临床资料,其中男性54例、女性89例,年龄30~79(60.2±8.9)岁。所有患者均行18F-FDG PET/CT全身显像(其中50例行18F-FDG PET/CT双时相显像)后经手术切除肺孤立性GGN,按腺癌生长模式分为2组:含有贴壁为主型腺癌(LPA)和(或)腺泡为主型腺癌(APA)和(或)乳头为主型腺癌(PPA)病灶的患者归入低危组;含有实体为主型腺癌(SPA)和(或)微乳头为主型腺癌(MPA)病灶的患者归入高危组。分别测量或记录患者以下信息:性别、年龄、病灶位置、径线、密度、最大标准化摄取值(SUVmax)、平均标准化摄取值(SUVmean)、双时相显像滞留指数(RI)、肿瘤与对侧正常肺本底SUVmax的比值(T/N)、基于SUVmax的肿瘤与对侧正常肺本底的比值变化率(ΔT/Nmax)及多层螺旋CT征象。计量资料的组间比较采用独立样本t检验,计数资料的组间比较采用χ2检验;采用多因素非条件Logistic回归分析组间差异有统计学意义的因素,根据其结果进行受试者工作特征(ROC)曲线分析。 结果 143例患者中,低危组(117例)与高危组(26例)的病灶径线[(14.33±4.18) mm对(17.61±4.48) mm]、SUVmax(1.32±1.07对2.00±1.25)、SUVmean(1.07±0.85对1.66±1.11)、双时相显像RI(0.01±0.36对0.20±0.07)、分叶征[76.1%(89/117)对92.3%(24/27)]、胸膜尾征[39.3%(46/117)对69.2%(18/26)]的差异均有统计学意义(t=−3.242~−2.392,χ2=4.773、6.766,均P<0.05)。行18F-FDG PET/CT双时相显像的50例患者中,低危组(40例)与高危组(10例)的延迟显像SUVmax(1.18±0.63对2.85±1.82)、延迟显像SUVmean(0.92±0.43对2.72±1.69)、延迟显像T/N(2.55±1.33对5.84±3.83)的差异均有统计学意义(t=−2.867、−3.359、−2.678,均P<0.05);SUVmean、病灶径线和胸膜尾征为鉴别诊断低危组和高危组的独立影响因素。ROC曲线分析结果显示,当SUVmax=1.625时,ROC曲线的曲线下面积(AUC)为0.699,鉴别诊断低危组与高危组的灵敏度为57.7%(15/26)、特异度为78.6%(92/117)、准确率为74.8%(107/143);当SUVmean=0.845时,AUC为0.698,鉴别诊断二者的灵敏度为80.8%(21/26)、特异度为43.6%(51/117)、准确率为50.3%(72/143);当病灶径线=13.765 mm时,AUC为0.716,鉴别诊断二者的灵敏度为80.8%(21/26)、特异度为54.7%(64/117)、准确率为59.4%(85/143);与单独诊断比较,SUVmax+SUVmean+病灶径线+胸膜尾征+分叶征联合诊断鉴别二者的效能最高。 结论 18F-FDG PET/CT有助于对浸润性肺腺癌GGN危险程度的诊断。 -
关键词:
- 肺腺癌 /
- 孤立性肺结节 /
- 氟脱氧葡萄糖F18 /
- 正电子发射断层显像术 /
- 体层摄影术,X线计算机 /
- 磨玻璃结节
Abstract:Objective To comparatively analyze the 18F-fluorodeoxyglucose (FDG) PET metabolic characteristics and multislice spiral CT imaging features of pulmonary invasive adenocarcinoma appearing as ground-glass nodules (GGN) with different risk levels and to evaluate the value of 18F-FDG PET/CT in the diagnosis of risk levels of GGN. Methods Retrospective analysis was performed on 143 patients (54 males, 89 females, 30−79(60.2±8.9) years old) with pulmonary invasive adenocarcinoma confirmed by histopathological examination or follow-up. All patients underwent 18F-FDG PET/CT whole body imaging (including 50 cases of 18F-FDG PET/CT dual-phase imaging) and surgical resection of solitary GGN of the lung. In accordance with the adenocarcinoma growth pattern, the patients were further divided into two groups. Patients with lesions with lepidic predominant adenocarcinoma and/or acinar predominant adenocarcinoma and/or papillary predominant adenocarcinoma were assigned to the low-risk group, and those with lesions with solid predominant adenocarcinoma and/or micropapillary predominant adenocarcinoma were classified into the high-risk group. The recorded data included gender, age, lesion location, size, density, maximum standardized uptake value (SUVmax), mean standardized uptake value (SUVmean), retention index (RI) in dual phase imaging, the SUVmax ratio of tumor to contralateral normal lung background (T/N), the rate of change in the ratio of tumor to contralateral normal lung background based on the SUVmax (ΔT/Nmax), lobulation sign, spiculation sign, vocule sign, air bronchgram, pleural indentation, and vascular convergence sign. Qualitative factors were analyzed by using independent-sample t test, whereas quantitative variables were analyzed by using χ2 test. Multivariate unconditional Logistic regression analysis was utilized to test the correlation factors with statistical differences before treatment. Receiver operating characteristic (ROC) curve analysis was performed in accordance with the Logistic regression analysis results. Results In 143 patients, lesion size ((14.33±4.18) mm vs. (17.61±4.48) mm), SUVmax (1.32±1.07 vs. 2.00±1.25), SUVmean (1.07±0.85 vs. 1.66±1.11), RI (0.01±0.36 vs. 0.20±0.07), lobulation (76.1%(89/117) vs. 92.3%(24/27)), and pleural indentation (39.3%(46/117) vs. 69.2%(18/26)) showed statistically significant differences between low-risk group (117 cases) and high-risk group (26 cases) (t=−3.242 to −2.392; χ2=4.773, 6.766; all P<0.05). In 50 patients underwent 18F-FDG PET/CT dual-phase imaging, delayed imaging SUVmax (1.18±0.63 vs. 2.85±1.82), delayed imaging SUVmean (0.92±0.43 vs. 2.72±1.69), delayed imaging T/N (2.55±1.33 vs. 5.84±3.83) showed statistically significant differences between low-risk group (40 cases) and high-risk group (10 cases) (t=−2.867, −3.359, −2.678; all P<0.05). Among these factors, SUVmean, lesion size, and pleural indentation were the independent influencing factors for differentiating the two groups. When the value of SUVmax was 1.625, the area under the ROC curve was 0.699. The sensitivity, specificity, and accuracy of differentiating the two groups were 57.7%(15/26), 78.6%(92/117), and 74.8%(107/143), respectively. When the value of SUVmean was 0.845, the area under the ROC curve was 0.698. The sensitivity, specificity, and accuracy of differentiating the two groups were 80.8%(21/26), 43.6%(51/117), and 50.3%(72/143), respectively. When the lesion size was 13.765 mm, the area under the ROC curve was 0.716, and the sensitivity, specificity, and accuracy of differentiating the two groups were 80.8%(21/26), 54.7%(64/117), and 59.4%(85/143), respectively. The combined diagnosis with SUVmax+SUVmean+lesion size+pleural indentation+lobulation sign has the highest efficiency in differentiating the two groups compared with single diagnosis. Conclusion In the diagnosis of pulmonary invasive adenocarcinoma appearing as GGN, 18F-FDG PET/CT contributes to risk levels. -
图 1 右肺浸润性肺腺癌GGN患者(男性,64岁)的18F-FDG PET/CT显像图
Figure 1. 18F-FDG PET/CT images of a patient (male, 64 years old) with pulmonary invasive adenocarcinoma appearing as ground-glass nodules of the right lung
图 2 左肺浸润性肺腺癌GGN患者(男性,65岁)的18F-FDG PET/CT显像图
Figure 2. 18F-FDG PET/CT images of a patient (male, 65 years old) with pulmonary invasive adenocarcinoma appearing as ground-glass nodules of the left lung
图 3 独立影响因素SUVmean、病灶径线、胸膜尾征单独诊断与SUVmax+SUVmean+病灶径线+胸膜尾征+分叶征联合诊断鉴别浸润性肺腺癌磨玻璃结节危险程度的受试者工作特征曲线病灶径线为横断面最大层面长径和垂直短径的平均值;SUVmean为平均标准化摄取值;SUVmax为最大标准化摄取值
Figure 3. Receiver operating characteristic curves of independent influencing factors mean standardized uptake value, lesion size and pleural indentation sign, and maximum standardized uptake value combined with mean standardized uptake value, lesion size, pleural indentation and lobulation sign to diagnose the risk level of ground-glass nodules in pulmonary invasive adenocarcinoma
表 1 浸润性肺腺癌磨玻璃结节低危组与高危组患者的临床资料和影像学特征的比较
Table 1. Analysis of the clinical data and imaging features of the low-risk and high-risk groups with pulmonary invasive adenocarcinoma appearing as ground-glass nodules
参数 高危组(n=26) 低危组(n=117) 检验值 P值 性别(男/女,例) 15/11 39/78 χ2=3.071 0.084 年龄( $\bar x $ 60.81±7.78 60.13±9.20 t=0.814 0.420 病灶位置(例) χ2=3.713 0.449 左肺上叶 5 26 左肺下叶 8 17 右肺上叶 9 44 右肺中叶 0 5 右肺下叶 4 25 病灶径线( $ \bar x $ 17.61±4.48 14.33±4.18 t=−3.242 0.002 病灶密度( $ \bar x $ −308.37±221.37 −352.45±187.79 t=−0.944 0.353 SUVmax( $\bar x $ 2.00±1.25 1.32±1.07 t=−2.568 0.012 SUVmean( $\bar x $ 1.66±1.11 1.07±0.85 t=−2.392 0.023 T/N( $\bar x $ 3.37±1.80 2.56±2.59 t=−1.391 0.168 MSCT征象[例(%)] 分叶征 24(92.3) 89(76.1) χ2=4.773 0.030 毛刺征 7 (26.9) 13(11.1) χ2=1.878 0.171 空泡征 9 (34.6) 43(36.8) χ2=0.000 0.993 支气管气相 9 (34.6) 46(39.3) χ2=0.112 0.744 胸膜尾征 18(69.2) 46(39.3) χ2=6.766 0.010 血管集束征 25(96.2) 92(78.6) χ2=3.542 0.063 注:病灶经线为横断面最大层面长径和垂直短径的平均值;SUVmax为最大标准化摄取值;SUVmean为平均标准化摄取值;T/N为肿瘤与对侧正常肺本底SUVmax的比值;MSCT为多层螺旋计算机体层摄影术  下载: 导出CSV
表 2 143例浸润性肺腺癌磨玻璃结节低危组与高危组患者病灶的多因素非条件Logistic回归分析结果
Table 2. Multivariate unconditional Logistic regression analysis for the diagnosis of 143 cases of pulmonary invasive adenocarcinoma appearing as ground-glass nodules in the low-risk group and high-risk groups
分析因素 B值 标准误 Wald χ2值 P值 OR值 95%CI 病灶径线 0.184 0.083 4.887 0.027 1.202 1.021~1.416 SUVmax 0.234 0.267 0.766 0.381 1.263 0.748~2.133 SUVmean 0.627 0.285 4.844 0.028 1.872 1.071~3.271 分叶征 1.628 1.145 2.021 0.155 5.093 0.540~48.045 胸膜尾征 1.350 0.522 6.681 0.010 3.857 1.386~10.735 注:病灶经线为横断面最大层面长径和垂直短径的平均值;SUVmax为最大标准化摄取值;SUVmean为平均标准化摄取值;CI为置信区间
下载: 导出CSV
表 3 50例浸润性肺腺癌磨玻璃结节低危组与高危组患者病灶18F-FDG PET/CT双时相显像的代谢参数(
$\bar x $ Table 3. 18F-FDG PET/CT dual-phase imaging metabolism of 50 cases of pulmonary invasive adenocarcinoma appearing as ground-glass nodules in the low-risk and high-risk groups (
$\bar x $ 组别 延迟显像SUVmax 延迟显像SUVmean 延迟显像T/N 双时相显像RI ΔT/Nmax 高危组(n=10) 2.85±1.82 2.72±1.69 5.84±3.83 0.20±0.07 0.23±0.18 低危组(n=40) 1.18±0.63 0.92±0.43 2.55±1.33 0.01±0.36 0.06±0.28 t值 −2.867 −3.359 −2.678 −3.042 −1.759 P值 0.018 0.008 0.024 0.004 0.085 注:FDG为氟脱氧葡萄糖;PET/CT为正电子发射断层显像计算机体层摄影术;SUVmax为最大标准化摄取值;SUVmean为平均标准化摄取值;T/N为肿瘤与对侧正常肺本底SUVmax的比值;RI为滞留指数;ΔT/Nmax为基于SUVmax的肿瘤与对侧正常肺本底的比值变化率
下载: 导出CSV
表 4 不同因素及其联合鉴别浸润性肺腺癌磨玻璃结节危险程度的诊断效能
Table 4. Efficacy of different factors and their combined diagnosis in differentiating the risk levels of ground-glass nodules in pulmonary invasive adenocarcinoma
分析因素 AUC 95%CI P值 灵敏度 特异度 准确率 约登
指数阳性预测值 阴性预测值 SUVmax 0.699 0.572~0.827 0.004 0.577(15/26) 0.786(92/117) 0.748(107/143) 0.363 0.375(15/40) 0.893(92/103) SUVmean 0.698 0.573~0.823 0.004 0.808(21/26) 0.436(51/117) 0.503(72/143) 0.244 0.241(21/87) 0.911(51/56) 病灶径线 0.716 0.599~0.833 0.002 0.808(21/26) 0.547(64/117) 0.594(85/143) 0.355 0.284(21/74) 0.928(64/69) 胸膜尾征 0.654 0.527~0.781 0.025 0.692(18/26) 0.607(71/117) 0.622(89/143) 0.299 0.281(18/64) 0.899(71/79) 分叶征 0.605 0.484~0.726 0.129 0.923(24/26) 0.239(28/117) 0.364(52/143) 0.162 0.212(24/113) 0.933(28/30) SUVmax+病灶径线 0.727 0.612~0.842 0.001 0.538(14/26) 0.786(92/117) 0.741(106/143) 0.324 0.359(14/39) 0.885(92/104) SUVmax+胸膜尾征 0.738 0.626~0.849 0.001 0.423(11/26) 0.863(101/117) 0.783(112/143) 0.286 0.407(11/27) 0.871(101/116) SUVmax+SUVmean 0.701 0.580~0.823 0.004 0.577(15/26) 0.786(92/117) 0.748(107/143) 0.363 0.375(15/40) 0.893(92/103) SUVmax+分叶征 0.728 0.610~0.845 0.001 0.577(15/26) 0.803(94/117) 0.762(109/143) 0.380 0.395(15/38) 0.895(94/105) SUVmax+SUVmean+ 病灶径线 0.738 0.629~0.847 0.001 0.538(14/26) 0.786(92/117) 0.741(106/143) 0.324 0.359(14/39) 0.885(92/104) SUVmax+SUVmean+ 胸膜尾征 0.724 0.609~0.839 0.001 0.423(11/26) 0.863(101/117) 0.783(112/143) 0.286 0.407(11/27) 0.871(101/116) SUVmax+SUVmean+ 分叶征 0.718 0.605~0.830 0.002 0.577(15/26) 0.803(94/117) 0.762(109/143) 0.380 0.395(15/38) 0.895(94/105) SUVmax+SUVmean+ 病灶径线+胸膜 尾征 0.755 0.648~0.861 <0.01 0.385(10/26) 0.863(101/117) 0.776(111/143) 0.248 0.385(10/26) 0.863(101/117) SUVmax+SUVmean+ 病灶径线+胸膜 尾征+分叶征 0.774 0.672~0.876 <0.01 0.385(10/26) 0.863(101/117) 0.776(111/143) 0.248 0.385(10/26) 0.863(101/117) 注:病灶经线为横断面最大层面长径和垂直短径的平均值;SUVmax为最大标准化摄取值;SUVmean为平均标准化摄取值;AUC为曲线下面积;CI为置信区间
下载: 导出CSV
-
[1] Travis WD, Brambilla E, Nicholson AG, et al. The 2015 world health organization classification of lung tumors: impact of genetic, clinical and radiologic advances since the 2004 classification[J]. J Thorac Oncol, 2015, 10(9): 1243−1260. DOI: 10.1097/JTO.0000000000000630. [2] Luo JZ, Huang QY, Wang R, et al. Prognostic and predictive value of the novel classification of lung adenocarcinoma in patients with stage IB[J]. J Cancer Res Clin Oncol, 2016, 142(9): 2031−2040. DOI: 10.1007/s00432-016-2192-6. [3] Yoshiya T, Mimae T, Tsutani Y, et al. Prognostic role of subtype classification in small-sized pathologic N0 invasive lung adenocarcinoma[J]. Ann Thorac Surg, 2016, 102(5): 1668−1673. DOI: 10.1016/j.athoracsur.2016.04.087. [4] Lederlin M, Puderbach M, Muley T, et al. Correlation of radio- and histomorphological pattern of pulmonary adenocarcinoma[J]. Eur Respir J, 2013, 41(4): 943−951. DOI: 10.1183/09031936.00056612. [5] Heidinger BH, Anderson KR, Nemec U, et al. Lung adenocarcinoma manifesting as pure ground-glass nodules: correlating CT Size, volume, density, and roundness with histopathologic invasion and size[J]. J Thorac Oncol, 2017, 12(8): 1288−1298. DOI: 10.1016/j.jtho.2017.05.017. [6] MacMahon H, Naidich DP, Goo JM, et al. Guidelines for management of incidental pulmonary nodules detected on CT images: from the fleischner society 2017[J]. Radiology, 2017, 284(1): 228−243. DOI: 10.1148/radiol.2017161659. [7] Son BY, Cho S, Yum SW, et al. The maximum standardized uptake value of preoperative positron emission tomography/computed tomography in lung adenocarcinoma with a ground-glass opacity component of less than 30 mm[J]. J Surg Oncol, 2018, 117(3): 451−456. DOI: 10.1002/jso.24857. [8] Suzuki M, Nakatani Y, Ito H, et al. Pulmonary adenocarcinoma with high-grade fetal adenocarcinoma component has a poor prognosis, comparable to that of micropapillary adenocarcinoma[J]. Mod Pathol, 2018, 31(9): 1404−1417. DOI: 10.1038/s41379-018-0057-z. [9] 张辉, 唐嘉励, 段东. 18F-FDG PET/CT联合同机HRCT对肺磨玻璃结节的诊断价值[J]. 国际放射医学核医学杂志, 2017, 41(4): 241−246. DOI: 10.3760/cma.j.issn.1673-4114.2017.04.002.
Zhang H, Tang JL, Duan D. Value of 18F-FDG PET/CT combined with the same scanner HRCT in the diagnosis of pulmonary ground-glass nodules[J]. Int J Radiat Med Nucl Med, 2017, 41(4): 241−246. DOI: 10.3760/cma.j.issn.1673-4114.2017.04.002.[10] 中华医学会呼吸病学分会肺癌学组, 中国肺癌防治联盟专家组. 肺结节诊治中国专家共识(2018年版)[J]. 中华结核和呼吸杂志, 2018, 41(10): 763−771. DOI: 10.3760/cma.j.issn.1001-0939.2018.10.004.
Lung Cancer Group, Respiratory Society, Chinese Medical Association, China Lung Cancer Prevention Alliance Expert Group. Chinese expert consensus on diagnosis and treatment of pulmonary nodules (2018 edition)[J]. Chin J Tuberc Respir Dis, 2018, 41(10): 763−771. DOI: 10.3760/cma.j.issn.1001-0939.2018.10.004.[11] Yang B, Ji HS, Ge YQ, et al. Correlation study of 18F-fluorodeoxyglucose positron emission tomography/computed tomography in pathological subtypes of invasive lung adenocarcinoma and prognosis[J/OL]. Front Oncol, 2019, 9: 908[2020-10-13]. https://www.frontiersin.org/articles/10.3389/fonc.2019.00908/full. DOI: 10.3389/fonc.2019.00908. [12] Eriguchi D, Shimada Y, Imai K, et al. Predictive accuracy of lepidic growth subtypes in early-stage adenocarcinoma of the lung by quantitative CT histogram and FDG-PET[J]. Lung Cancer, 2018, 125: 14−21. DOI: 10.1016/j.lungcan.2018.08.027. [13] Kawakita N, Toba H, Kawakami Y, et al. Use of a prognostic risk score that aggregates the FDG-PET/CT SUVmax, tumor size, and histologic group for predicting the prognosis of pStage Ⅰ lung adenocarcinoma[J]. Int J Clin Oncol, 2020, 25(6): 1079−1089. DOI: 10.1007/s10147-020-01637-6. [14] 金鑫, 赵绍宏, 高洁, 等. 纯磨玻璃密度肺腺癌病理分类及影像表现特点分析[J]. 中华放射学杂志, 2014, 48(4): 283−287. DOI: 10.3760/cma.j.issn.1005-1201.2014.04.005.
Jin X, Zhao SH, Gao J, et al. Pathological classification and imaging characteristics of early-stage lung adenocarcinoma with pure ground-glass opacity[J]. Chin J Radiol, 2014, 48(4): 283−287. DOI: 10.3760/cma.j.issn.1005-1201.2014.04.005.[15] Wang XY, Zhao YF, Liu Y, et al. Prognostic value of metabolic variables of [18F]FDG PET/CT in surgically resected stage Ⅰ lung adenocarcinoma[J]. Medicine (Baltimore), 2017, 96(35): e7941. DOI: 10.1097/MD.0000000000007941. [16] Harmon S, Seder CW, Chen S, et al. Quantitative FDG PET/CT may help risk-stratify early-stage non-small cell lung cancer patients at risk for recurrence following anatomic resection[J]. J Thorac Dis, 2019, 11(4): 1106−1116. DOI: 10.21037/jtd.2019.04.46. [17] 陈相猛, 段晓蓓, 龙晚生, 等. 高分辨CT影像学特征对非实性肺结节微浸润性腺癌与浸润性腺癌的鉴别诊断[J]. 国际放射医学核医学杂志, 2020, 44(5): 309−316. DOI: 10.3760/cma.j.cn121381-201909041-00038.
Chen XM, Duan XB, Long WS, et al. High resolution CT features of pulmonary non-solid nodules for distinguishing minimally invasive adenocarcinoma from invasive adenocarcinoma[J]. Int J Radiat Med Nucl Med, 2020, 44(5): 309−316. DOI: 10.3760/cma.j.cn121381-201909041-00038.[18] Niu R, Shao XN, Shao XL, et al. Lung adenocarcinoma manifesting as ground-glass opacity nodules 3 cm or smaller: evaluation with combined high-resolution CT and PET/CT modality[J]. Am J Roentgenol, 2019, 213(5): W236−W245. DOI: 10.2214/AJR.19.21382. [19] Jin F, Zhu H, Fu Z, et al. Prognostic value of the standardized uptake value maximum change calculated by dual-time-point 18F-fluorodeoxyglucose positron emission tomography imaging in patients with advanced non-small-cell lung cancer[J/OL]. Onco Targets Ther, 2016, 9: 2993−2999[2020-10-13]. https://www.dovepress.com/getfile.php?fileID=30466. DOI: 10.2147/OTT.S104919. -

 点击查看大图
计量
- 文章访问数: 8774
- HTML全文浏览量: 6338
- PDF下载量: 37
