


-
前列腺癌(prostate carcinoma,PCa)是全世界发病率居第2、病死率居第5的男性恶性肿瘤,每年新发患者约141.4万例,病死患者约37.5万例[1]。在我国,PCa的发病率呈持续上升态势,1998年为3.5/10万,至2008年达11.0/10万,居男性恶性肿瘤发病率的第6位;长三角地区为显著高发区域[2]。D'Amico标准依据血清前列腺特异抗原(prostate specific antigen,PSA)水平、格里森评分(Gleason score,GS)和肿瘤累及范围对PCa患者进行风险分层,不同风险患者的治疗决策及预后迥异[3]。传统影像学检查方法在PCa的风险分层、精确分期、低水平PSA生化复发的诊断等方面效能不足。为了更好地满足临床需要,PET/CT特异性显像剂68Ga 标记的前列腺特异性膜抗原(prostate specific membrane antigen,PSMA)开始应用于PCa的显像,其中以68Ga-PSMA-11最常见。目前,对初诊PCa患者68Ga-PSMA-11 PET/CT代谢体积参数的研究较少,海外的研究主要为基于欧美人群的小样本、单中心的诊断效能研究[4]。本研究初步探究68Ga-PSMA-11 PET/CT的代谢体积参数在不同维度风险分层的初诊PCa患者之间的差异。
-
回顾性分析2019年1月至12月于海军军医大学第一附属医院核医学科行68Ga-PSMA-11 PET/CT检查的85例初诊PCa患者的临床资料,患者年龄49~88(69.1±7.7)岁,所有患者均签署了知情同意书。本研究获得海军军医大学第一附属医院伦理委员会批准和研究数据备案(方案受理编号:2019-029,伦理批件编号:CHEC2019-0905)。
纳入标准:(1)临床资料完整,首次经前列腺活体组织穿刺检查结果确诊为PCa且1个月内行68Ga-PSMA-11 PET/CT显像;(2)行68Ga-PSMA-11 PET/CT检查前未经任何临床治疗(包括手术、内分泌治疗和放化疗等);(3)68Ga-PSMA-11 PET/CT检查前2周内血清水平检测结果显示PSA异常(≥4 ng/mL)(正常参考值0~4 ng/mL)。
排除标准:(1)临床资料不完整;(2)已接受治疗;(3)同时罹患其他肿瘤;(4)医学数字成像和通信(DICOM)图像上无法明确病灶性质。
-
使用740 MBq 68Ge/68Ga发生器(德国ITG公司,放射化学纯度>95%)自动淋洗PSMA-11前体(上海嘉标生物科技有限公司),合成68Ga-PSMA-11。患者注射示踪剂前静息15 min,按体重静脉给药(2.00~2.33 MBq/kg)后静息50 min,饮水及排空尿液后行PET/CT(德国西门子公司Biograph 64型)显像。扫描时双手置于身体两侧,范围从头部至股骨中段;先行体部CT显像,扫描参数:电流80 mA、电压120 kV、层厚2.5 mm;再行体部PET显像,共采集6个床位,每床位约2.5 min,扫描时管电流依组织的厚度及密度自动调节强度。数据衰减校正后行迭代重建,应用麦迪克斯工作站系统(北京麦迪克斯科技有限公司)对图像行自动对位融合,得到横断面、冠状面、矢状面断层图像及最大密度投影图像。
-
68Ga-PSMA-11 PET/CT图像由2位经验丰富的核医学副高级职称以上医师采用双盲阅片法分析,意见不一致时,以讨论后的一致意见为准。
前列腺、唾液腺、泪腺、下颌下腺、肝脏、小肠、胰腺可见正常生理性摄取;骨骼、关节退变等可见不规则性摄取;胆囊、肾脏、输尿管、膀胱可见生理性摄取。生理性摄取和浓聚灶以外的局部异常摄取灶则诊断为肿瘤病灶。前列腺内的肿瘤病灶为PCa原发灶,前列腺毗邻组织肿瘤病灶为直接侵犯灶,淋巴结和骨骼的肿瘤病灶为转移灶。
采用三维勾画法在PET/CT融合图像上自动测量和勾画肿瘤病灶ROI,系统自动计算出病灶SUVmax、平均标准化摄取值(mean standardized uptake value,SUVmean)等参数。以SUVmax的40%为界值,应用麦迪克斯软件自动勾画和计算ROI内SUVmax大于上述界值部分的体积,记为PSMA肿瘤体积(tumor volume of PSMA,PSMA-TV);病灶半定量值SUVmean与其PSMA-TV的乘积记为该病灶的PSMA总量(total lesion of PSMA,TL-PSMA);患者的全身视野内所有病灶的TL-PSMA的加和定义为全身肿瘤总量,记为TL-PSMA全身,其反映了患者的全身肿瘤负荷。相应的,PCa原发灶及直接侵犯灶的TL-PSMA和PSMA-TV分别定义为TL-PSMA原发、PSMA-TV原发;转移灶的TL-PSMA和PSMA-TV分别定义为TL-PSMA转移、PSMA-TV转移。TL-PSMA全身=TL-PSMA原发+TL-PSMA转移; PSMA-TV全身=PSMA-TV原发+PSMA-TV转移。
-
以GS=8分为临界值,将患者分为GS<8分组和GS≥8分组;以PSA=20 ng/mL为临界值,将患者分为PSA≤20 ng/mL组和PSA>20 ng/mL组;根据临床分期的不同,将患者分为临床T1~T2期组和临床T3~T4期组;根据是否发生肿瘤转移将患者分为转移组和无转移组。
根据美国国立综合癌症网络指南[2]的推荐,将85例患者按PCa的风险分层分为中低风险组和高风险组,即同时符合GS<8分、PSA≤20 ng/mL、临床T1~T2期3个条件者被划入中低风险组;符合GS≥8分、PSA>20 ng/mL、临床T3~T4期3个条件中任何1个条件者即被划入高风险组。
-
应用SPSS 21.0软件统计分析数据。符合正态分布且方差齐的计量资料以
$ \bar x \pm s$ 表示;不符合正态分布的计量资料用中位数与范围表示。组间68Ga-PSMA-11 PET/CT代谢体积参数的比较采用两独立样本非参数Mann-Whitney秩和检验。所有统计显著性检验均为双尾检验,P<0.05为差异有统计学意义。 -
85例患者的68Ga-PSMA-11 PET/CT显像结果均呈阳性,其中,无转移组46例(54.1%),转移组39例(45.9%)。在转移组中,仅有1个转移灶的患者10例(11.8%),有2~9个转移灶的患者19例(22.4%),有10个及以上转移灶的患者10例(11.8%)。
GS<8分组的患者33例(38.8%),GS≥8分组的患者52例(61.2%)。PSA≤20 ng/mL组的患者34例(40.0%),PSA>20 ng/mL组的患者51例(60.0%)。临床T1~T2期组的患者53例(62.4%),临床T3~T4期组的患者32例(37.6%)。低中风险组患者15例(17.6%),高风险组患者70例(82.4%)。
患者年龄、GS、PSA、临床T分期、风险分层等具体结果见表1。
参数 无转移组(n=46) 转移组(n=39) 年龄( $ \bar x \pm s$ 

69.1±7.2 69.2±8.5 GS(例) 6分 6 1 7分 16 10 8分 13 14 9分 10 11 10分 1 3 PSA(例) ≤20 ng/mL 29 5 >20 ng/mL 17 34 T分期(例) T2a 19 1 T2b 5 5 T2c 14 9 T3a 1 1 T3b 7 12 T4 0 11 风险分层(例) 低中风险 13 2 高风险 33 37 注:PSMA为前列腺特异性膜抗原;PET/CT为正电子发射断层显像计算机体层摄影术;PCa为前列腺癌;GS为格里森评分;PSA为前列腺特异抗原 表 1 85例PCa患者的临床特征与68Ga-PSMA-11 PET/CT 显像的结果
Table 1. Clinical characteristics and 68Ga-prostate specific membrane antigen-11 PET/CT findings of 85 prostate carcinoma patients
-
由表2可知,高风险组SUVmax、PSMA-TV原发、PSMA-TV全身、TL-PSMA原发、TL-PSMA全身的中位数均高于低中风险组,且差异均有统计学意义(均P<0.05)。由表3可知,转移组SUVmax、PSMA-TV原发、PSMA-TV全身、TL-PSMA原发、TL-PSMA全身的中位数均高于无转移组,且差异均有统计学意义(均P<0.05)。
组别 SUVmax PSMA-TV原发(cm3) PSMA-TV全身(cm3) TL-PSMA原发(cm3) TL-PSMA全身(cm3) 低中风险组(n=15) 4.2(2.2~21.9) 8.4(1.6~22.4) 11.4(1.6~22.4) 27.4(3.2~86.3) 28.6(3.2~86.3) 高风险组(n=70) 13.8(2.3~50.5) 16.5(1.5~218.4) 21.9(1.7~333.9) 146.1(5.1~3822.0) 229.6(5.3~4510.4) Z值 −3.449 −2.438 −3.009 −3.631 −4.242 P值 <0.001 0.015 0.003 <0.001 <0.001 注:PCa为前列腺癌;PSMA为前列腺特异性膜抗原;PET/CT为正电子发射断层显像计算机体层摄影术;SUVmax为最大标准化摄取值;TV为肿瘤体积;TL为肿瘤总量 表 2 不同风险分层的PCa患者68Ga-PSMA-11 PET/CT代谢体积参数的差异比较[中位数(范围)]
Table 2. Comparison of metabolic volume parameters of 68Ga-prostate specific membrane antigen-11 PET/CT in prostate carcinoma patients with different risk stratification (median (range))
组别 SUVmax PSMA-TV原发(cm3) PSMA-TV全身(cm3) TL-PSMA原发(cm3) TL-PSMA全身(cm3) 无转移组(n=46) 9.8(2.2~50.5) 10.8(1.6~58.3) 10.8(1.6~58.3) 37.2(3.2~399.3) 37.2(3.2~399.3) 转移组(n=39) 16.2(2.9~40.0) 39.5(1.5~218.4) 58.8(3.5~333.9) 318.4(5.1~3822.0) 628.0(14.7~4510.4) Z值 −2.580 −4.070 −6.301 −4.022 −5.900 P值 0.010 <0.001 <0.001 <0.001 <0.001 注:PCa为前列腺癌;PSMA为前列腺特异性膜抗原;PET/CT为正电子发射断层显像计算机体层摄影术;SUVmax为最大标准化摄取值;TV为肿瘤体积;TL为肿瘤总量 表 3 不同转移情况的PCa患者68Ga-PSMA-11 PET/CT代谢体积参数的差异比较[中位数(范围)]
Table 3. Comparison of metabolic volume parameters of 68Ga-prostate specific membrane antigen-11 PET/CT in prostate carcinoma patients with different metastasis (median (range))
由表4可知,GS≥8组SUVmax、PSMA-TV原发、PSMA-TV全身、TL-PSMA原发、TL-PSMA全身的中位数均高于GS<8组,除PSMA-TV原发外,差异均有统计学意义(均P<0.05)。由表5可知,PSA>20 ng/mL组SUVmax、PSMA-TV原发、PSMA-TV全身、TL-PSMA原发、TL-PSMA全身的中位数均高于PSA≤20 ng/mL组,且差异均有统计学意义(均P<0.001)。由表6可知,临床T3~T4期组SUVmax、PSMA-TV原发、PSMA-TV全身、TL-PSMA原发、TL-PSMA全身的中位数均高于临床T1~T2期组,且差异均有统计学意义(均P<0.001)。
组别 SUVmax PSMA-TV原发(cm3) PSMA-TV全身(cm3) TL-PSMA原发(cm3) TL-PSMA全身(cm3) GS<8分组(n=33) 9.9(2.2~26.9) 12.5(1.6~76.4) 14.3(1.6~133.9) 36.3(3.2~1084.9) 36.3(3.2~1573.9) GS≥8分组(n=52) 14.8(2.3~50.5) 16.5(1.5~218.4) 23.9(1.7~333.9) 146.1(5.1~3822.0) 229.6(5.3~4510.4) Z值 −2.390 −1.231 −2.088 −2.074 −2.850 P值 0.017 0.218 0.037 0.038 0.004 注:GS为格里森评分;PCa为前列腺癌;PSMA为前列腺特异性膜抗原;PET/CT为正电子发射断层显像计算机体层摄影术;SUVmax为最大标准化摄取值;TV为肿瘤体积;TL为肿瘤总量 表 4 不同GS评分的PCa患者68Ga-PSMA-11 PET/CT代谢体积参数的差异比较[中位数(范围)]
Table 4. Comparison of metabolic volume parameters of 68Ga-prostate specific membrane antigen-11 PET/CT in prostate carcinoma patients with different GSs (median (range))
组别 SUVmax PSMA-TV原发(cm3) PSMA-TV全身(cm3) TL-PSMA原发(cm3) TL-PSMA全身(cm3) 临床T1~T2分期组(n=53) 9.3(2.2~31.1) 10.7(1.5~218.4) 14.3(1.6~302.2) 32.6(3.2~3288.0) 45.9(3.2~4510.4) 临床T3~T4分期组(n=32) 16.6(3.1~50.5) 34.9(1.9~160.7) 62.3(2.7~333.9) 303.5(9.5~2187.7) 482.1(14.7~2738.8) Z值 −3.629 −3.792 −4.077 −4.508 −4.889 P值 <0.001 <0.001 <0.001 <0.001 <0.001 注:PCa为前列腺癌;PSMA为前列腺特异性膜抗原;PET/CT为正电子发射断层显像计算机体层摄影术;SUVmax为最大标准化摄取值;TV为肿瘤体积;TL为肿瘤总量 表 6 不同临床T分期的PCa患者68Ga-PSMA-11 PET/CT代谢体积参数的差异比较[中位数(范围)]
Table 6. Comparison of metabolic volume parameters of 68Ga-prostate specific membrane antigen-11 PET/CT in prostate carcinoma patients at different clinical T stages (median (range))
组别 SUVmax PSMA-TV原发(cm3) PSMA-TV全身(cm3) TL-PSMA原发(cm3) TL-PSMA全身(cm3) PSA≤20 ng/mL组(n=34) 6.4(2.2~50.5) 8.2(1.5~222.4) 10.2(1.6~22.5) 28.0(3.2~318.3) 29.7(3.2~318.3) PSA>20 ng/mL组(n=51) 16.2(2.3~40.0) 24.7(1.7~218.4) 41.4(1.7~333.9) 253.9(7.5~3822.0) 361.5(7.5~4510.4) Z值 −3.948 −5.329 −5.907 −5.544 −6.279 P值 <0.001 <0.001 <0.001 <0.001 <0.001 注:PSA为前列腺特异抗原;PCa为前列腺癌;PSMA为前列腺特异性膜抗原;PET/CT为正电子发射断层显像计算机体层摄影术;SUVmax为最大标准化摄取值;TV为肿瘤体积;TL为肿瘤总量 表 5 不同PSA水平的PCa患者68Ga-PSMA-11 PET/CT代谢体积参数的差异比较[中位数(范围)]
Table 5. Comparison of metabolic volume parameters of 68Ga-prostate specific membrane antigen-11 PET/CT in prostate carcinoma patients with different PSA levels (median (range))
-
本研究特选取了4例典型PCa患者的68Ga-PSMA-11 PET/CT显像图,这4例患者的全身肿瘤负荷呈增加的趋势(图1~4)。

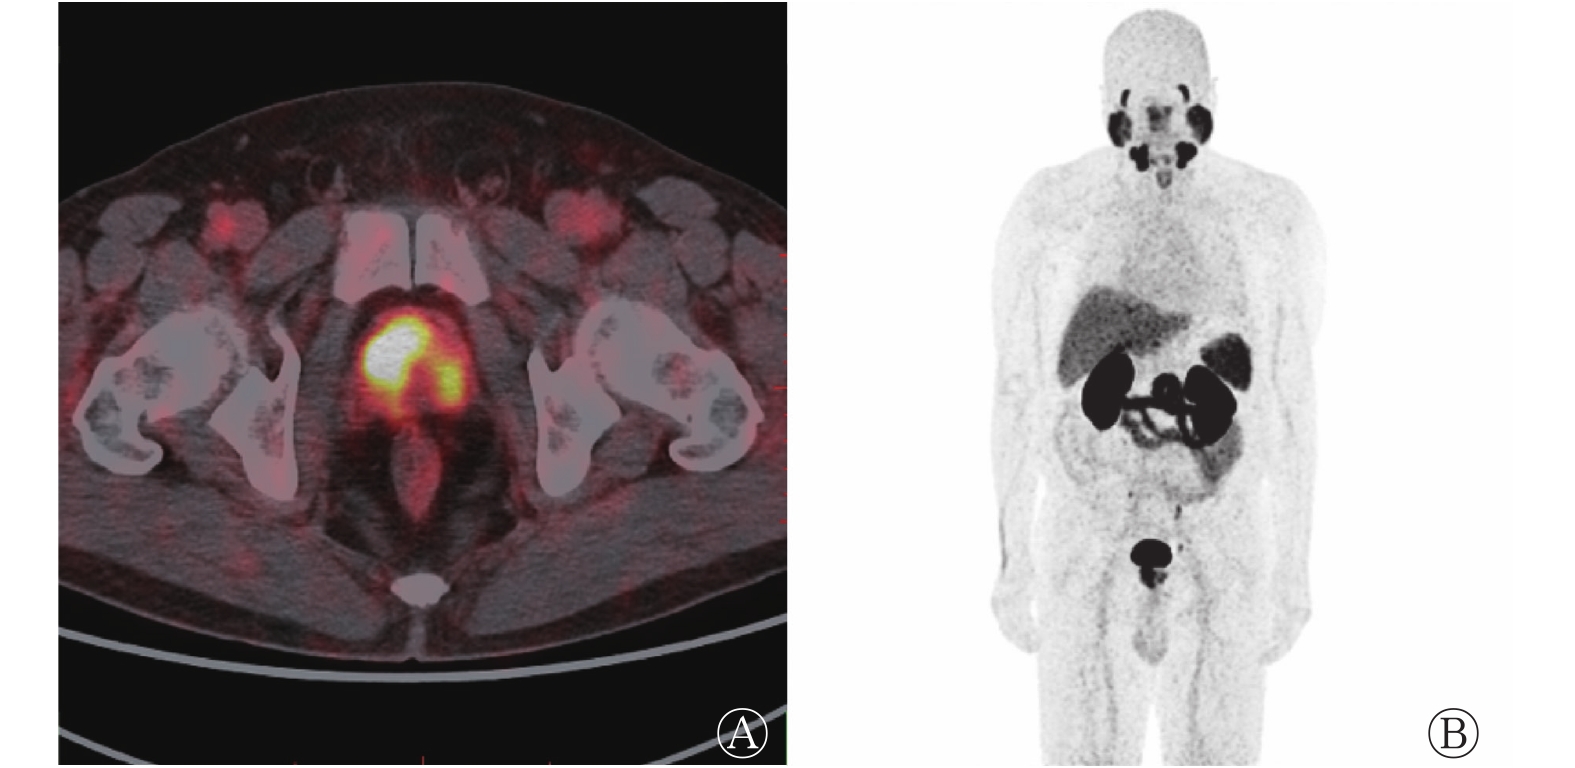
图 1 前列腺癌中低风险无转移患者的前列腺68Ga-PSMA-11 PET/CT横断面显像图(A)及最大密度投影图(B)
Figure 1. 68Ga-prostate specific membrane antigen-11 PET/CT transverse image of prostate (A) and maximum density projection image (B) in low risk and non-metastatic patient with prostate carcinoma
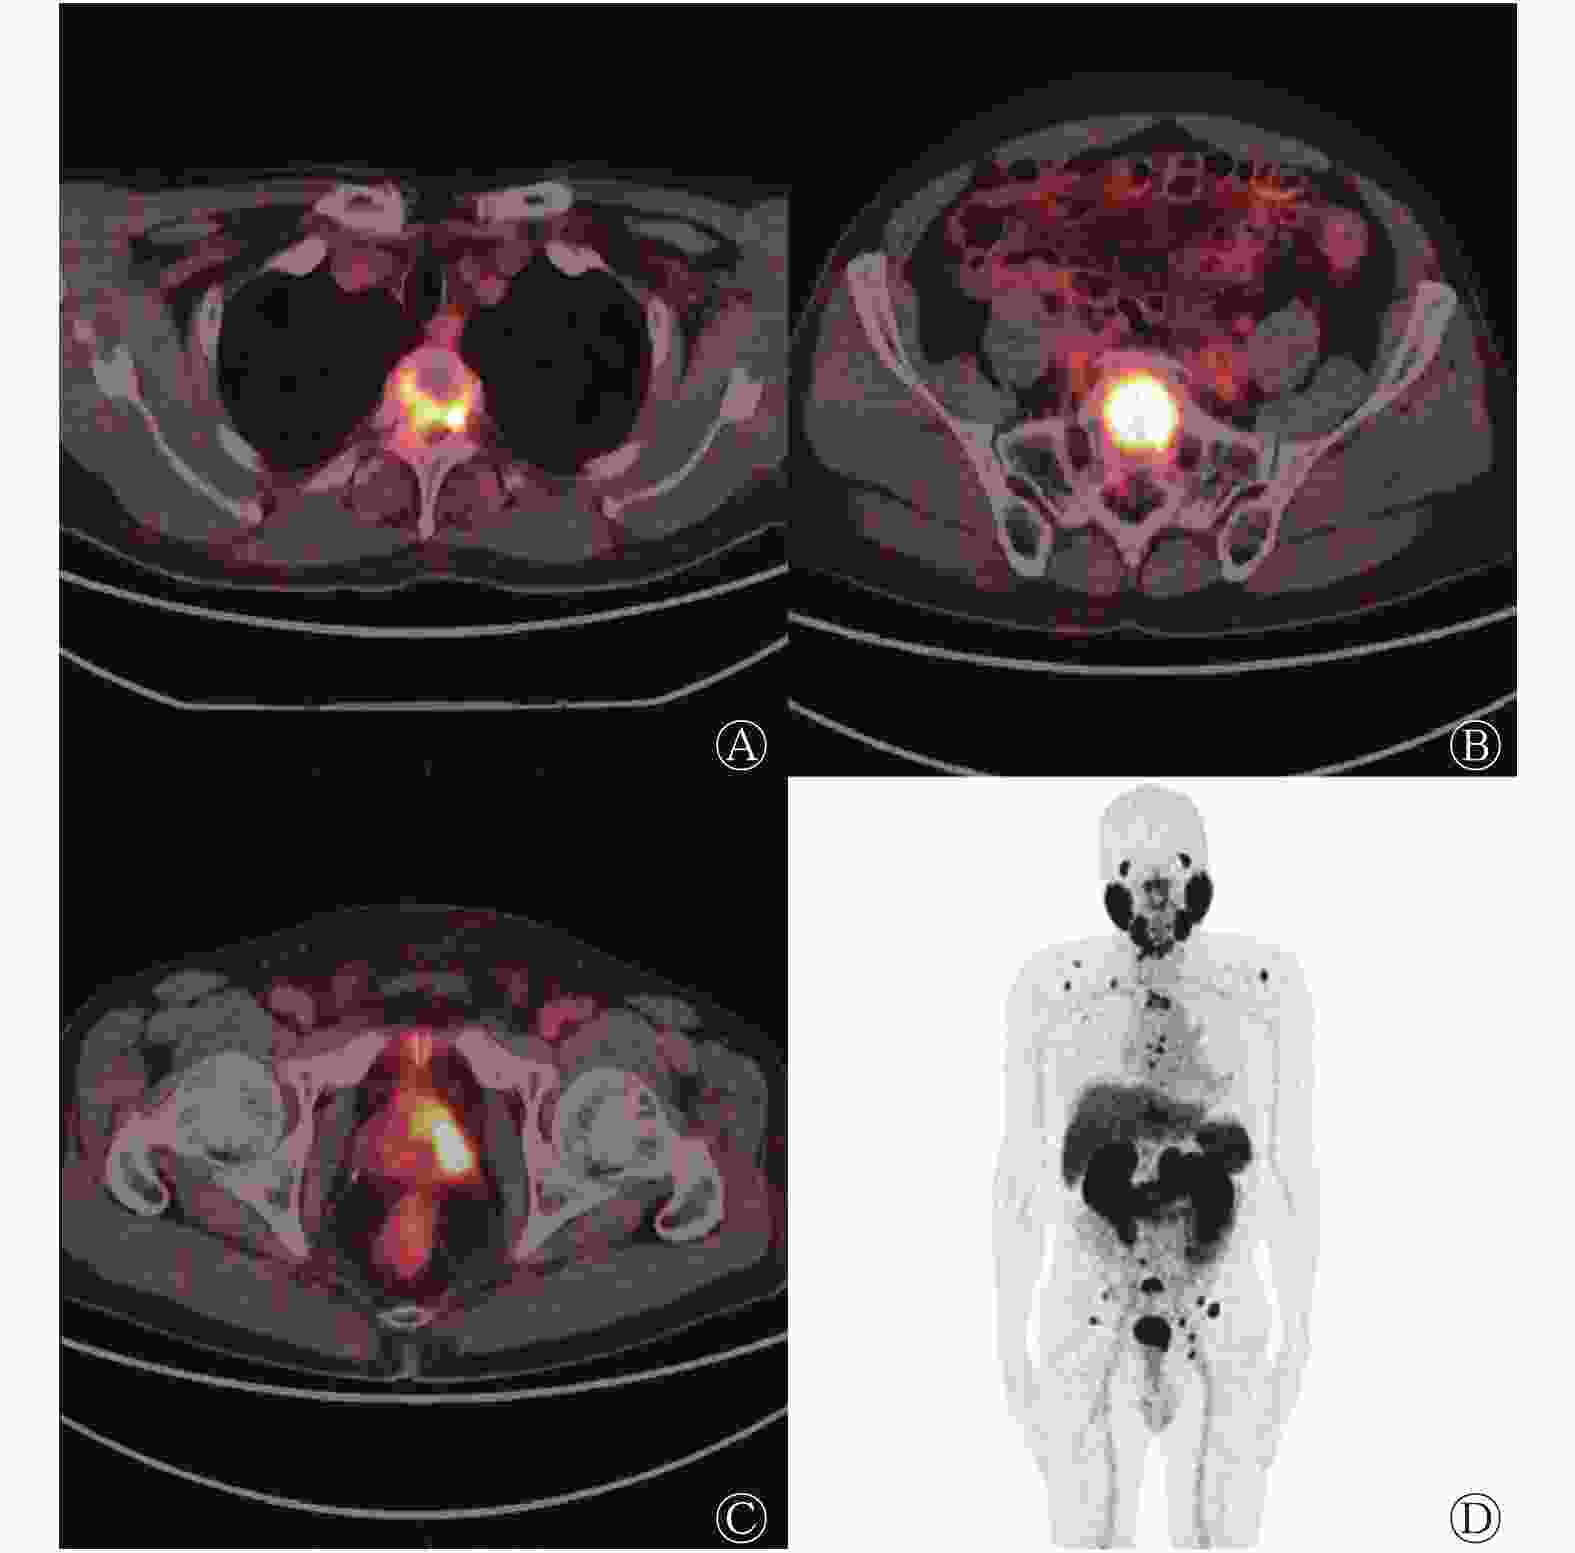
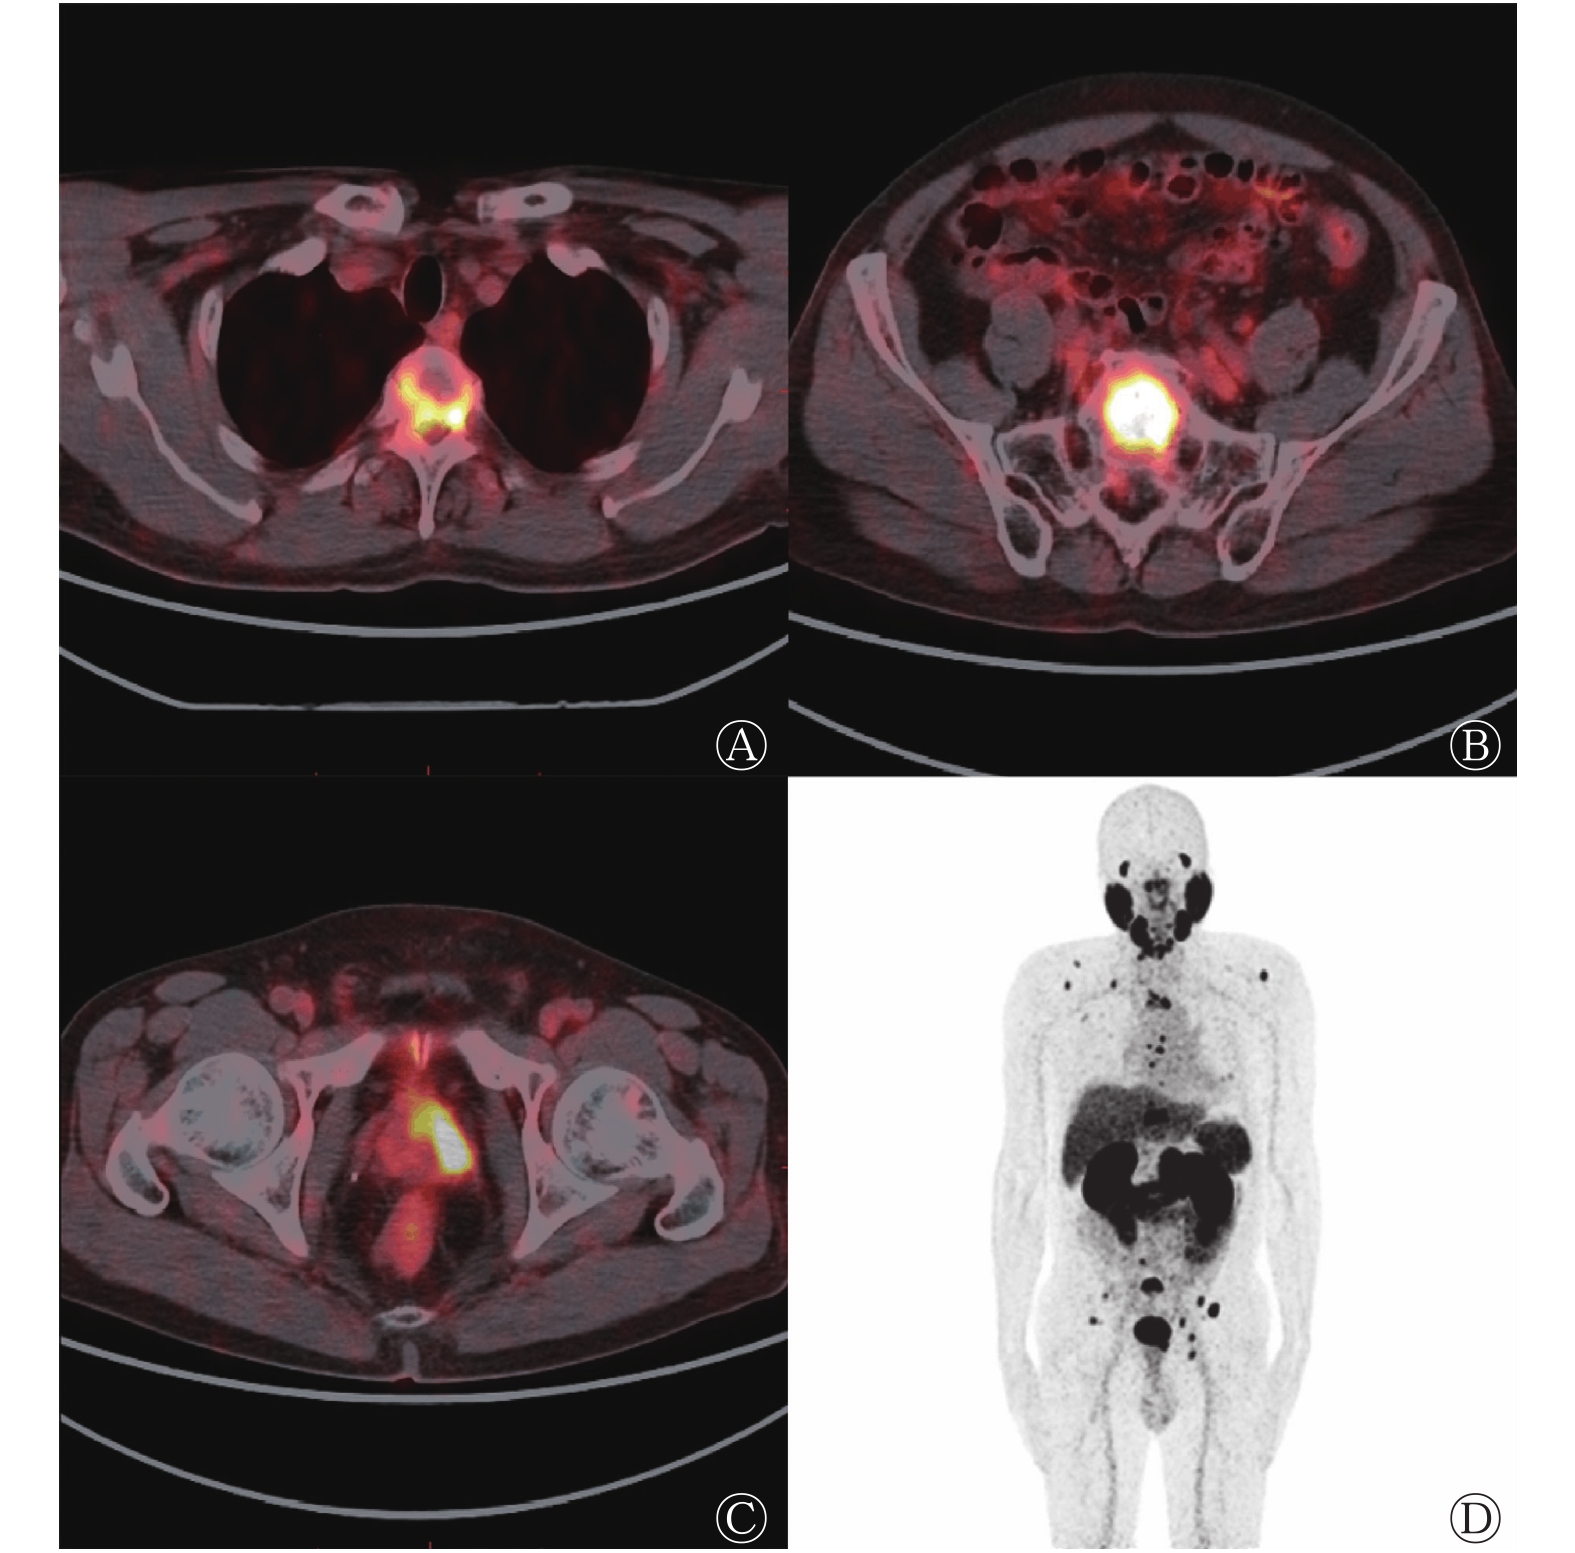
图 4 前列腺癌高风险多发转移患者的胸、骶椎及附件68Ga-PSMA-11 PET/CT横断面显像图(A、B)、前列腺横断面融合图(C)及最大密度投影图(D)
Figure 4. 68Ga-prostate specific membrane antigen-11 PET/CT images of thoracic, sacral vertebrae and accessories with multiple metastases (A, B), transverse images of prostate (C) and maximum density projection image (D) in high risk patient with multiple metastases of prostate carcinoma
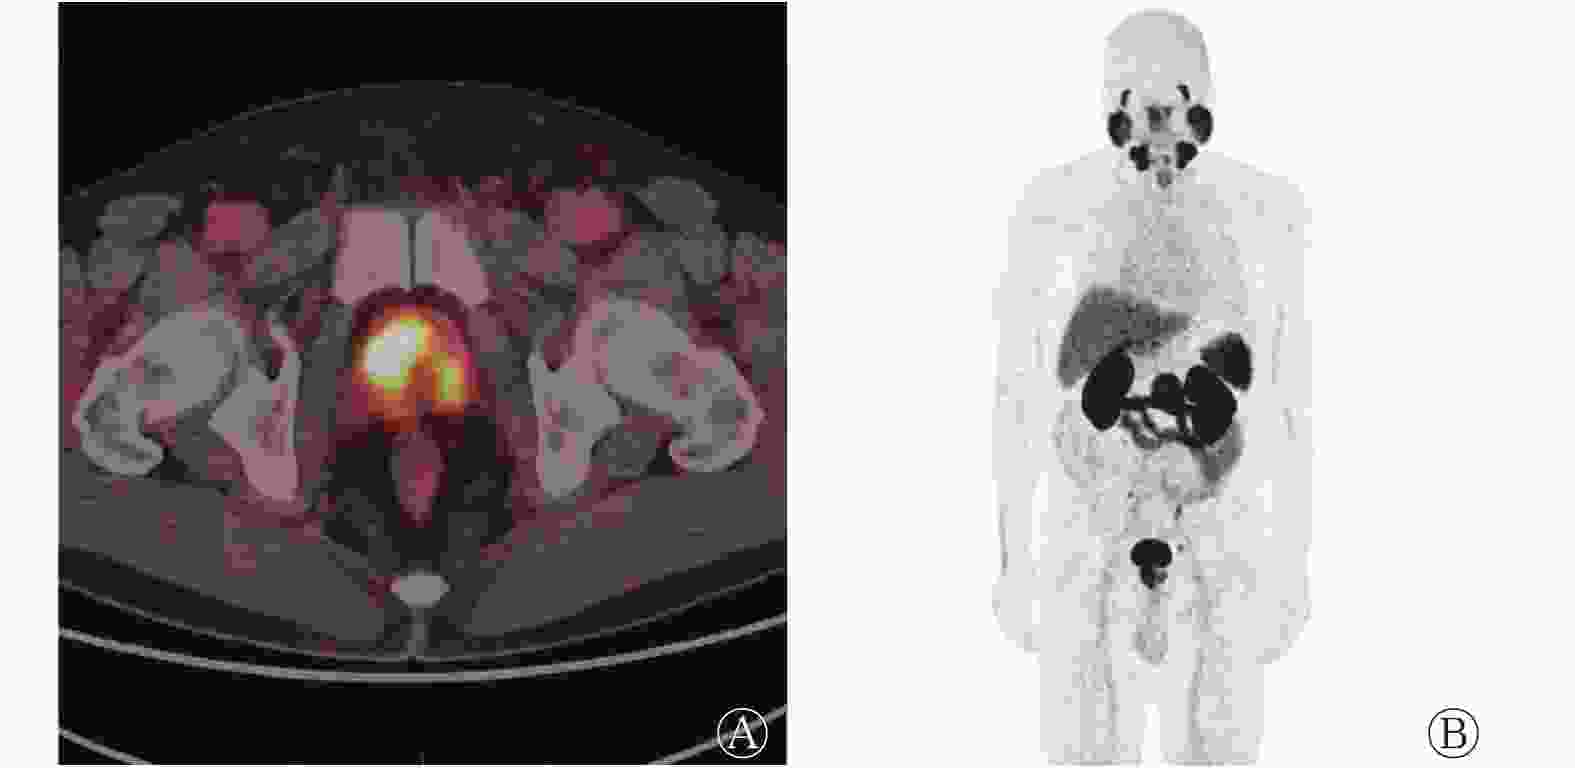
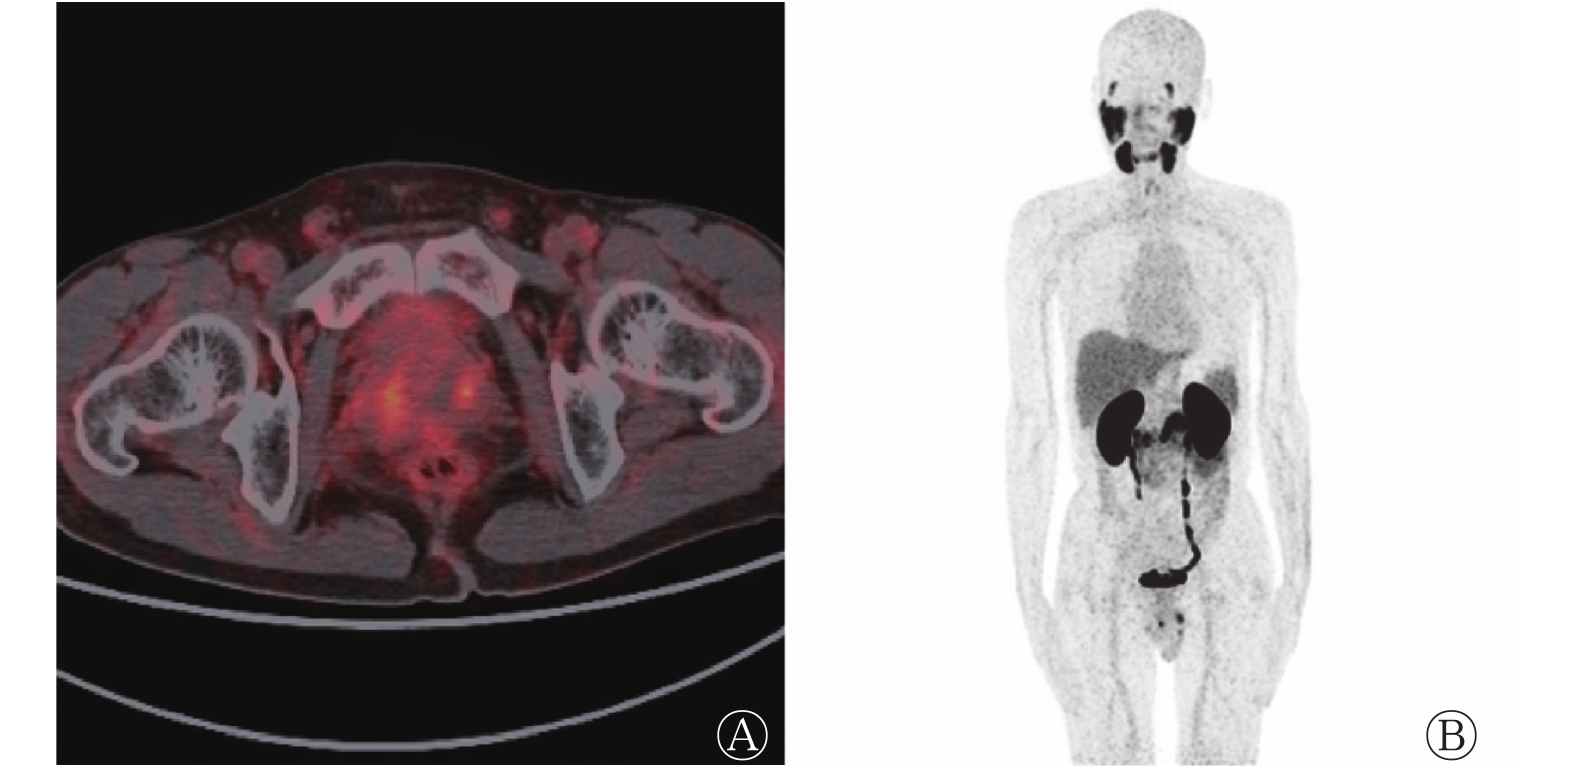
图 2 前列腺癌高风险无转移患者的前列腺68Ga-PSMA-11 PET/CT横断面显像图(A)及最大密度投影图(B)
Figure 2. 68Ga-prostate specific membrane antigen-11 PET/CT transverse image of prostate (A) and maximum density projection image (B) in high risk non-metastatic patient with prostate carcinoma
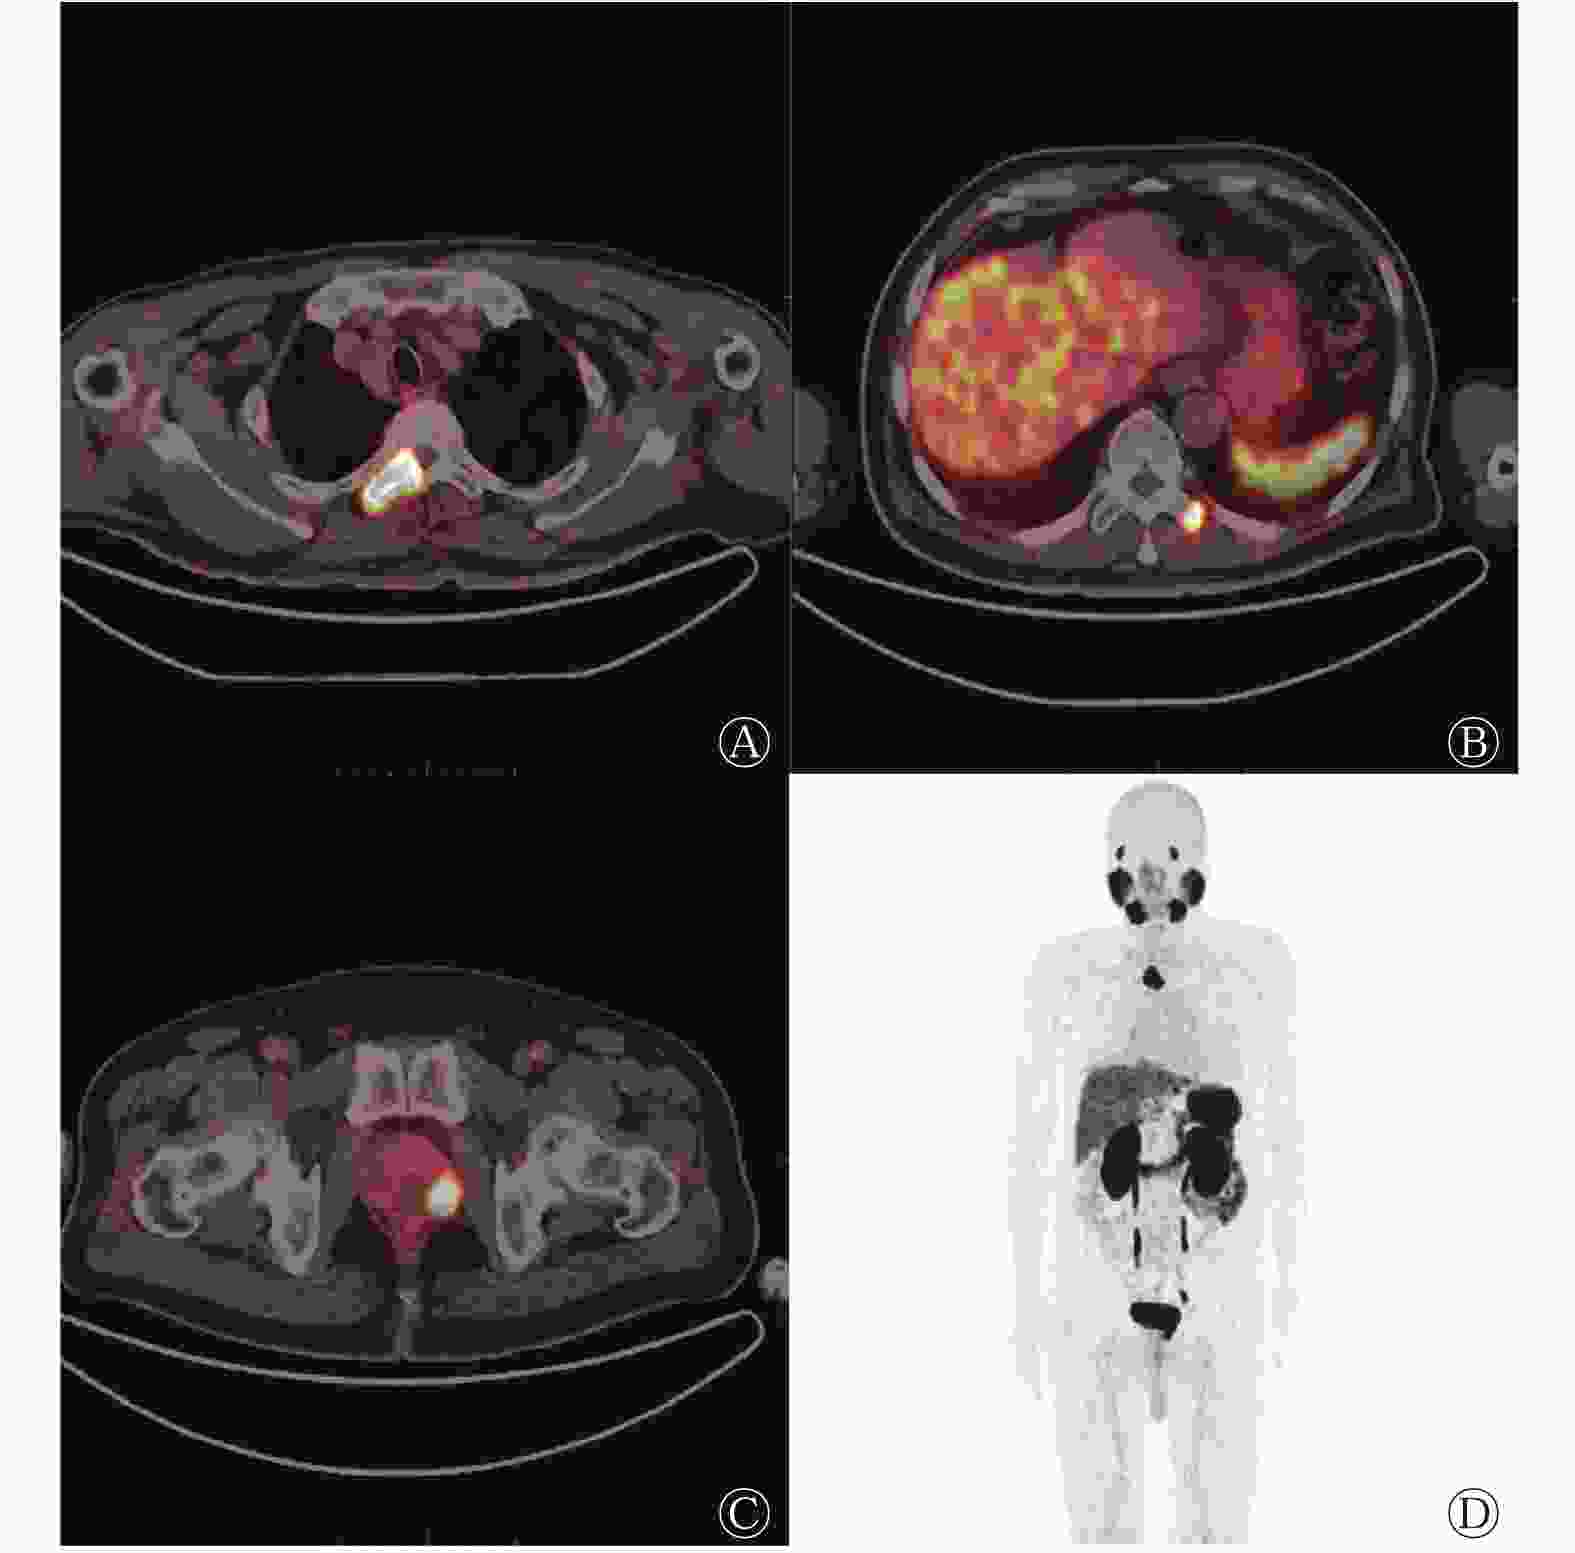
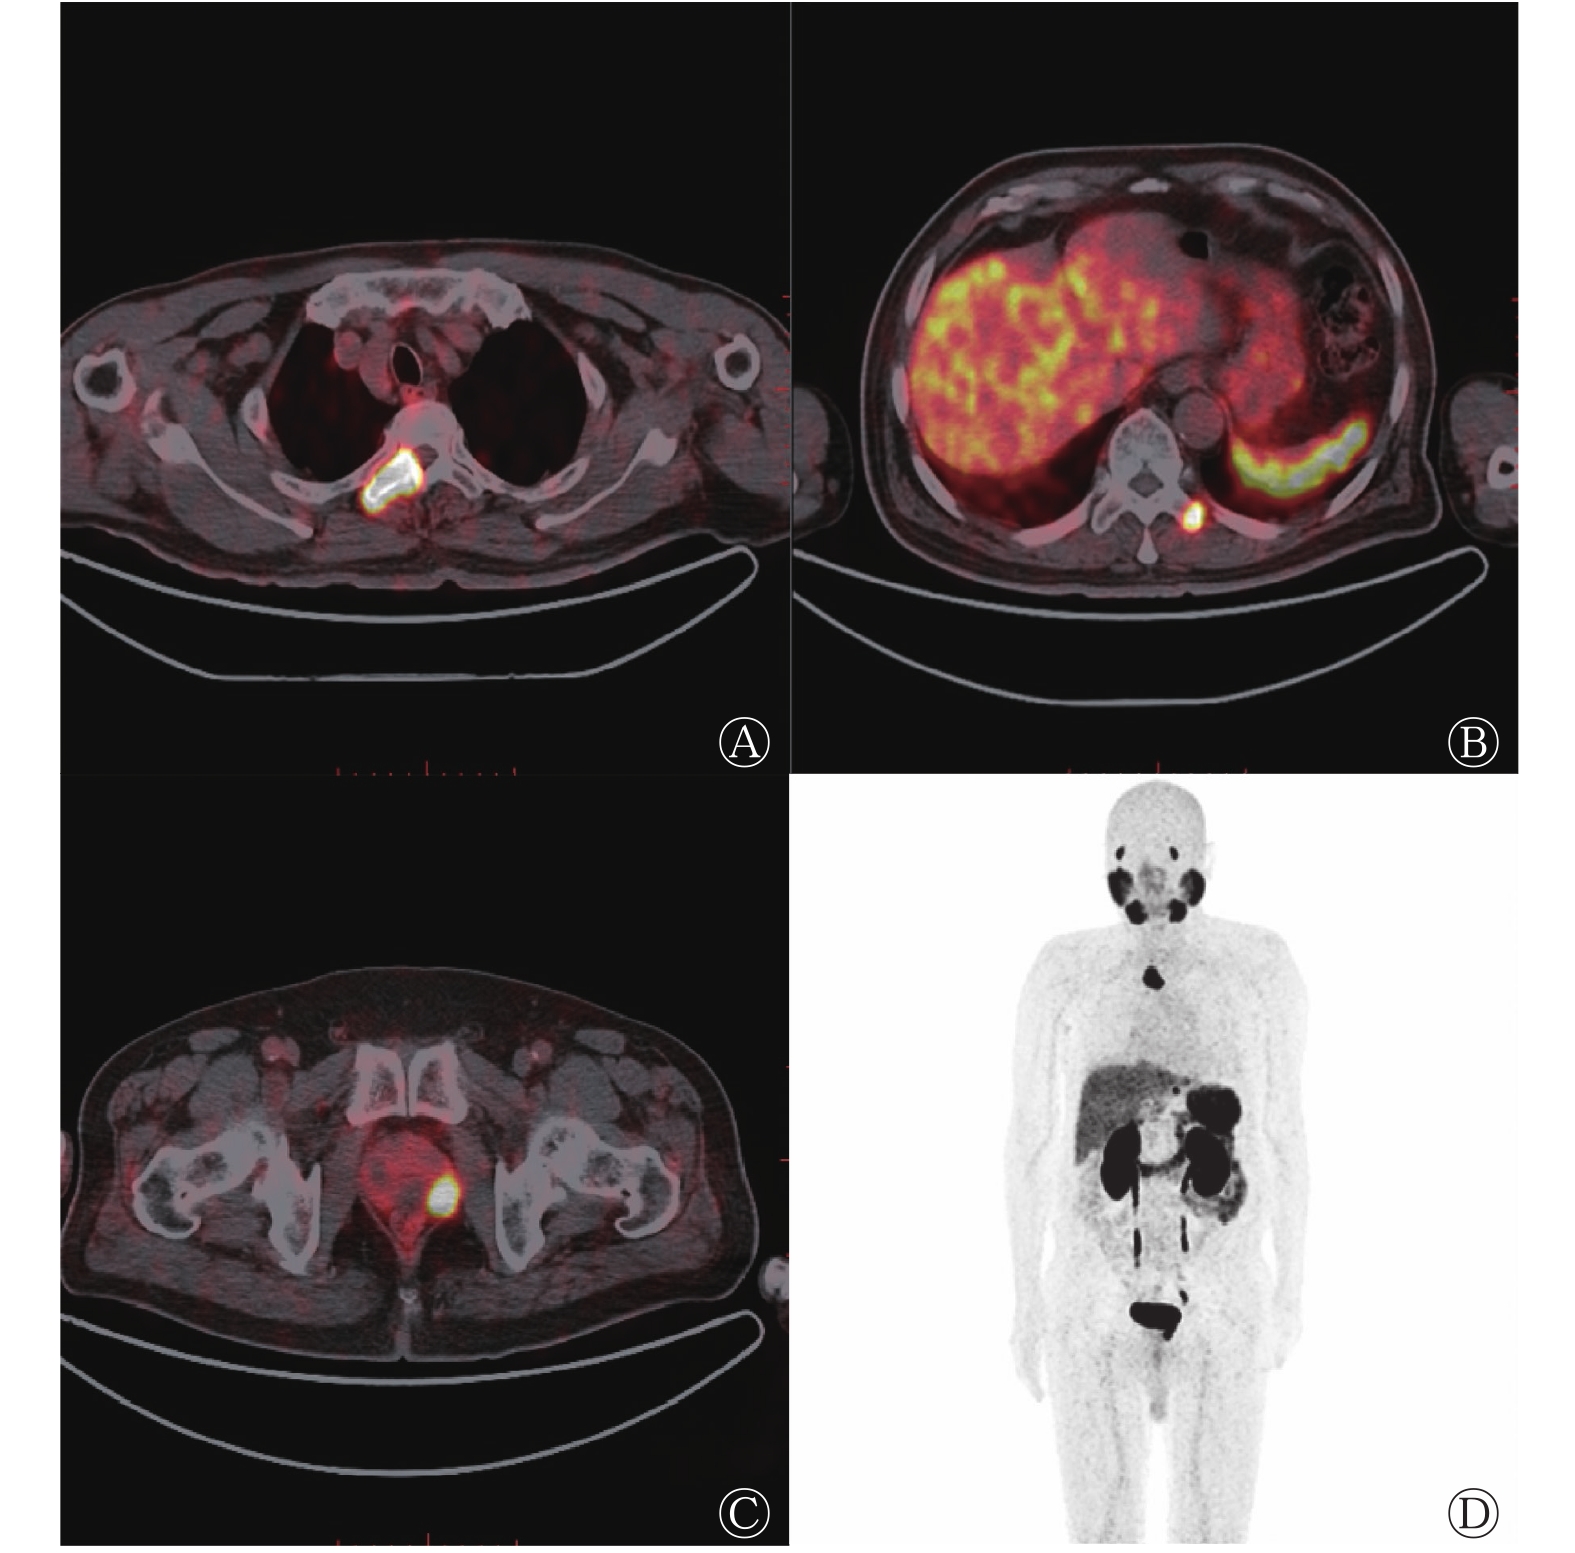
图 3 前列腺癌高风险寡转移患者的多发胸椎及附件68Ga-PSMA-11 PET/CT横断面显像图(A、B)、前列腺横断面融合图(C)及最大密度投影图(D)
Figure 3. 68Ga-prostate specific membrane antigen-11 PET/CT images of thoracic vertebrae and accessories with 2 metastases (A, B), transverse image of prostate (C) and maximum density projection image (D) in high risk oligometastatic patient with prostate carcinoma
-
肿瘤负荷的评估受肿瘤分布、形状、功能和肿瘤病灶内坏死组织等多种因素的影响,手术标本体积并不能完全反映肿瘤活性成分的多寡及异质性。常规影像学检查难以精准评估多发转移性PCa患者的全身肿瘤负荷。由于丧失了根治性切除手术的机会,多发转移性PCa的治疗手段以内分泌治疗、化疗、体内外照射治疗等综合治疗为主,而全身肿瘤负荷与疗效评估、生存时间等密切相关。由此可见,评价肿瘤负荷对于指导临床决策很有意义。
PSA是临床上反映PCa肿瘤负荷和进展最常用的血清标志物,血清PSA水平与肿瘤负荷存在一定的相关性,这与临床经验一致,之前的研究也支持该结论[5],但是单纯依靠血清PSA水平评估肿瘤负荷的准确性欠佳。PCa细胞膜上的PSMA表达水平增加,而68Ga-PSMA-11与PSMA的高亲和力是进行靶向68Ga-PSMA-11 PET/CT显像的分子基础[6]。多项研究结果证实,68Ga-PSMA-11 PET/CT的诊断效能优于常规影像学检查,其摄取参数与PSA、GS显著相关。Basha等[7]对173例初诊为PCa患者的前瞻性研究结果显示,68Ga-PSMA-11 PET/CT诊断的灵敏度高达96%。Meyrick等[8]在一项纳入70例PCa患者的研究中发现,在PSA<5 ng/mL、5 ng/mL≤PSA≤10 ng/mL、PSA>10 ng/mL时,68Ga-PSMA-11 PET/CT的检出率分别为73%、90%、97%。Uprimny等[9]对90例确诊为PCa的患者进行回顾性研究,结果显示,GS为6分、7分、8~10分3个组的原发灶SUVmax中位数分别为5.9、8.3、8.2;PSA>10.0 ng/mL组的原发肿瘤SUVmax高于PSA≤10.0 ng/mL组(中位数分别为17.6、7.7)。Ergül等[10]通过68Ga-PSMA-11 PET/CT对78例PCa患者进行初次分期研究,结果显示,PSA与原发灶SUVmax呈中度相关(r=0.57),而GS与原发灶SUVmax呈弱相关(r=0.28);GS为6~7分和8~10分的组间比较,原发灶SUVmax的中位数差异有统计学意义(P=0.003);PSA<10 ng/mL、10 ng/mL≤PSA≤20 ng/mL、PSA>20 ng/mL的3个组间比较,SUVmax的中位数差异有统计学意义(P=0.009);无转移和转移亚组间比较,SUVmax的中位数差异亦有统计学意义(P=0.003)。但是目前对初诊PCa患者全身肿瘤负荷在不同GS、PSA组间差异的研究较少。
Schmuck等[11]回顾性分析了101例根治术后复发的PCa患者68Ga-PSMA-11 PET/CT的代谢体积参数,结果显示PSA与PSMA-TV全身和TL-PSMA全身均呈显著相关(r=0.48、0.52),但与SUVmax和SUVmean不相关;这表明,相比SUVmax,PSMA-TV和TL-PSMA能更好地评估PCa根治术后的复发和转移。Schmidkonz等[12]对142例生化复发PCa患者共641个68Ga-PSMA-11 PET/CT阳性病灶的研究结果表明,PSMA-TV、TL-PSMA与血清PSA水平相关,不同GS组间TL-PSMA差异有统计学意义;23例患者治疗(外照射、雄激素剥夺、多西他赛化疗)后出现了PSA水平的降低,其中TL-PSMA随PSA水平降低的有20例,SUVmax随PSA水平降低的有17例,在反映PSA水平的降低程度方面,TL-PSMA和SUVmax比CT测量的病灶大小更优。应用18F-NaF PET/CT量化PCa患者肿瘤负荷的研究也得出类似的结果[13]。我国的研究数据也支持上述结论,Liu等[14]对68Ga-PSMA-617 PET/CT代谢体积参数的研究结果表明:以PSMA-TV和TL-PSMA为核心数据的模型可以预测PCa的转移风险,ROC的AUC分别为0.863和0.848;而SUVmax模型则不能预测该风险。由于68Ga-PSMA-617与68Ga-PSMA-11的药代动力学相似,其结果对68Ga-PSMA-11具有参考价值。无创性的全身影像学检查方法68Ga-PSMA PET/CT的诊断效能优异,且其代谢体积参数能够准确反映肿瘤的恶性程度、分期、肿瘤负荷和侵袭性,在评估PCa的危险分层和转移风险方面具有一定潜力。
本研究在一定程度上规避了先前研究的缺点,纳入研究的都是自然到访且没有经过任何治疗的初诊PCa患者。雄激素剥夺治疗等内分泌治疗会改变肿瘤细胞的PSMA表达[15],从而改变SUVmax临界值和影响代谢体积参数;所以相比于经过治疗的患者,尤其是经内分泌治疗后的患者,初诊患者代谢体积等定量参数更能真实地反映肿瘤行为、分布和侵袭性。von Eyben等[16]的Meta分析(其中6项研究应用68Ga-PSMA PET/CT,1项研究同时应用68Ga-PSMA PET/CT和68Ga-PSMA PET/MRI)结果表明,首次应用68Ga-PSMA PET/CT或68Ga-PSMA PET/MRI进行肿瘤分期时,肿瘤的转移率为24.5%(40/163)。TL-PSMA、PSMA-TV、原发肿瘤SUVmax等参数在不同组间的差异有统计学意义,与之前的多项研究结果一致[10, 17],也符合临床经验和逻辑预期。免疫组化经典研究结果证实,前列腺良性病变上皮细胞虽然也可表达PSMA,但表达水平显著低于PCa细胞,PCa细胞的PSMA高水平表达与较高的GS呈显著相关[18]。上述研究结果证明了原发性PCa中PSMA的过度表达、高SUVmax与晚期肿瘤、高GS和治疗前高PSA水平呈正相关,PSMA过表达是PCa预后不良的危险因素[19]。这些都为本研究提供了强有力的佐证。
本研究的临床意义在于用统计学的方法证实了不同风险分层各组间TL-PSMA全身、原发肿瘤SUVmax的差异有统计学意义。分化差的肿瘤有着更高的摄取、GS和PSMA表达,更强的侵袭性,更多的转移灶及更大的肿瘤负荷。由于放射性核素在肿瘤转移灶内的活度反映了吸收剂量,用于显像的68Ga-PSMA-11、68Ga-PSMA-617是筛选177Lu-PSMA-617治疗潜在受益者的利器,但治疗价值尚需进一步研究确定,以它们为代表的诊疗一体化组合在指导临床、疗效评估和生存预测方面有一定的价值[20]。
本研究为单中心、小样本量的回顾性研究。由于纳入标准严苛,患者数量较少,因此各组间均采用二分类法进行比较分析,没有进行三分类及以上有序亚组的差异研究。对每个转移灶进行活体组织穿刺检查来验证68Ga-PSMA-11 PET/CT的阳性病灶,在实践和伦理上显然是不现实的,因此转移灶的确诊以2名副高级职称医师的共同诊断为准。本研究采用阈值法计算得到的PSMA-TV和TL-PSMA难免存在系统误差,尚未对其他阈值进行尝试探索。总而言之,初诊为PCa的患者68Ga-PSMA-11 PET/CT代谢体积参数在不同风险分层的各组之间的差异有统计学意义,转移组和高风险组的初诊PCa患者,其原发灶摄取和全身肿瘤负荷更高。68Ga-PSMA-11 PET/CT代谢体积参数在指导临床对初诊PCa患者的风险分层方面有一定应用价值。
利益冲突 本研究由署名作者按以下贡献声明独立开展,不涉及任何利益冲突。
作者贡献声明 温健男负责命题的提出、文献的查阅、数据的测量与分析、论文的设计与撰写;杨亲亲负责论文的设计、审阅与撰写;程超负责论文的设计、审阅与修改;左长京负责命题的提出、论文的设计、审阅和最终版本的修改。
68Ga-PSMA-11 PET/CT代谢体积参数在不同风险分层的初诊前列腺癌患者中的差异研究
Study on the differences of metabolic volume parameters of 68Ga-PSMA-11 PET/CT among risk stratified subgroups in patients with newly diagnosed prostate carcinoma
-
摘要:
目的 探究68Ga-前列腺特异性膜抗原(PSMA)-11 PET/CT代谢体积参数在不同风险分层的初诊前列腺癌(PCa)患者中的差异。 方法 回顾性分析2019年1月至12月于海军军区大学第一附属医院经前列腺活体组织穿刺检查结果确诊后行68Ga-PSMA-11 PET/CT检查的85例未经治疗的PCa患者的影像及临床资料,患者年龄49~88(69.1±7.7)岁。根据是否发生肿瘤转移和美国国立综合癌症网络指南推荐的风险分层将患者分别分为无转移组和转移组、低中风险组和高风险组;以格里森评分(GS)8分为临界值,将患者分为GS<8分组和GS≥ 8分组;以血清前列腺特异抗原(PSA)20 ng/mL为临界值,将患者分为PSA≤20 ng/mL组和PSA>20 ng/mL组;根据临床分期的不同,将患者分为临床T1~T2期组和临床T3~T4期组。采用三维勾画法在68Ga-PMSA-11 PET/CT图像上自动测量和勾画肿瘤病灶感兴趣区,计算最大标准化摄取值(SUVmax)、原发PSMA肿瘤体积(PSMA-TV原发)、全身PSMA肿瘤体积(PSMA-TV全身)、原发PSMA肿瘤总量(TL-PSMA原发)、全身PSMA肿瘤总量(TL-PSMA全身)。组间代谢体积参数的比较采用两独立样本非参数Mann-Whitney秩和检验。 结果 85例患者68Ga-PSMA-11 PET/CT显像结果均呈阳性,其中无转移组46例(54.1%)、转移组39例(45.9%);低中风险组15例(17.6%)、高风险组70例(82.4%)。转移组的SUVmax、PSMA-TV原发、PSMA-TV全身、TL-PSMA原发、TL-PSMA全身的中位数均高于无转移组(16.2对9.8,39.5 cm3对10.8 cm3,58.8 cm3对10.8 cm3,318.4 cm3对37.2 cm3,628.0 cm3对37.2 cm3),且差异均有统计学意义(Z=−6.301~−2.580,均P<0.05);高风险组的SUVmax、PSMA-TV原发、PSMA-TV全身、TL-PSMA原发、TL-PSMA全身的中位数均高于低中风险组(13.8对4.2,16.5 cm3对8.4 cm3,21.9 cm3对11.4 cm3,146.1 cm3对27.4 cm3,229.6 cm3对28.6 cm3),且差异均有统计学意义(Z=−4.242~−2.438,均P<0.05);GS≥8分组的SUVmax、PSMA-TV原发、PSMA-TV全身、TL-PSMA原发、TL-PSMA全身的中位数均高于GS<8分组(14.8对9.9,16.5 cm3对12.5 cm3,23.9 cm3对14.3 cm3,146.1 cm3对36.3 cm3,229.6 cm3对36.3 cm3),除PSMA-TV原发外,差异均有统计学意义(Z=−2.850~−2.074,均P<0.05);PSA>20 ng/mL组的SUVmax、PSMA-TV原发、PSMA-TV全身、TL-PSMA原发、TL-PSMA全身的中位数均高于PSA≤20 ng/mL组(16.2对 6.4,24.7 cm3对8.2 cm3,41.4 cm3对10.2 cm3,253.9 cm3对28.0 cm3,361.5 cm3对29.7 cm3),且差异均有统计学意义(Z=−6.279~−3.948,均P<0.001);临床T3~T4期组的SUVmax、PSMA-TV原发、PSMA-TV全身、TL-PSMA原发、TL-PSMA全身的中位数均高于临床T1~T2期组(16.6对9.3,34.9 cm3对10.7 cm3,62.3 cm3对14.3 cm3,303.5 cm3对32.6 cm3,482.1 cm3对45.9 cm3),且差异均有统计学意义(Z=−4.889~−3.629,均P<0.001)。 结论 转移组和高风险组的初诊前列腺癌患者68Ga-PSMA-11 PET/CT的代谢体积参数显著高于无转移组及低中风险组患者。 -
关键词:
- 前列腺肿瘤 /
- 正电子发射断层显像术 /
- 体层摄影术,X线计算机 /
- 肿瘤负荷 /
- 前列腺特异性膜抗原 /
- 风险分层 /
- 代谢体积参数
Abstract:Objective To explore significant differences in the metabolic volume parameters of prostate specific membrane antigen labeled with 68Gallium (68Ga-PSMA-11) PET/CT among different risk stratification subgroups in patients with newly diagnosed prostate carcinoma (PCa). Methods The images and clinical data of 85 untreated patients with PCa (aged 49–88 (69.1±7.7) years) newly diagnosed by prostate biopsy and examined by 68Ga-PSMA-11 PET/CT in the First Affiliated Hospital of Naval Military Medical University from January 2019 to December 2019 were analyzed retrospectively. In accordance with the occurrence of tumor metastasis and the risk stratification recommended by the guidelines of National Comprehensive Cancer Network, patients were divided into binary subgroups: non-metastasis and metastasis subgroups as well as low-medium- and high-risk subgroups. Taking the Gleason score (GS)=8 as the critical value, patients were divided into GS<8 and GS≥8 subgroups. Taking serum prostate specific antigen (PSA)=20 ng/mL as the critical value, patients were divided into PSA≤20 ng/mL and PSA>20 ng/mL subgroups. In accordance with clinical stage, patients were divided into clinical T1–T2 and T3–T4 subgroups. Three dimensional sketching method was used to automatically measure and sketch the region of interest of tumor lesions on 68Ga-PSMA-11 PET/CT images, and calculate the maximum standardized uptake value (SUVmax), primary PSMA tumor volume (PSMA-TVprimary), whole-body PSMA tumor volume (PSMA-TVwhole body), total number of primary PSMA tumors (TL-PSMAprimary), and total number of whole-body PSMA tumors (TL-PSMAwhole body) separately. The metabolic volume parameters between subgroups were compared by the nonparametric Mann-Whitney U rank sum test of two independent samples. Results The results of 68Ga-PSMA-11 PET/CT were positive in all 85 patients, including 46 cases (54.1%) in the non-metastasis subgroup and 39 cases (45.9%) in the metastasis subgroup as well as 15 cases (17.6%) in the low-medium-risk subgroup and 70 cases (82.4%) in the high-risk subgroup. The SUVmax, PSMA-TVprimary, PSMA-TVwhole body, TL-PSMAprimary, and TL-PSMAwhole body in the metastasis subgroup were significantly higher than those in the non-metastasis subgroup (16.2 vs. 9.8, 39.5 cm3 vs. 10.8 cm3, 58.8 cm3 vs. 10.8 cm3, 318.4 cm3 vs. 37.2 cm3, 628.0 cm3 vs. 37.2 cm3; Z=−6.301 to −2.580, all P<0.05). The SUVmax, PSMA-TVprimary, PSMA-TVwhole body, TL-PSMAprimary, and TL-PSMAwhole body in the high-risk subgroup were significantly higher than those in the low-medium-risk subgroup (13.8 vs. 4.2, 16.5 cm3 vs. 8.4 cm3, 21.9 cm3 vs. 11.4 cm3, 146.1 cm3 vs. 27.4 cm3, 229.6 cm3 vs. 28.6 cm3; Z=−4.242 to −2.438, all P<0.05). The SUVmax, PSMA-TVwhole body, TL-PSMAprimary, and TL-PSMAwhole body in the GS≥8 subgroup were significantly higher than those in the GS<8 subgroup (14.8 vs. 9.9, 23.9 cm3 vs. 14.3 cm3, 146.1 cm3 vs. 36.3 cm3, 229.6 cm3 vs. 36.3 cm3; Z=−2.850 to −2.074, all P<0.05), whereas the PSMA-TVprimary was not significantly different between the two subgroups (16.5 cm3 vs. 12.5 cm3, Z=−1.231, P=0.218). The SUVmax, PSMA-TVprimary, PSMA-TVwhole body, TL-PSMAprimary, and TL-PSMAwhole body in the PSA>20 ng/mL subgroup were significantly higher than those in the PSA≤20 ng/mL subgroup (16.2 vs. 6.4, 24.7 cm3 vs. 8.2 cm3, 41.4 cm3 vs. 10.2 cm3, 253.9 cm3 vs. 28.0 cm3, 361.5 cm3 vs. 29.7 cm3; Z=−6.279 to −3.948, all P<0.001). The SUVmax, PSMA-TVprimary, PSMA-TVwhole body, TL-PSMAprimary, and TL-PSMAwhole body in the clinical T3–T4 subgroup were significantly higher than those in the clinical T1–T2 subgroup (16.6 vs. 9.3, 34.9 cm3 vs. 10.7 cm3, 62.3 cm3 vs. 14.3 cm3, 303.5 cm3 vs. 32.6 cm3, 482.1 cm3 vs. 45.9 cm3; Z=−4.889 to −3.629, all P<0.001). Conclusion The metabolic volume parameters based on 68Ga-PSMA-11 PET/CT in metastatic and high-risk patients with newly diagnosed PCa were significantly higher than those in non-metastatic and low-medium-risk patients. -
图 1 前列腺癌中低风险无转移患者的前列腺68Ga-PSMA-11 PET/CT横断面显像图(A)及最大密度投影图(B)
Figure 1. 68Ga-prostate specific membrane antigen-11 PET/CT transverse image of prostate (A) and maximum density projection image (B) in low risk and non-metastatic patient with prostate carcinoma
图 4 前列腺癌高风险多发转移患者的胸、骶椎及附件68Ga-PSMA-11 PET/CT横断面显像图(A、B)、前列腺横断面融合图(C)及最大密度投影图(D)
Figure 4. 68Ga-prostate specific membrane antigen-11 PET/CT images of thoracic, sacral vertebrae and accessories with multiple metastases (A, B), transverse images of prostate (C) and maximum density projection image (D) in high risk patient with multiple metastases of prostate carcinoma
图 2 前列腺癌高风险无转移患者的前列腺68Ga-PSMA-11 PET/CT横断面显像图(A)及最大密度投影图(B)
Figure 2. 68Ga-prostate specific membrane antigen-11 PET/CT transverse image of prostate (A) and maximum density projection image (B) in high risk non-metastatic patient with prostate carcinoma
图 3 前列腺癌高风险寡转移患者的多发胸椎及附件68Ga-PSMA-11 PET/CT横断面显像图(A、B)、前列腺横断面融合图(C)及最大密度投影图(D)
Figure 3. 68Ga-prostate specific membrane antigen-11 PET/CT images of thoracic vertebrae and accessories with 2 metastases (A, B), transverse image of prostate (C) and maximum density projection image (D) in high risk oligometastatic patient with prostate carcinoma
表 1 85例PCa患者的临床特征与68Ga-PSMA-11 PET/CT 显像的结果
Table 1. Clinical characteristics and 68Ga-prostate specific membrane antigen-11 PET/CT findings of 85 prostate carcinoma patients
参数 无转移组(n=46) 转移组(n=39) 年龄( $ \bar x \pm s$ 69.1±7.2 69.2±8.5 GS(例) 6分 6 1 7分 16 10 8分 13 14 9分 10 11 10分 1 3 PSA(例) ≤20 ng/mL 29 5 >20 ng/mL 17 34 T分期(例) T2a 19 1 T2b 5 5 T2c 14 9 T3a 1 1 T3b 7 12 T4 0 11 风险分层(例) 低中风险 13 2 高风险 33 37 注:PSMA为前列腺特异性膜抗原;PET/CT为正电子发射断层显像计算机体层摄影术;PCa为前列腺癌;GS为格里森评分;PSA为前列腺特异抗原  下载: 导出CSV
表 2 不同风险分层的PCa患者68Ga-PSMA-11 PET/CT代谢体积参数的差异比较[中位数(范围)]
Table 2. Comparison of metabolic volume parameters of 68Ga-prostate specific membrane antigen-11 PET/CT in prostate carcinoma patients with different risk stratification (median (range))
组别 SUVmax PSMA-TV原发(cm3) PSMA-TV全身(cm3) TL-PSMA原发(cm3) TL-PSMA全身(cm3) 低中风险组(n=15) 4.2(2.2~21.9) 8.4(1.6~22.4) 11.4(1.6~22.4) 27.4(3.2~86.3) 28.6(3.2~86.3) 高风险组(n=70) 13.8(2.3~50.5) 16.5(1.5~218.4) 21.9(1.7~333.9) 146.1(5.1~3822.0) 229.6(5.3~4510.4) Z值 −3.449 −2.438 −3.009 −3.631 −4.242 P值 <0.001 0.015 0.003 <0.001 <0.001 注:PCa为前列腺癌;PSMA为前列腺特异性膜抗原;PET/CT为正电子发射断层显像计算机体层摄影术;SUVmax为最大标准化摄取值;TV为肿瘤体积;TL为肿瘤总量
下载: 导出CSV
表 3 不同转移情况的PCa患者68Ga-PSMA-11 PET/CT代谢体积参数的差异比较[中位数(范围)]
Table 3. Comparison of metabolic volume parameters of 68Ga-prostate specific membrane antigen-11 PET/CT in prostate carcinoma patients with different metastasis (median (range))
组别 SUVmax PSMA-TV原发(cm3) PSMA-TV全身(cm3) TL-PSMA原发(cm3) TL-PSMA全身(cm3) 无转移组(n=46) 9.8(2.2~50.5) 10.8(1.6~58.3) 10.8(1.6~58.3) 37.2(3.2~399.3) 37.2(3.2~399.3) 转移组(n=39) 16.2(2.9~40.0) 39.5(1.5~218.4) 58.8(3.5~333.9) 318.4(5.1~3822.0) 628.0(14.7~4510.4) Z值 −2.580 −4.070 −6.301 −4.022 −5.900 P值 0.010 <0.001 <0.001 <0.001 <0.001 注:PCa为前列腺癌;PSMA为前列腺特异性膜抗原;PET/CT为正电子发射断层显像计算机体层摄影术;SUVmax为最大标准化摄取值;TV为肿瘤体积;TL为肿瘤总量
下载: 导出CSV
表 4 不同GS评分的PCa患者68Ga-PSMA-11 PET/CT代谢体积参数的差异比较[中位数(范围)]
Table 4. Comparison of metabolic volume parameters of 68Ga-prostate specific membrane antigen-11 PET/CT in prostate carcinoma patients with different GSs (median (range))
组别 SUVmax PSMA-TV原发(cm3) PSMA-TV全身(cm3) TL-PSMA原发(cm3) TL-PSMA全身(cm3) GS<8分组(n=33) 9.9(2.2~26.9) 12.5(1.6~76.4) 14.3(1.6~133.9) 36.3(3.2~1084.9) 36.3(3.2~1573.9) GS≥8分组(n=52) 14.8(2.3~50.5) 16.5(1.5~218.4) 23.9(1.7~333.9) 146.1(5.1~3822.0) 229.6(5.3~4510.4) Z值 −2.390 −1.231 −2.088 −2.074 −2.850 P值 0.017 0.218 0.037 0.038 0.004 注:GS为格里森评分;PCa为前列腺癌;PSMA为前列腺特异性膜抗原;PET/CT为正电子发射断层显像计算机体层摄影术;SUVmax为最大标准化摄取值;TV为肿瘤体积;TL为肿瘤总量
下载: 导出CSV
表 6 不同临床T分期的PCa患者68Ga-PSMA-11 PET/CT代谢体积参数的差异比较[中位数(范围)]
Table 6. Comparison of metabolic volume parameters of 68Ga-prostate specific membrane antigen-11 PET/CT in prostate carcinoma patients at different clinical T stages (median (range))
组别 SUVmax PSMA-TV原发(cm3) PSMA-TV全身(cm3) TL-PSMA原发(cm3) TL-PSMA全身(cm3) 临床T1~T2分期组(n=53) 9.3(2.2~31.1) 10.7(1.5~218.4) 14.3(1.6~302.2) 32.6(3.2~3288.0) 45.9(3.2~4510.4) 临床T3~T4分期组(n=32) 16.6(3.1~50.5) 34.9(1.9~160.7) 62.3(2.7~333.9) 303.5(9.5~2187.7) 482.1(14.7~2738.8) Z值 −3.629 −3.792 −4.077 −4.508 −4.889 P值 <0.001 <0.001 <0.001 <0.001 <0.001 注:PCa为前列腺癌;PSMA为前列腺特异性膜抗原;PET/CT为正电子发射断层显像计算机体层摄影术;SUVmax为最大标准化摄取值;TV为肿瘤体积;TL为肿瘤总量
下载: 导出CSV
表 5 不同PSA水平的PCa患者68Ga-PSMA-11 PET/CT代谢体积参数的差异比较[中位数(范围)]
Table 5. Comparison of metabolic volume parameters of 68Ga-prostate specific membrane antigen-11 PET/CT in prostate carcinoma patients with different PSA levels (median (range))
组别 SUVmax PSMA-TV原发(cm3) PSMA-TV全身(cm3) TL-PSMA原发(cm3) TL-PSMA全身(cm3) PSA≤20 ng/mL组(n=34) 6.4(2.2~50.5) 8.2(1.5~222.4) 10.2(1.6~22.5) 28.0(3.2~318.3) 29.7(3.2~318.3) PSA>20 ng/mL组(n=51) 16.2(2.3~40.0) 24.7(1.7~218.4) 41.4(1.7~333.9) 253.9(7.5~3822.0) 361.5(7.5~4510.4) Z值 −3.948 −5.329 −5.907 −5.544 −6.279 P值 <0.001 <0.001 <0.001 <0.001 <0.001 注:PSA为前列腺特异抗原;PCa为前列腺癌;PSMA为前列腺特异性膜抗原;PET/CT为正电子发射断层显像计算机体层摄影术;SUVmax为最大标准化摄取值;TV为肿瘤体积;TL为肿瘤总量
下载: 导出CSV
-
[1] Hyuna Sung, Jacques Ferlay, Rebecca L Siegel, et al. Global cancer statistics 2020: GLOBOCAN estimates of incidence and mortality worldwide for 36 cancers in 185 countries[J]. CA Cancer J Clin, 2021, 71: 209−249. DOI: 10.3322/caac.21660. [2] 叶定伟, 朱耀. 中国前列腺癌的流行病学概述和启示[J]. 中华外科杂志, 2015, 53(4): 249−252. DOI: 10.3760/cma.j.issn.0529-5815.2015.04.003.
Ye DW, Zhu Y. Epidemiology of prostate cancer in China: an overview and clinical implication[J]. Chin J Surg, 2015, 53(4): 249−252. DOI: 10.3760/cma.j.issn.0529-5815.2015.04.003.[3] Mohler JL, Antonarakis ES, Armstrong AJ, et al. Prostate cancer, version 2.2019, NCCN clinical practice guidelines in oncology[J]. J Natl Compr Canc Netw, 2019, 17(5): 479−505. DOI: 10.6004/jnccn.2019.0023. [4] Satapathy S, Singh H, Kumar R, et al. Diagnostic accuracy of 68Ga-PSMA PET/CT for initial detection in patients with suspected prostate cancer: a systematic review and meta-analysis[J]. AJR Am J Roentgenol, 2021, 216(3): 599−607. DOI: 10.2214/AJR.20.23912. [5] Brito AET, Mourato FA, de Oliveira RPM, et al. Evaluation of whole-body tumor burden with 68Ga-PSMA PET/CT in the biochemical recurrence of prostate cancer[J]. Ann Nucl Med, 2019, 33(5): 344−350. DOI: 10.1007/s12149-019-01342-z. [6] Demirci E, Kabasakal L, Şahin OE, et al. Can SUVmax values of Ga-68-PSMA PET/CT scan predict the clinically significant prostate cancer?[J]. Nucl Med Commun, 2019, 40(1): 86−91. DOI: 10.1097/MNM.0000000000000942. [7] Basha MAA, Hamed MAG, Hussein O, et al. 68Ga-PSMA-11 PET/CT in newly diagnosed prostate cancer: diagnostic sensitivity and interobserver agreement[J]. Abdom Radiol (NY), 2019, 44(7): 2545−2556. DOI: 10.1007/s00261-019-02006-2. [8] Meyrick DP, Asokendaran M, Skelly LA, et al. The role of 68Ga-PSMA-I&T PET/CT in the pretreatment staging of primary prostate cancer[J]. Nucl Med Commun, 2017, 38(11): 956−963. DOI: 10.1097/MNM.0000000000000738. [9] Uprimny C, Kroiss AS, Decristoforo C, et al. 68Ga-PSMA-11 PET/CT in primary staging of prostate cancer: PSA and Gleason score predict the intensity of tracer accumulation in the primary tumour[J]. Eur J Nucl Med Mol Imaging, 2017, 44(6): 941−949. DOI: 10.1007/s00259-017-3631-6. [10] Ergül N, Burçak YG, Yücetaş U, et al. 68Ga-PSMA-11 PET/CT in newly diagnosed prostate adenocarcinoma[J]. Clin Nucl Med, 2018, 43(12): e422−e427. DOI: 10.1097/RLU.0000000000002289. [11] Schmuck S, von Klot CA, Henkenberens C, et al. Initial experience with volumetric 68Ga-PSMA I&T PET/CT for assessment of whole-body tumor burden as a quantitative imaging biomarker in patients with prostate cancer[J]. J Nucl Med, 2017, 58(12): 1962−1968. DOI: 10.2967/jnumed.117.193581. [12] Schmidkonz C, Cordes M, Schmidt D, et al. 68Ga-PSMA-11 PET/CT-derived metabolic parameters for determination of whole-body tumor burden and treatment response in prostate cancer[J]. Eur J Nucl Med Mol Imaging, 2018, 45(11): 1862−1872. DOI: 10.1007/s00259-018-4042-z. [13] Etchebehere EC, Araujo JC, Fox PS, et al. Prognostic factors in patients treated with 223Ra: the role of skeletal tumor burden on baseline 18F-fluoride PET/CT in predicting overall survival[J]. J Nucl Med, 2015, 56(8): 1177−1184. DOI: 10.2967/jnumed.115.158626. [14] Liu C, Liu TL, Zhang N, et al. 68Ga-PSMA-617 PET/CT: a promising new technique for predicting risk stratification and metastatic risk of prostate cancer patients[J]. Eur J Nucl Med Mol Imaging, 2018, 45(11): 1852−1861. DOI: 10.1007/s00259-018-4037-9. [15] Kuroda K, He L. The proteasome inhibitor, bortezomib, induces prostate cancer cell death by suppressing the expression of prostate-specific membrane antigen, as well as androgen receptor[J]. Int J Oncol, 2019, 54(4): 1357−1366. DOI: 10.3892/ijo.2019.4706. [16] von Eyben FE, Picchio M, von Eyben R, et al. 68Ga-labeled prostate-specific membrane antigen ligand positron emission tomography/computed tomography for prostate cancer: a systematic review and meta-analysis[J/OL]. Eur Urol Focus, 2018, 4(5): 686−693[2020-09-01]. https://www.eu-focus.europeanurology.com/article/S2405-4569(16)30160-2/fulltext. DOI: 10.1016/j.euf.2016.11.002. [17] Koerber SA, Utzinger MT, Kratochwil C, et al. 68Ga-PSMA-11 PET/CT in newly diagnosed carcinoma of the prostate: correlation of intraprostatic PSMA uptake with several clinical parameters[J]. J Nucl Med, 2017, 58(12): 1943−1948. DOI: 10.2967/jnumed.117.190314. [18] Ruigrok EAM, van Weerden WM, Nonnekens J, et al. The future of PSMA-targeted radionuclide therapy: an overview of recent preclinical research[J/OL]. Pharmaceutics, 2019, 11(11): 560[2020-09-01]. https://www.mdpi.com/1999-4923/11/11/560. DOI: 10.3390/pharmaceutics11110560. [19] Schollhammer R, De Clermont Gallerande H, Yacoub M, et al. Comparison of the radiolabeled PSMA-inhibitor 111In-PSMA-617 and the radiolabeled GRP-R antagonist 111In-RM2 in primary prostate cancer samples[J/OL]. EJNMMI Res, 2019, 9(1): 52[2020-09-01]. https://ejnmmires.springeropen.com/articles/10.1186/s13550-019-0517-6. DOI: 10.1186/s13550-019-0517-6. [20] Fankhauser CD, Poyet C, Kroeze SGC, et al. Current and potential future role of PSMA-PET in patients with castration-resistant prostate cancer[J]. World J Urol, 2019, 37(3): 457−467. DOI: 10.1007/s00345-018-2408-2. -

 点击查看大图
计量
- 文章访问数: 9696
- HTML全文浏览量: 7523
- PDF下载量: 30
