


-
肺空洞是肺内病变组织发生坏死后,经引流支气管排出并吸入气体后形成的占位,常见于肺结核、肺脓肿和肺癌,也可见于转移瘤、真菌感染和韦格纳氏肉芽肿等。肺部单发空洞的影像学特征具有相似性,是影像诊断的难点,也影响临床治疗的策略。医疗设备和软件技术的不断更新可使影像科医师获得更多的细节和信息。18F-FDG PET/CT显像可提供病灶18F-FDG的摄取情况,以此评价肺空洞壁的葡萄糖代谢信息[1]。传统观点认为SUVmax=2.5是区分良恶性占位的临界值[2],但随着研究的深入,研究者们提出了多个区分良恶性占位的SUVmax临界值。薄层螺旋CT能够展示肺空洞壁和空洞腔的解剖细节[3-4],增强CT可以将肺空洞的血供和强化程度进行比较[5]。本研究主要分析和评价鉴别孤立性肺空洞良恶性的SUVmax临界值,并就综合影像分析法和3种影像学方法(PET/CT、薄层螺旋CT和增强CT)单独使用对孤立性肺空洞良恶性的诊断效能进行分析比较,以提高对孤立性肺空洞诊断的效能。
-
回顾性分析2015年10月至2019年10月于厦门大学附属中山医院行18F-FDG PET/CT、薄层螺旋CT和增强CT检查的56例孤立性肺空洞患者的影像资料和临床资料,其中男性43例、女性13例,年龄41~82(54.7±13.4)岁。纳入标准:(1)肺孤立性病灶并伴空洞形成且空洞最大径>5 mm;(2)病历资料完整,均经组织病理学检查确诊或随访时间≥9个月。排除标准:有恶性肿瘤、糖尿病、尘肺病史。肺空洞患者病灶经组织病理学检查确诊41例,经抗结核、抗炎治疗后随访以及痰脱落细胞检查等确诊15例。所有患者均于检查前签署了知情同意书。本研究符合《赫尔辛基宣言》的原则。
-
18F-FDG PET/CT:显像仪器为德国Siemens公司Biograph mCT PET/CT。显像剂为18F-FDG,由南京江源安迪科公司提供,放射化学纯度>98%。检查前嘱患者空腹、禁输含糖液体6 h以上,末梢血糖控制在<10 mmol/L,检查前避免剧烈运动,测量患者的身高和体重。按每千克体重4.44 MBq的剂量静脉注射18F-FDG。注射药物后嘱患者大量饮水并及时排尿,安静休息40~60 min后上机扫描。扫描参数:电压120 kV,电流80~180 mA,扫描层厚5 mm,重建层厚3 mm,扫描范围自颅顶至大腿中段,共6~7个床位,每个床位扫描90 s。
薄层螺旋CT:使用PET/CT自带的CT进行肺部扫描。扫描前进行吸气屏气训练,扫描时嘱患者深吸气后屏气,扫描范围自锁骨至肝下缘。扫描参数:电压120 kV,电流80~180 mA,矩阵512×512,扫描层厚1 mm,重建间隔为0.5 mm。过度通气后肺部CT值低至约−900 HU为理想状态,−800 HU以下为图像可接受。
增强CT:显像仪器为美国GE公司256排Revolution CT。采用触发扫描模式,目标区域ROI内的CT值的触发临界值设定为150 HU,分别进行动脉期和静脉期的采集。造影剂为德国拜耳公司生产的优维显,浓度为300 mg/mL,经患者肘静脉高压注射,注射速度3 mL/s,每例注射70 mL,优维显注射完毕后继续推注生理盐水20 mL,注射速度3 mL/s。扫描参数:电压120 kV,电流80~180 mA,矩阵512×512,扫描层厚2 mm,重建间隔为1 mm,扫描范围自锁骨至肝下缘。
-
由核医学科1名从事PET/CT阅片的副主任医师和放射科1名从事CT阅片的副主任医师分别进行PET/CT阅片和CT阅片。
PET/CT阅片采用定量分析和视觉分析相结合的方法,定量分析为测定肺空洞的 SUVmax,视觉分析为观察肺空洞的代谢高低和代谢分布情况。薄层螺旋CT阅片主要对空洞位置、空洞最大径、空洞壁厚、空洞形态和主要恶性征象(如深分叶征、短毛刺征、棘状突起、胸膜牵拉征、血管集束征、壁结节、气液平面等)进行统计分析。增强CT阅片主要对强化程度、强化形态、强化类型进行统计分析。临床资料分析主要参考患者的临床症状和检验指标(如肿瘤标志物、WBC和肺空洞短期变化情况等)。通过构建和分析ROC曲线,选择鉴别孤立性肺空洞良恶性的SUVmax最佳临界值,计算最佳临界值诊断的灵敏度、特异度、阳性预测值、阴性预测值和准确率,并计算约登指数(约登指数=灵敏度+特异度−1)。
恶性征象包括深分叶征、(短)毛刺征、棘状突起、胸膜牵拉征、血管集束征、壁结节、气液平面等征象;临床资料作为3种影像资料的参考,不作为独立的诊断依据;肿瘤标志物主要包括癌胚抗原、细胞角质素片段抗原、神经元特异性烯醇化酶、糖类抗原125;空洞短期变化表示无论是否经过治疗,病灶在1月内大小变化>10%或形态发生改变。
计算3种影像学方法和综合影像分析法鉴别孤立性肺空洞良恶性的灵敏度、特异度、阳性预测值、阴性预测值和准确率。诊断结果判定:18F-FDG PET/CT、薄层螺旋CT和增强CT的独立诊断结果均参考临床资料;综合影像分析法是对3种影像学方法的诊断结果进行综合评估,2种及以上的影像学方法判定为恶性的病灶,则综合影像分析法判定结果为恶性;临床资料不作为诊断的独立判断依据。
-
应用SPSS 17.0软件进行统计学分析。符合正态分布的计量资料以
$ \bar{x}\pm s $ 表示,方差齐的计量资料的比较采用独立样本t检验。计数资料的比较采用卡方检验。P<0.05为差异有统计学意义。 -
56例孤立性肺空洞患者中,恶性病变39例(69.6%),均为非小细胞肺癌,包括腺癌21例、鳞癌13例、腺鳞癌3例、黏液腺癌2例,均由手术或穿刺活检的组织病理学检查结果证实;良性病变17例(30.4%),包括肺脓肿10例、肺结核5例、真菌感染2例,诊断标准为手术和(或)穿活检的组织病理学检查结果,以及根据不同临床方法治疗后,随访(≥9个月)期间肺空洞缩小或消失。
-
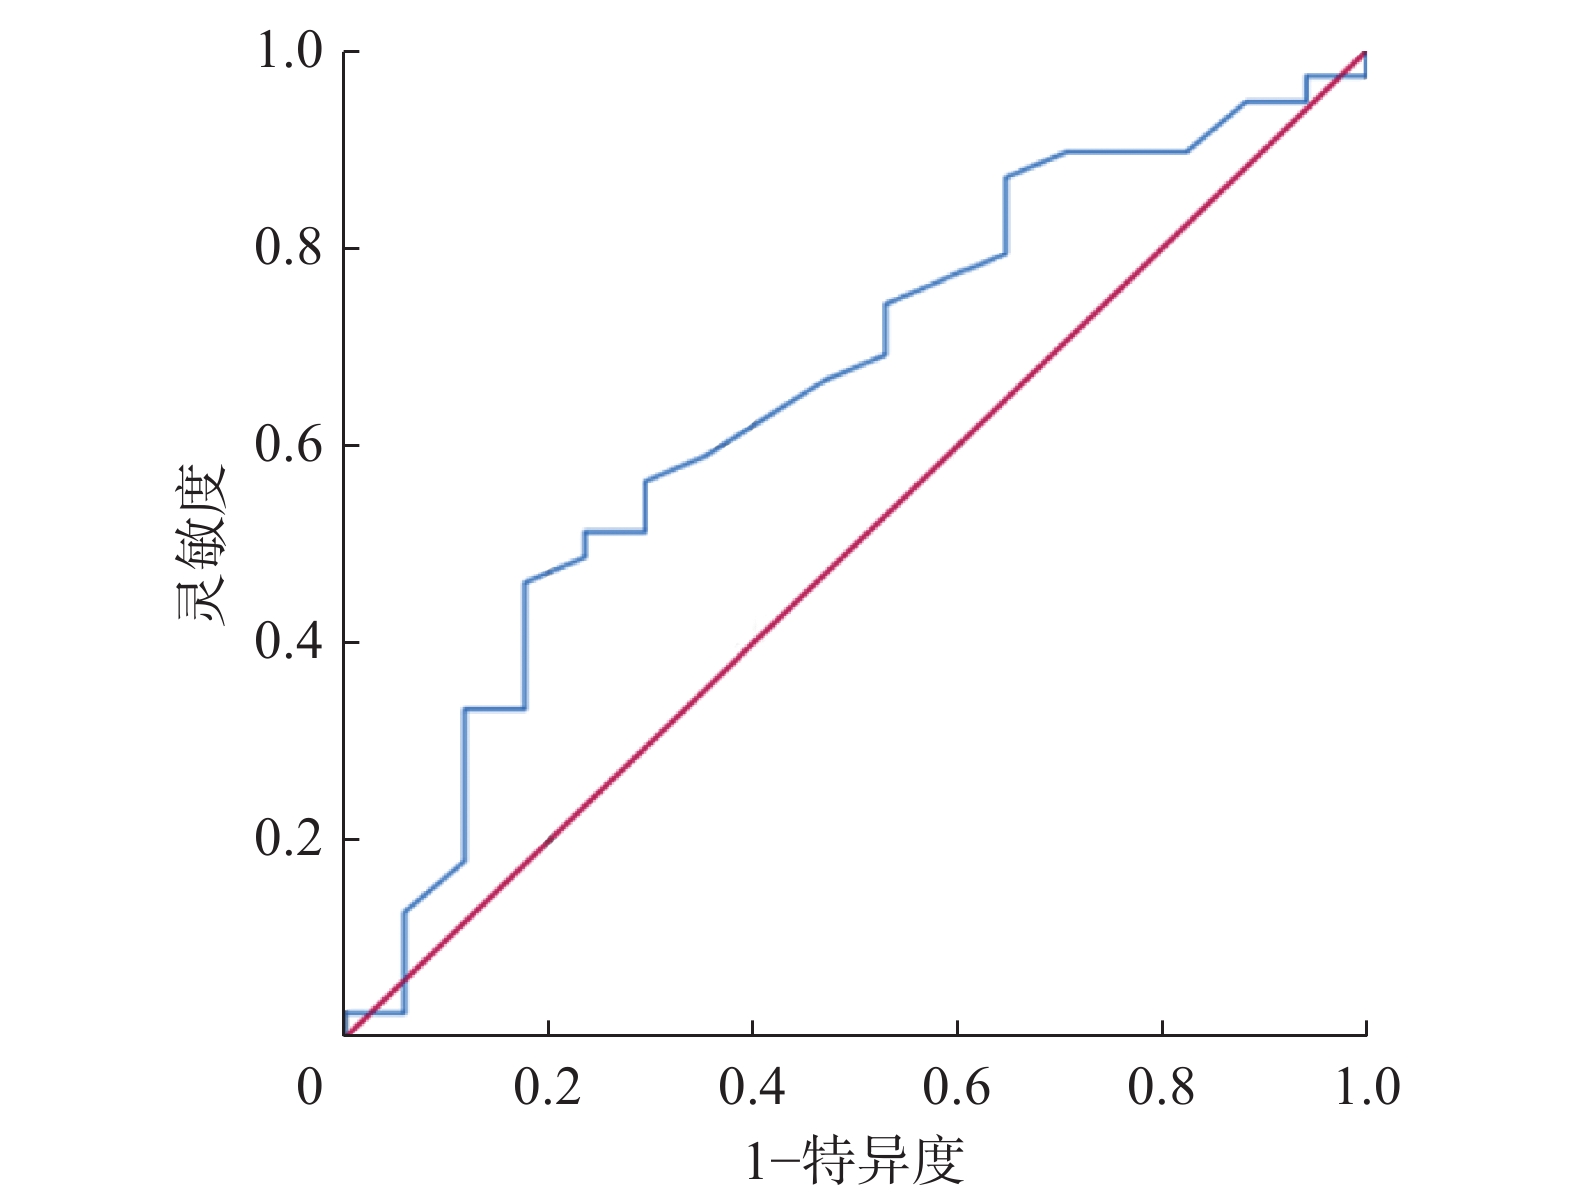
56例孤立性肺空洞患者的SUVmax分布如图1所示。其中恶性空洞的SUVmax=7.04±2.3,良性空洞的SUVmax=5.91±2.17,两者的差异无统计学意义(t=1.714,P=0.092)。ROC曲线分析结果显示,SUVmax的最佳临界值为7.05、约登指数为0.285,AUC为0.652,95%CI:0.494~0.809(图2)。当SUVmax=7.05时,SUVmax对孤立性肺空洞诊断的灵敏度为46.2%(18/39)、特异度为82.4%(14/17)、阳性预测值为85.7%(18/21)、阴性预测值为40.0%(14/35)、准确率为57.1%(32/56)。
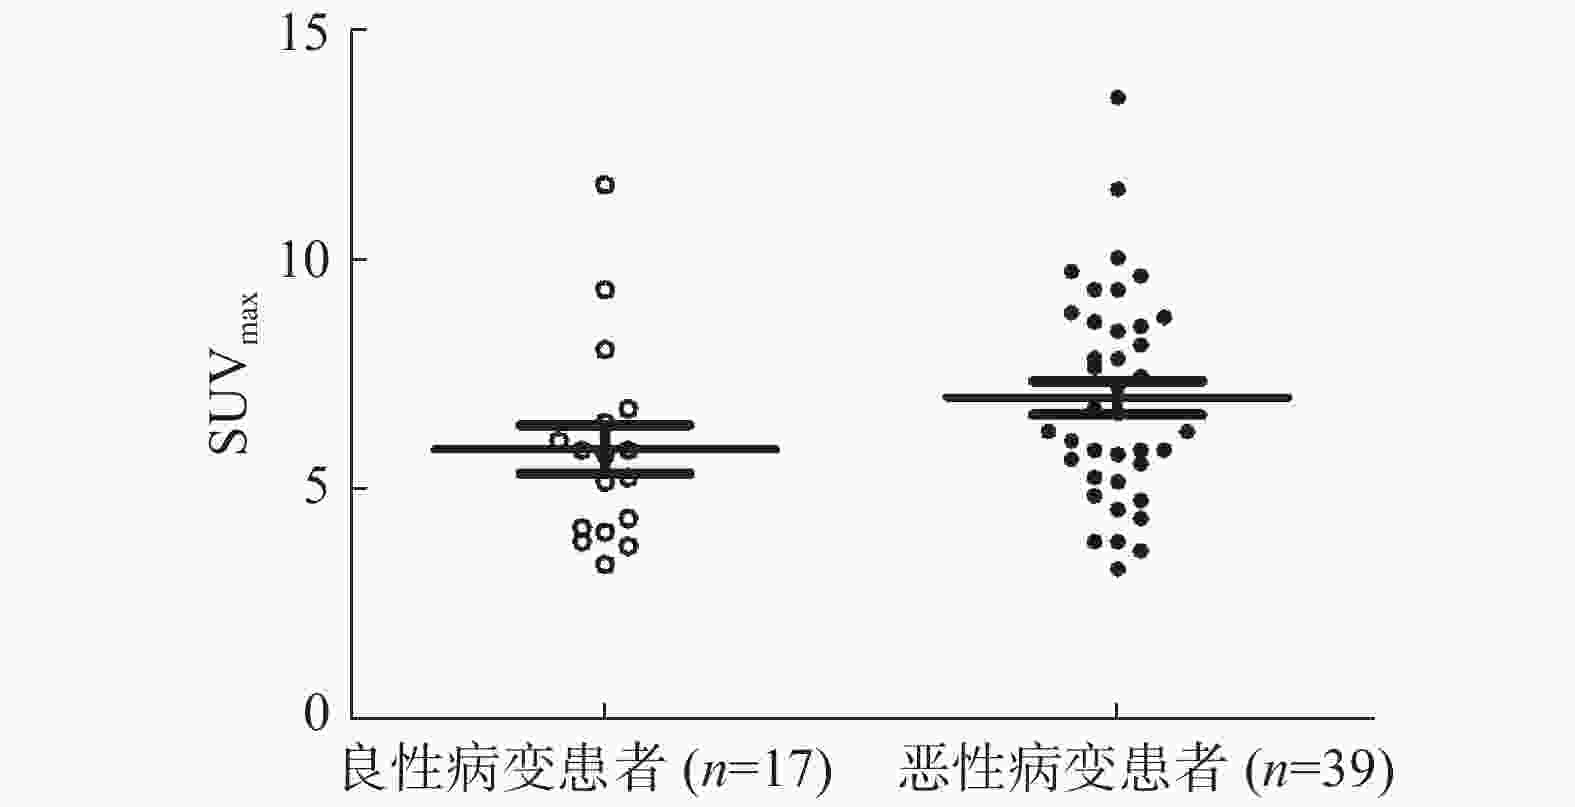
图 1 56例孤立性肺空洞患者良恶性病变SUVmax的分布图SUVmax为最大标准化摄取值
Figure 1. The maximum standardized uptake value distribution of benign and malignant lesions in 56 patients with solitary pulmonary cavity
图 2 鉴别诊断56例孤立性肺空洞患者良恶性病变的最大标准化摄取值临界值的受试者工作特征曲线
Figure 2. Receiver operator characteristic curve of the maximum standardized uptake value critical value for differentiating benign and malignant lesions in 56 patients with solitary pulmonary cavity
-
所有患者的临床资料和不同影像学方法的主要诊断指标与组织病理学检查和随访结果的诊断结果见表1~2。
诊断方法 组织病理学检查或随访结果 χ2值 P值 恶性(n=39) 良性(n=17) 18F-FDG PET/CT 30(76.9) 6(35.3) 8.936 0.003 9(23.1) 11(64.7) 薄层螺旋CT 32(82.1) 11(64.7) 1.144 0.285 7(17.9) 6(35.3) 增强CT 28(71.8) 4(23.5) 11.262 0.001 11(28.2) 13(76.5) 综合影像分析法 37(94.9) 4(23.5) 38.678 <0.001 2(5.1) 13(76.5) 注:综合影像分析法为对18F-FDG PET/CT、薄层螺旋CT、增强CT的诊断结果进行综合评估。FDG为氟脱氧葡萄糖;PET为正电子发射断层显像术;CT为计算机体层摄影术 表 1 不同影像学方法鉴别56例孤立性肺空洞患者良恶性 的诊断结果[例(%)]
Table 1. Differential diagnosis of 56 patients with solitary pulmonary cavity by different imaging methods (case (%))
-
18F-FDG PET/CT、薄层螺旋CT和增强CT诊断孤立性肺空洞的灵敏度、特异度、阳性预测值、阴性预测值和准确率的结果见表2 。以组织病理学检查结果和随访结果为标准,综合影像分析法诊断的灵敏度为94.9%(37/39)、特异度为76.5%(13/17)、阳性预测值为90.2%(37/41)、阴性预测值为86.7%(13/15)、准确率为89.3%(50/56)。
诊断方法 诊断项目 组织病理学检查或随访结果 χ2值 P值 恶性(n=39) 良性(n=17) 18F-FDG PET/CT SUVmax 4.105 0.043 ≥7.05 18(46.2) 3(17.6) < 7.05 21(53.8) 14(82.4) SUV分布 1.352 0.245 不均匀 29(74.4) 10(58.8) 均匀 10(25.6) 7(41.2) 薄层螺旋CT 空洞位置 0.01 0.919 上叶 27(69.2) 12(70.6) 中/下叶 12(30.8) 5(29.4) 空洞直径 3.976 0.046 ≥3 mm 25(64.1) 6(35.3) <3 mm 14(35.9) 11(64.7) 空洞壁厚 0.337 0.562 ≥8 mm 22(56.4) 11(64.7) <8 mm 17(43.6) 6(35.3) 空洞形态 0.317 0.573 偏心 26(66.7) 10(58.8) 不偏心 13(33.3) 7(41.2) 恶性征象 10.028 0.002 有 29(74.4) 5(29.4) 无 10(25.6) 12(70.6) 增强CT 强化程度 10.315 0.001 ≥20 HU 31(79.5) 6(35.3) <20 HU 8(20.5) 11(64.7) 强化形态 15.23 <0.001 不均匀 35(89.7) 6(35.3) 均匀 4(10.3) 11(64.7) 强化类型 0.111 0.739 后期 27(69.2) 11(64.7) 早期 12(30.8) 6(35.3) 临床资料 肿瘤标志物 8.922 0.003 升高 33(84.6) 7(41.2) 正常 6(15.4) 10(58.8) 白细胞计数 1.117 0.291 升高 9(23.1) 7(41.2) 正常 30(76.9) 10(58.8) 空洞短期变化 27.438 <0.001 显著 0(0) 11(64.7) 不显著 39(100.0) 6(35.3) 注:FDG为氟脱氧葡萄糖;PET为正电子发射断层显像术;CT为计算机体层摄影术;SUVmax为最大标准化摄取值 表 2 不同影像学方法和临床资料鉴别56例孤立性肺空洞患者良恶性的诊断结果[例(%)]
Table 2. Differential diagnosis of 56 patients with solitary pulmonary cavity by different imaging methods and clinical data (case (%))
项目 SUVmax(7.05) 18F-FDG PET/CT 薄层螺旋CT 增强CT 综合影像分析法 灵敏度 46.2(18/39)a 76.9(30/39)a 82.1(32/39) 71.8(28/39)a 94.9(37/39) 特异度 82.4(14/17) 64.7(11/17) 35.3(6/17)a 76.5(13/17) 76.5(13/17) 准确率 57.1(32/56)a 73.2(41/56)a 67.9(38/56)a 73.2(41/56)a 89.3(50/56) 阳性预测值 85.7(18/21) 83.3(30/36) 74.4(32/43) 87.5(28/32) 90.2(37/41) 阴性预测值 40.0(14/35)a 55.0(11/20) 46.2(6/13) 54.2(13/24)a 86.7(13/15) 注:a表示与综合影像分析法相比,差异均有统计学意义(χ2=4.387~22.259,均P<0.05)。综合影像分析法为对18F-FDG PET/CT、薄层螺旋CT、增强CT的诊断结果进行综合评估。SUVmax为最大标准化摄取值;FDG为氟脱氧葡萄糖;PET为正电子发射断层显像术;CT为计算机体层摄影术 表 3 3种影像学方法、SUVmax和综合影像分析法对56例孤立性肺空洞患者良恶性的诊断效能(%)
Table 3. Diagnostic efficacy of three imaging methods, SUVmax and comprehensive imaging analysis in 56 patients with solitary pulmonary cavity (%)
-
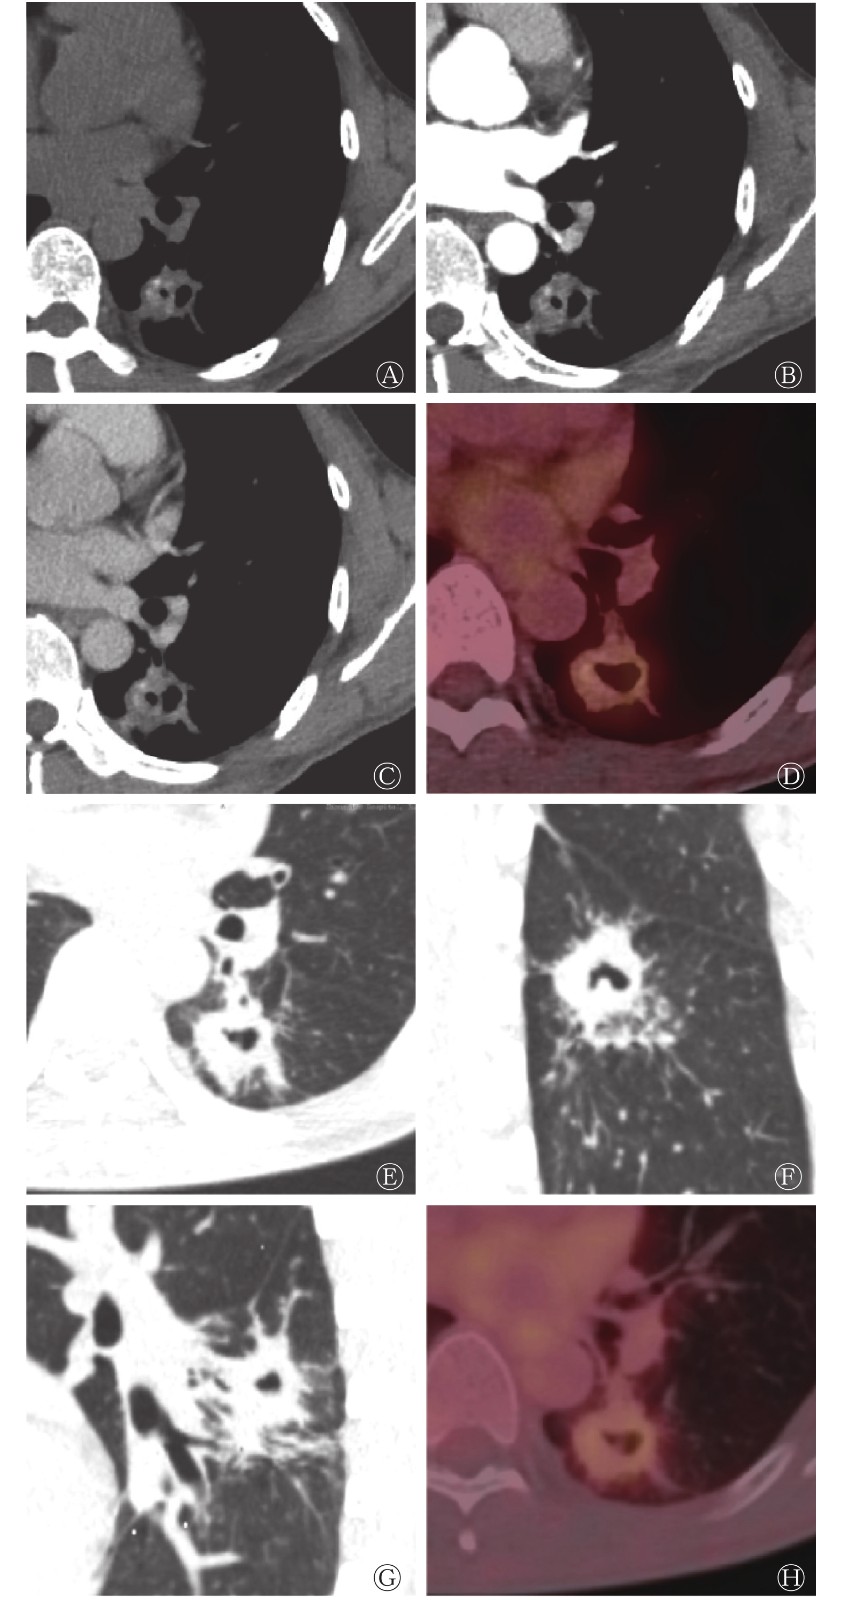
综合影像分析法结果显示,4例患者被误诊为恶性病变,其中1例患者术后组织病理学检查结果提示为肺脓肿,1例患者行多次抗炎治疗后空洞消失,2例患者提示为肺结核;2例患者被误诊为良性病变,但组织病理学检查结果均提示为肺鳞癌。部分误诊且影像诊断结果不一致病例的影像学图像见图3~5。

图 3 孤立性肺空洞患者(男性,44岁)的CT、18F-FDG PET/CT显像图
Figure 3. CT and 18F-FDG PET/CT images of a patient (male, 44 years old) with tuberculous cavity

图 4 肺脓肿性空洞患者(男性,68岁)的CT、18F-FDG PET/CT显像图
Figure 4. CT and 18F-FDG PET/CT images of a patient (male, 68 years old) with pulmonary abscess cavity
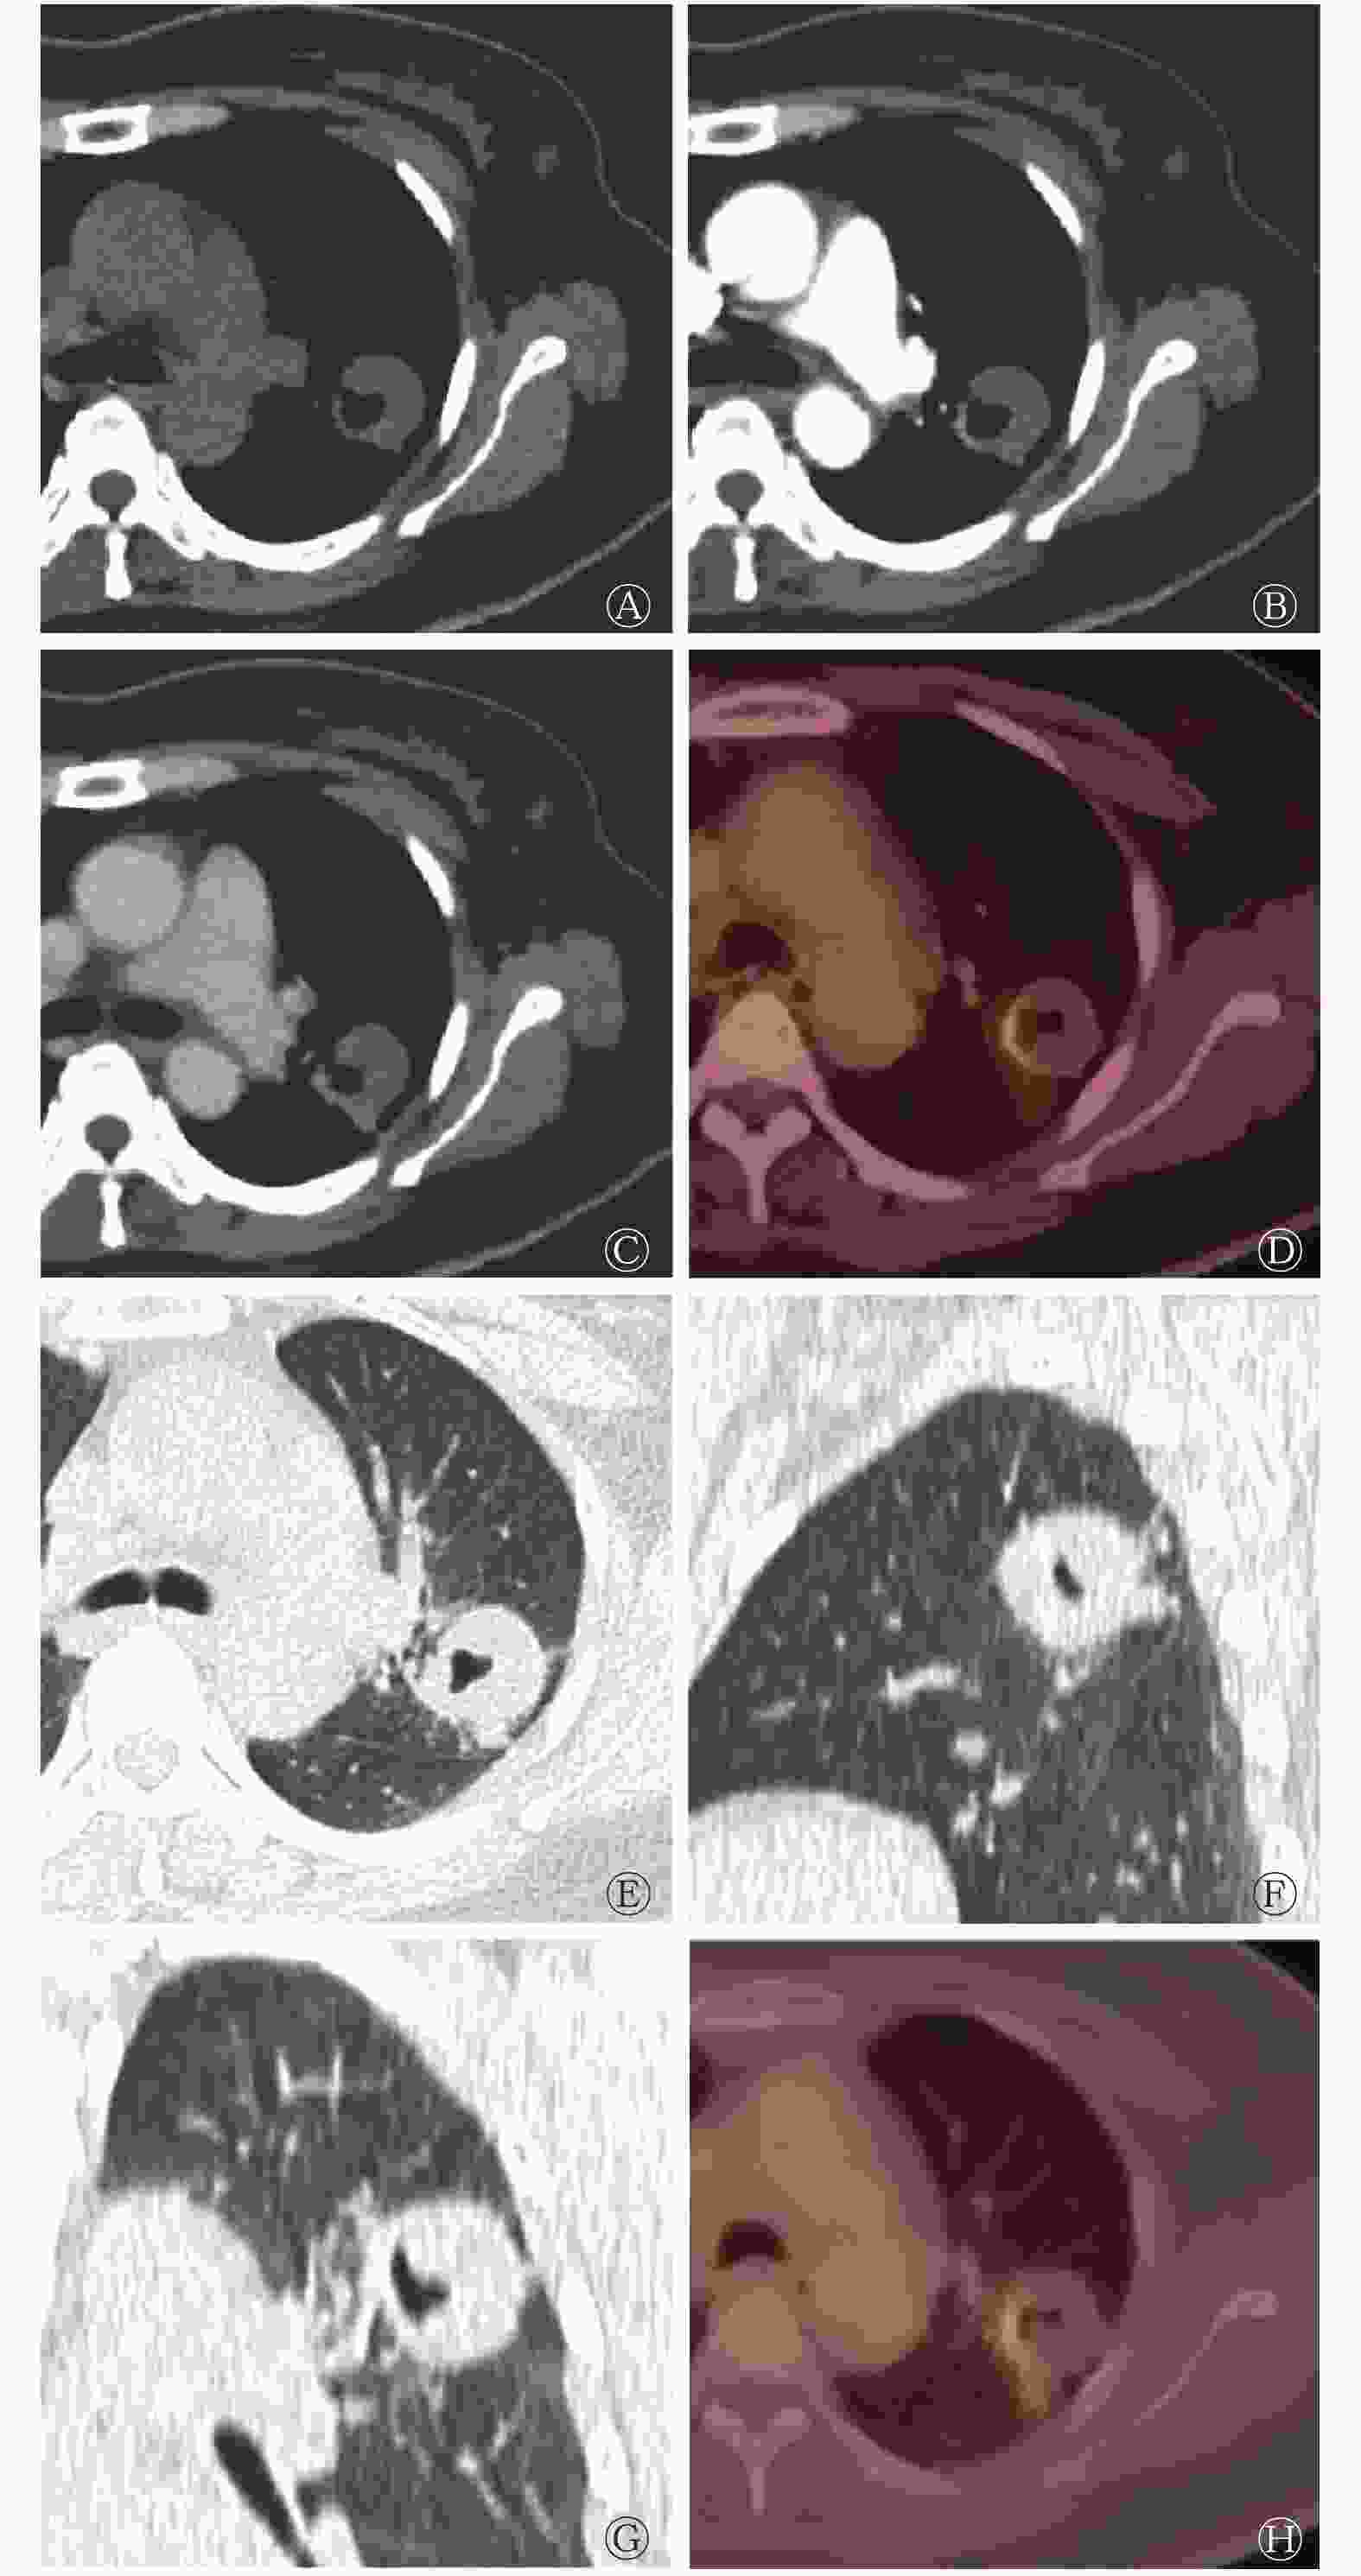
图 5 真菌性肺空洞患者(女性,49岁)的CT、18F-FDG PET/CT显像图
Figure 5. CT and 18F-FDG PET/CT images of a patient (female, 49 years old) with pulmonary fungal cavity
-
肺空洞是一种常见的肺部病变,很多不同类型的肺部疾病在影像上均可表现为肺空洞。18F-FDG PET/CT,64排、128排CT和增强CT可为疾病的诊断提供多维度的信息。通过影像学手段发现和鉴别肺空洞,可为临床的早期治疗提供依据,减轻患者的心理负担,减少患者的医疗费用。
PET/CT使用18F-FDG作为显像剂,将过去解剖层面的影像提升到了生理代谢层面。SUVmax= 2.5是过去用于鉴别肺空洞良恶性的临界值和PET/CT诊断疾病的共识,但越来越多的研究结果表明,目前没有一个明确的鉴别肺空洞良恶性的SUVmax临界值[6]。在孤立性肺空洞病例中,PET/CT不能发挥其全身显像的优势,目前仍常用SUVmax来判断其良恶性。张国玲等[7]分析了50例肺空洞患者PET/CT的诊断结果,认为SUVmax= 4.5可以最大限度地鉴别肺空洞的良恶性。刘永等[8]认为,鉴别肺空洞良恶性的SUVmax最佳临界值为1.85,其诊断的准确率可达82.76%。本研究的结果显示,SUVmax的最佳临界值为7.05,但其ROC曲线的AUC仅为0.652,提示SUVmax= 7.05不是一个很有意义的临界值,且经过统计学分析得出,良恶性肺空洞病灶SUVmax的差异无统计学意义。两者仅在SUVmax分布图上有所区别,恶性肺空洞SUVmax的平均值稍高于良性。因此,SUVmax应结合18F-FDG在病灶分布上的均一性、偏心性等信息,综合评估病灶的代谢情况。本研究中39例恶性孤立性肺空洞患者的SUVmax有高有低,18F-FDG的分布范围也不同,有待于结合病灶的病理生理过程进行深入的研究。有研究者提出,SUVmax对肺癌病理亚型的鉴别有临床意义,鳞癌的SUVmax高于腺癌,腺癌高于肺泡细胞癌[9-10]。一些研究也开始关注标准化摄取峰值(SUVpeak)、瘦体质量最大标准化摄取值(SULmax)、瘦体质量标准化摄取峰值(SULpeak)、肿瘤代谢体积(MTV)和总糖酵解量(TLG)等参数在鉴别肺空洞良恶性中的作用[11],但目前尚没有证据表明上述参数具有合适的用以鉴别肺空洞良恶性的临界值。
戴晗光和张景峰[12]认为,以最大径3 mm为界,可将肺空洞腔区分为肺癌和肺结核,肺癌空洞腔的最大径一般>3 mm,另外,空洞腔内出现气液平面在肺癌中多见,而空洞壁出现钙化成分在结核性空洞中多见;但两者空洞壁的强化方式没有明显差异。本研究患者中44岁男性左肺下叶背段的肺结核性空洞的最大径>3 mm,未见气液平面,空洞壁出现钙化成分,强化不明显,更符合良性征象。王秋虎等[10]认为,典型的肺癌空洞为偏心空洞,空洞壁薄厚不均,壁厚常>8 mm,外壁不规则,可见壁结节,伴有分叶征、毛刺征和胸膜凹陷征等。但肺癌亦可表现为薄壁肺空洞,且多为肺腺癌[13],Nin 等[14]认为,肺空洞最大壁厚≤7 mm和≥24 mm分别提示肺部良性病变和恶性病变。目前大多数研究者认为,肺空洞的壁厚不能作为区分病灶良恶性的标准[15]。赵林等[16]认为,肺癌空洞大部分为偏心空洞,其平均直径大于干酪性肺炎,且干酪性肺炎多位于上叶,而肺癌和肺脓肿多位于下叶,在增强CT扫描时,肺癌空洞壁的强化幅度最大,肺癌空洞壁的厚度与肺结核和肺脓肿无差异,但显著高于真菌性肺空洞。肺脓肿以单发为主[17],根据疾病不同时期的表现,其CT图像略有差异,但总体上为厚壁空洞,周围伴有炎性渗出,四周可有细长毛刺征、棘突征和浅分叶征等,内壁光滑,带有气液平面[18],肺脓肿急性期空洞内气液平面的检出率明显高于肺癌。本研究患者中68岁男性左肺上叶脓肿性空洞的PET/CT表现为18F-FDG摄取增高,最终结合多平面重建(multiplanar reconstruction,MPR)影像特征作出正确诊断。肺空洞由肺结节、肺肿块、肺实变发展而来,三者的形态和功能学增强CT强化方式有相似性。韩文斌等[19]认为,CT最大净增值处于20~60 HU之间为恶性结节,而肺结核灶强化CT值<20 HU。恶性肺占位强化CT峰值出现的时间较良性占位晚,且大部分表现为均匀强化,而良性占位则表现为不均匀强化。深分叶、粗短毛刺、胸膜凹陷征、血管集束征、壁结节、钙化等恶性征象在肺癌和肺良性空洞占位中的发生率的差异均有统计学意义,影像学方法仍然是诊断恶性病灶的主要手段[20-21]。程瑞新等[22]认为,晕征和空气半月征是真菌性肺空洞的特征性征象,具有鉴别意义。而在PET/CT显像上,真菌性肺空洞可以表现为显像剂摄取增高或摄取降低[23]。本研究患者中49岁女性左肺上叶真菌性空洞的SUVmax=4.53,且为偏心摄取,大部分空洞壁摄取不高,但在MPR上可见空气半月征,这对最终诊断有指导意义。
在行影像学诊断时,要注重参考临床资料。癌胚抗原(CEA)、细胞角质素片段抗原(CY-FRA21-1)、神经元特异性烯醇化酶(NSE)和糖类抗原125(CA125)等血清肿瘤标志物的检测,特别是其联合检测对肺癌的鉴别诊断具有临床价值[24]。梁曼曼等[25]的研究结果提示,血清CA125水平可作为了解结核病患者病情进展和评价疗效的指标。肺脓肿一般起病急,患者有不同程度的咳嗽、咳脓痰症状,大部分患者发病初期有可追溯的发热病史,血液WBC明显升高,患者有基础疾病或全身情况差,部分患者有其他医院的抗感染治疗史,影像表现短期内可发生显著变化。本研究患者中68岁男性左肺上叶脓肿性空洞的CT影像特征不典型,PET/CT呈18F-FDG高代谢,仅通过影像难以鉴别,最终结合患者病史和对比治疗前后影像的改变,诊断为肺脓肿,经过规律的抗感染治疗,病情好转。
影像学诊断是一门综合学科,在实际工作中,要利用不同影像表现提供的不同层面的信息对疾病进行综合诊断,结合不同影像技术的优势和患者的临床资料进行综合分析。本研究结果提示,综合18F-FDG PET/CT、薄层螺旋CT、增强CT以及临床资料能够明显提高对孤立性肺空洞诊断的准确率。综合影像分析法也可以应用到肺部其他疾病的诊断中,值得推广。
利益冲突 本研究由署名作者按以下贡献声明独立开展,不涉及任何利益冲突。
作者贡献声明 王珍英负责研究命题的提出与设计、数据的获取与分析、论文的撰写;王卫星负责数据的提供与分析、论文的指导与审阅;马超负责研究命题与数据统计的指导、论文的审阅与最终版本的修订。
18F-FDG PET/CT结合薄层螺旋CT、增强CT和临床资料在孤立性肺空洞中的鉴别诊断价值
Value of 18F-FDG PET/CT combined with thin slice spiral CT, enhanced CT and clinical data in the differential diagnosis of solitary pulmonary cavity
-
摘要:
目的 分析鉴别孤立性肺空洞良恶性的最大标准化摄取值(SUVmax)临界值以及综合影像分析法诊断孤立性肺空洞性质的效能。 方法 回顾性分析2015年10月至2019年10月于厦门大学附属中山医院行18F-氟脱氧葡萄糖(FDG) PET/CT、薄层螺旋CT和增强CT检查的56例孤立性肺空洞患者的影像资料和临床资料,其中男性43例、女性13例,年龄41~82(54.7±13.4)岁。通过构建和分析受试者工作特征(ROC)曲线,计算SUVmax的最佳临界值并评价其诊断效能;以组织病理学检查结果和随访结果为参考标准,结合临床资料计算18F-FDG PET/CT、薄层螺旋CT和增强CT 3种影像学方法以及综合影像分析法(对3种影像学方法的诊断结果进行综合评估)鉴别诊断孤立性肺空洞良恶性的灵敏度、特异度、阳性预测值、阴性预测值和准确率。计量资料的比较采用独立样本t检验,计数资料的比较采用卡方检验。 结果 56例孤立性肺空洞患者中,恶性病变39例(69.6%),SUVmax=7.04±2.3;良性病变17例(30.4%),SUVmax=5.91±2.17,良恶性病变SUVmax的差异无统计学意义(t=1.714,P=0.092)。ROC曲线分析结果显示,SUVmax的最佳临界值为7.05,ROC曲线下面积为0.652,95%置信区间:0.494~0.809。当SUVmax= 7.05时,SUVmax对孤立性肺空洞诊断的灵敏度为46.2%(18/39)、特异度为82.4%(14/17)、阳性预测值为85.7%(18/21)、阴性预测值为40.0%(14/35)、准确率为57.1%(32/56)。综合影像分析法、18F-FDG PET/CT、薄层螺旋CT和增强CT诊断孤立性肺空洞的灵敏度分别为94.9%(37/39)、76.9%(30/39)、82.1%(32/39)和71.8%(28/39);特异度分别为76.5%(13/17)、64.7%(11/17)、35.3%(6/17)和76.5%(13/17);阳性预测值分别为90.2%(37/41)、83.3%(30/36)、74.4%(32/43)和87.5%(28/32);阴性预测值分别为86.7%(13/15)、55.0%(11/20)、46.2%(6/13)和54.2%(13/24);准确率分别为89.3%(50/56)、73.2%(41/56)、67.9%(38/56)和73.2%(41/56)。 结论 SUVmax对孤立性肺空洞良恶性的鉴别价值有限,综合影像分析法有助于提高孤立性肺空洞诊断的效能。 -
关键词:
- 氟脱氧葡萄糖F18 /
- 正电子发射断层显像术 /
- 体层摄影术,X线计算机 /
- 体层摄影术,螺旋计算机 /
- 孤立性肺空洞
Abstract:Objective To analyze the maximum standardized uptake value (SUVmax) threshold to distinguish benign and malignant solitary pulmonary cavity (SPV) and the efficacy of the comprehensive imaging analysis of SPV. Methods The clinical data of 56 patients with SPV who underwent 18F-FDG PET/CT, thin slice spiral CT, and enhanced CT in Xiamen University Zhongshan Hospital from October 2015 to October 2019 were analyzed retrospectively. The patients included 43 males and 13 females aged 41–82 (54.7±13.4) years old. By constructing and analyzing the receiver operating characteristic (ROC) curve, the optimal SUVmax threshold was calculated, and its diagnostic efficiency was evaluated. The sensitivity, specificity, positive predictive value (PPV), negative predictive value (NPV), and the accuracy rate of 18F-FDG PET/CT, thin slice spiral CT, enhanced CT, and the comprehensive imaging analysis (comprehensive evaluation of the diagnostic results of the three imaging methods) of benign and malignant SPV were calculated based on the results of the histopathological examination and follow-up along with clinical data. Independent sample t-test was used to compare measurement data, and chi-square test was used to compare counting data. Results Among the 56 patients with SPV, 39 cases had malignant lesions (69.6%), SUVmax=7.04±2.3, and 17 cases had benign lesions (30.4%), SUVmax=5.91±2.17. No significant difference was found in SUVmax between benign and malignant lesions (t=1.714, P=0.092). ROC curve analysis shows that the optimal critical value of SUVmax was 7.05, the area under the ROC curve was 0.652, and the 95% confidence interval was in the range 0.494–0.809. When SUVmax=7.05, the sensitivity, specificity, PPV, NPV, and the accuracy rate were 46.2% (18/39), 82.4% (14/17), 85.7% (18/21), 40.0% (14/35), and 57.1% (32/56), respectively. The sensitivity rates of comprehensive imaging analysis, PET/CT, thin slice spiral CT, and enhanced CT in the diagnosis of SPV were 94.9% (37/39), 76.9% (30/39), 82.1% (32/39), and 71.8% (28/39); the specificity rates were 76.5% (13/17), 64.7% (11 /17), 35.3% (6/17), and 76.5% (13/17); the PPVs were 90.2% (37/41), 83.3% (30/36), 74.4% (32/43), and 87.5% (28/32); the NPVs were 86.7% (13/15), 55.0% (11/20), 46.2% (6/13), and 54.2% (13/ 24); and the diagnostic accuracy rates were 89.3% (50/56), 73.2% (41/56), 67.9% (38/56), and 73.2% (41/56), respectively. Conclusions SUVmax has a limited value in differentiating benign and malignant SPV. Comprehensive imaging analysis helps improve the diagnostic accuracy of SPV. -
图 1 56例孤立性肺空洞患者良恶性病变SUVmax的分布图SUVmax为最大标准化摄取值
Figure 1. The maximum standardized uptake value distribution of benign and malignant lesions in 56 patients with solitary pulmonary cavity
图 2 鉴别诊断56例孤立性肺空洞患者良恶性病变的最大标准化摄取值临界值的受试者工作特征曲线
Figure 2. Receiver operator characteristic curve of the maximum standardized uptake value critical value for differentiating benign and malignant lesions in 56 patients with solitary pulmonary cavity
图 3 孤立性肺空洞患者(男性,44岁)的CT、18F-FDG PET/CT显像图
Figure 3. CT and 18F-FDG PET/CT images of a patient (male, 44 years old) with tuberculous cavity
图 4 肺脓肿性空洞患者(男性,68岁)的CT、18F-FDG PET/CT显像图
Figure 4. CT and 18F-FDG PET/CT images of a patient (male, 68 years old) with pulmonary abscess cavity
图 5 真菌性肺空洞患者(女性,49岁)的CT、18F-FDG PET/CT显像图
Figure 5. CT and 18F-FDG PET/CT images of a patient (female, 49 years old) with pulmonary fungal cavity
表 1 不同影像学方法鉴别56例孤立性肺空洞患者良恶性 的诊断结果[例(%)]
Table 1. Differential diagnosis of 56 patients with solitary pulmonary cavity by different imaging methods (case (%))
诊断方法 组织病理学检查或随访结果 χ2值 P值 恶性(n=39) 良性(n=17) 18F-FDG PET/CT 30(76.9) 6(35.3) 8.936 0.003 9(23.1) 11(64.7) 薄层螺旋CT 32(82.1) 11(64.7) 1.144 0.285 7(17.9) 6(35.3) 增强CT 28(71.8) 4(23.5) 11.262 0.001 11(28.2) 13(76.5) 综合影像分析法 37(94.9) 4(23.5) 38.678 <0.001 2(5.1) 13(76.5) 注:综合影像分析法为对18F-FDG PET/CT、薄层螺旋CT、增强CT的诊断结果进行综合评估。FDG为氟脱氧葡萄糖;PET为正电子发射断层显像术;CT为计算机体层摄影术  下载: 导出CSV
表 2 不同影像学方法和临床资料鉴别56例孤立性肺空洞患者良恶性的诊断结果[例(%)]
Table 2. Differential diagnosis of 56 patients with solitary pulmonary cavity by different imaging methods and clinical data (case (%))
诊断方法 诊断项目 组织病理学检查或随访结果 χ2值 P值 恶性(n=39) 良性(n=17) 18F-FDG PET/CT SUVmax 4.105 0.043 ≥7.05 18(46.2) 3(17.6) < 7.05 21(53.8) 14(82.4) SUV分布 1.352 0.245 不均匀 29(74.4) 10(58.8) 均匀 10(25.6) 7(41.2) 薄层螺旋CT 空洞位置 0.01 0.919 上叶 27(69.2) 12(70.6) 中/下叶 12(30.8) 5(29.4) 空洞直径 3.976 0.046 ≥3 mm 25(64.1) 6(35.3) <3 mm 14(35.9) 11(64.7) 空洞壁厚 0.337 0.562 ≥8 mm 22(56.4) 11(64.7) <8 mm 17(43.6) 6(35.3) 空洞形态 0.317 0.573 偏心 26(66.7) 10(58.8) 不偏心 13(33.3) 7(41.2) 恶性征象 10.028 0.002 有 29(74.4) 5(29.4) 无 10(25.6) 12(70.6) 增强CT 强化程度 10.315 0.001 ≥20 HU 31(79.5) 6(35.3) <20 HU 8(20.5) 11(64.7) 强化形态 15.23 <0.001 不均匀 35(89.7) 6(35.3) 均匀 4(10.3) 11(64.7) 强化类型 0.111 0.739 后期 27(69.2) 11(64.7) 早期 12(30.8) 6(35.3) 临床资料 肿瘤标志物 8.922 0.003 升高 33(84.6) 7(41.2) 正常 6(15.4) 10(58.8) 白细胞计数 1.117 0.291 升高 9(23.1) 7(41.2) 正常 30(76.9) 10(58.8) 空洞短期变化 27.438 <0.001 显著 0(0) 11(64.7) 不显著 39(100.0) 6(35.3) 注:FDG为氟脱氧葡萄糖;PET为正电子发射断层显像术;CT为计算机体层摄影术;SUVmax为最大标准化摄取值
下载: 导出CSV
表 3 3种影像学方法、SUVmax和综合影像分析法对56例孤立性肺空洞患者良恶性的诊断效能(%)
Table 3. Diagnostic efficacy of three imaging methods, SUVmax and comprehensive imaging analysis in 56 patients with solitary pulmonary cavity (%)
项目 SUVmax(7.05) 18F-FDG PET/CT 薄层螺旋CT 增强CT 综合影像分析法 灵敏度 46.2(18/39)a 76.9(30/39)a 82.1(32/39) 71.8(28/39)a 94.9(37/39) 特异度 82.4(14/17) 64.7(11/17) 35.3(6/17)a 76.5(13/17) 76.5(13/17) 准确率 57.1(32/56)a 73.2(41/56)a 67.9(38/56)a 73.2(41/56)a 89.3(50/56) 阳性预测值 85.7(18/21) 83.3(30/36) 74.4(32/43) 87.5(28/32) 90.2(37/41) 阴性预测值 40.0(14/35)a 55.0(11/20) 46.2(6/13) 54.2(13/24)a 86.7(13/15) 注:a表示与综合影像分析法相比,差异均有统计学意义(χ2=4.387~22.259,均P<0.05)。综合影像分析法为对18F-FDG PET/CT、薄层螺旋CT、增强CT的诊断结果进行综合评估。SUVmax为最大标准化摄取值;FDG为氟脱氧葡萄糖;PET为正电子发射断层显像术;CT为计算机体层摄影术
下载: 导出CSV
-
[1] Derlin T, Grünwald V, Steinbach J, et al. Molecular imaging in oncology using positron emission tomography[J/OL]. Dtsch Arztebl Int, 2018, 115(11): 175−181[2020-08-28]. https://www.aerzteblatt.de/int/archive/article/196926. DOI: 10.3238/arztebl.2018.0175. [2] 王跃涛, 刘德峰, 钱作宾, 等. 18F-FDG PET/CT双时相显像对肺部病灶的定性诊断价值[J]. 中华核医学与分子影像杂志, 2009, 29(5): 293−296. DOI: 10.3760/cma.j.issn.0253-9780.2009.05.002.
Wang YT, Liu DF, Qian ZB, et al. The value of dual-time point 18F-FDG PET imaging for the differentiation between pulmonary malignant and benign lesions[J]. Chin J Nucl Med Mol Imaging, 2009, 29(5): 293−296. DOI: 10.3760/cma.j.issn.0253-9780.2009.05.002.[3] Xue XY, Liu YX, Wang KF, et al. Computed tomography for the diagnosis of solitary thin-walled cavity lung cancer[J]. Clin Respir J, 2015, 9(4): 392−398. DOI: 10.1111/crj.12172. [4] 薛少军, 任莉. 多层螺旋CT在肺结核与肺癌空洞鉴别诊断中的临床价值[J]. 肿瘤学杂志, 2017, 23(5): 442−444. DOI: 10.11735/j.issn.1671-170X.2017.05.B018.
Xue SJ, Ren L. Clinical value of MSCT in differential diagnosis of tuberculosis and lung cancer cavities[J]. J Chin Oncol, 2017, 23(5): 442−444. DOI: 10.11735/j.issn.1671-170X.2017.05.B018.[5] 陈昆涛, 何健垣, 仇光禹. 肺空洞性病变的CT定量分析[J]. 实用医学影像杂志, 2008, 9(1): 16−18. DOI: 10.3969/j.issn.1009-6817.2008.01.007.
Chen KT, He JY, Qiu GY. Quantitative analysis on CT findings of intrapulmonary cavitary lesions[J]. J Pract Med Imaging, 2008, 9(1): 16−18. DOI: 10.3969/j.issn.1009-6817.2008.01.007.[6] 吴一田, 耿建华. 正电子发射断层扫描标准摄取值及其在肿瘤诊断中的应用进展[J]. 中国医学装备, 2017, 14(1): 117−121. DOI: 10.3969/J.ISSN.1672-8270.2017.01.035.
Wu YT, Geng JH. Review of progress of PET SUV in tumor diagnosis[J]. China Med Equip, 2017, 14(1): 117−121. DOI: 10.3969/J.ISSN.1672-8270.2017.01.035.[7] 张国玲, 兰晓莉, 刘红红, 等. 18F-FDG PET/CT对孤立肺结节伴空洞鉴别诊断价值分析[J]. 中华肿瘤防治杂志, 2014, 21(10): 762−766. DOI: 10.16073/j.cnki.cjcpt.2014.10.001.
Zhang GL, Lan XL, Liu HH, et al. Feasibility of 18F-FDG PET/CT in the differential diagnosis of benign and malignant solitary pulmonary nodules with cavity[J]. Chin J Cancer Prev Treat, 2014, 21(10): 762−766. DOI: 10.16073/j.cnki.cjcpt.2014.10.001.[8] 刘永, 陈鹏, 孙振国, 等. 18F-FDG PET/CT诊断孤立性肺结节良恶性的效能分析[J]. 中华核医学与分子影像杂志, 2020, 40(7): 411−414. DOI: 10.3760/cma.j.cn321828-20191125-00182.
Liu Y, Chen P, Sun ZG, et al. Efficacy of 18F-FDG PET/CT in the differential diagnosis of benign and malignant solitary pulmonary nodules[J]. Chin J Nucl Med Mol Imaging, 2020, 40(7): 411−414. DOI: 10.3760/cma.j.cn321828-20191125-00182.[9] Flechsig P, Frank P, Kratochwil C, et al. Radiomic analysis using density threshold for FDG-PET/CT-based N-staging in lung cancer patients[J]. Mol Imaging Biol, 2017, 19(2): 315−322. DOI: 10.1007/s11307-016-0996-z. [10] 王秋虎, 张淮, 王书中. 空洞型肺癌的PET-CT影像特点分析[J]. 临床肺科杂志, 2020, 25(3): 385−388. DOI: 10.3969/j.issn.1009-6663.2020.03.015.
Wang QH, Zhang H, Wang SZ. Analysis for PET-CT features of cavitating lung cancer[J]. J Clin Pulm Med, 2020, 25(3): 385−388. DOI: 10.3969/j.issn.1009-6663.2020.03.015.[11] 江伟, 徐文贵, 张瑞平, 等. 基于PET代谢参数构建孤立性肺良恶性病变预测模型[J]. 中国医学影像技术, 2019, 35(5): 696−700. DOI: 10.13929/j.1003-3289.201812012.
Jiang W, Xu WG, Zhang RP, et al. Diagnostic models of solitary pulmonary mass lesion based on PET metabolic parameters[J]. Chin J Med Imaging Technol, 2019, 35(5): 696−700. DOI: 10.13929/j.1003-3289.201812012.[12] 戴晗光, 张景峰. 多层螺旋CT对肺部空洞性病变中癌性空洞和结核性空洞的诊断价值[J]. 健康研究, 2019, 39(3): 327−330. DOI: 10.3969/j.issn.1674-6449.2019.03.023.
Dai HG, Zhang JF. Efficacy of multi-slice spiral CT in the diagnosis of cancerous cavity and tuberculosis cavity in pulmonary hollow lesions[J]. Health Res, 2019, 39(3): 327−330. DOI: 10.3969/j.issn.1674-6449.2019.03.023.[13] Xue XY, Wang PL, Xue QL, et al. Comparative study of solitary thin-walled cavity lung cancer with computed tomography and pathological findings[J]. Lung Cancer, 2012, 78(1): 45−50. DOI: 10.1016/j.lungcan.2012.06.004. [14] Nin CS, de Souza VVS, Alves GRT, et al. Solitary lung cavities: CT findings in malignant and non-malignant disease[J]. Clin Radiol, 2016, 71(11): 1132−1136. DOI: 10.1016/j.crad.2016.04.009. [15] Giacomelli IL, Barros M, Pacini GS, et al. Multiple cavitary lung lesions on CT: imaging findings to differentiate between malignant and benign etiologies[J]. J Bras Pneumol, 2020, 46(2): e20190024. DOI: 10.36416/1806-3756/e20190024. [16] 赵林, 李会菊, 李晓阳, 等. 肺部癌性空洞与其他空洞的CT诊断及鉴别诊断[J]. 海南医学, 2015, 26(9): 1295−1298. DOI: 10.3969/j.issn.1003-6350.2015.09.0465.
Zhao L, Li HJ, Li XY, et al. CT diagnosis and differential diagnosis of carcinomatous cavity of lung and other cavities[J]. Hainan Med J, 2015, 26(9): 1295−1298. DOI: 10.3969/j.issn.1003-6350.2015.09.0465.[17] 胡蝶. 多层螺旋CT对肺脓肿诊断及疗效评估的价值分析[J]. 中国CT和MRI杂志, 2020, 18(1): 82−84. DOI: 10.3969/j.issn.1672-5131.2020.01.026.
Hu D. Value analysis of multi-slice spiral CT in diagnosis and therapeutic evaluation of pulmonary abscess[J]. Chin J CT MRI, 2020, 18(1): 82−84. DOI: 10.3969/j.issn.1672-5131.2020.01.026.[18] 林运智, 吴清武. 不典型肺脓肿CT影像学表现特征分析[J]. 中国CT和MRI杂志, 2017, 15(6): 56−59. DOI: 10.3969/j.issn.1672-5131.2017.06.018.
Lin YZ, Wu QW. CT image performance characteristics analysis of atypical pulmonary abscess[J]. Chin J CT MRI, 2017, 15(6): 56−59. DOI: 10.3969/j.issn.1672-5131.2017.06.018.[19] 韩文彬, 左稳, 陈竹碧, 等. CT平扫与三期增强扫描对肺结节的诊断价值分析[J]. 中国CT和MRI杂志, 2018, 16(8): 50−53. DOI: 10.3969/j.issn.1672-5131.2018.08.016.
Han WB, Zuo W, Chen ZB, et al. Diagnostic value of CT plain scan and CT tri-phase enhancement scan in pulmonary nodules[J]. Chin J CT MRI, 2018, 16(8): 50−53. DOI: 10.3969/j.issn.1672-5131.2018.08.016.[20] 彭东, 杨军, 张雷. 肺结核空洞与肺癌空洞的CT影像差异分析[J]. 癌症进展, 2018, 16(8): 954−955, 993. DOI: 10.11877/j.issn.1672-1535.2018.16.08.08.
Peng D, Yang J, Zhang L. Differential analysis of CT image on diagnosis of pulmonary cavities of tuberculosis and lung cancer[J]. Oncol Prog, 2018, 16(8): 954−955, 993. DOI: 10.11877/j.issn.1672-1535.2018.16.08.08.[21] Parkar AP, Kandiah P. Differential diagnosis of cavitary lung lesions[J]. J Belg Soc Radiol, 2016, 100(1): 100. DOI: 10.5334/jbr-btr.1202. [22] 程瑞新, 宋璟璟, 龚志刚, 等. 单发真菌性肺空洞的CT表现[J]. 医学影像学杂志, 2015, 25(7): 1160−1162, 1165.
Cheng RX, Song JJ, Gong ZG, et al. CT findings of cavitary pulmonary diseases in patients with pulmonary mycosis[J]. J Med Imaging, 2015, 25(7): 1160−1162, 1165.[23] 李生栩, 唐明灯, 林端瑜, 等. 22例结节型肺隐球菌病18F-FDG PET/CT显像的回顾性分析[J]. 国际放射医学核医学杂志, 2020, 44(1): 37−44. DOI: 10.3760/cma.j.issn.1673-4114.2020.01.009.
Li SX, Tang MD, Lin DY, et al. Retrospective analysis of 18F-FDG PET/CT imaging in 22 cases of nodular type pulmonary cryptococcosis[J]. Int J Radiat Med Nucl Med, 2020, 44(1): 37−44. DOI: 10.3760/cma.j.issn.1673-4114.2020.01.009.[24] 刘彩红, 庄金宝, 卢念红. 血清肿瘤标志物联合检测在肺癌诊断中的价值研究[J]. 国际检验医学杂志, 2017, 38(24): 3377−3379. DOI: 10.3969/j.issn.1673-4130.2017.24.007.
Liu CH, Zhuang JB, Lu NH. The study of the value of combined detection of serum tumor markers in the diagnosis of lung cancer[J]. Int J Lab Med, 2017, 38(24): 3377−3379. DOI: 10.3969/j.issn.1673-4130.2017.24.007.[25] 梁曼曼, 耿彪, 林敏, 等. 结核病患者治疗过程中血清多种肿瘤标志物水平的变化[J]. 中华传染病杂志, 2014, 32(8): 479−483. DOI: 10.3760/cma.j.issn.1000-6680.2014.08.007.
Liang MM, Geng B, Lin M, et al. The changes of serum tumor markers levels during anti-tuberculosis treatment in active tuberculosis patients[J]. Chin J Infect Dis, 2014, 32(8): 479−483. DOI: 10.3760/cma.j.issn.1000-6680.2014.08.007. -

 点击查看大图

计量
- 文章访问数: 4394
- HTML全文浏览量: 3003
- PDF下载量: 17
