


-
贫血为外周血单位容积内血红蛋白浓度、红细胞总数低于相同年龄、性别及地域人群的参考范围下限时出现的一种症状[1]。贫血在临床中比较常见,除了血液系统疾病本身会引起贫血外,大部分是由其他系统疾病引起[2]。贫血患者早期症状不明显,但随着时间推移及贫血程度加重会逐渐出现全身各系统的临床症状,其中对于神经系统的影响主要导致患者头痛、眩晕、失眠、多梦、记忆力减退和注意力不集中等。PET脑代谢显像能灵敏地发现情感与认知功能脑区的代谢异常,以往的研究结果显示,糖尿病[3]及肿瘤[4]患者PET脑代谢显像均出现情感等功能脑区葡萄糖代谢异常,但对于贫血患者脑葡萄糖代谢改变的研究目前罕有报道。本研究回顾性分析了51例贫血患者的脑部PET/CT影像资料,以期探讨贫血患者脑葡萄糖代谢改变的特点及其临床意义。
-
回顾性分析2016年12月至2019年4月经郑州大学人民医院确诊为贫血的51例患者的全身PET/CT检查资料,其中男性16例、女性35例,年龄21~60(41.13±9.78)岁。贫血诊断和分级标准参考WHO[5]和我国陈灏珠等[6]制订的标准:成年男性血红蛋白(hemoglobin,Hb)<120 g/L、成年女性Hb<110 g/L诊断为贫血,按贫血程度分为轻度(90 g/L~正常下限)、中度(60~90 g/L)和重度(30~60 g/L)3组。纳入标准:临床诊断为贫血的患者。排除标准:①患有脑梗死、脑出血、脑外伤及精神、神经系统疾病史及家族史;②患有心脏、肝脏、胰脏、脾脏和肾脏等严重脏器疾病;③患有甲亢、甲减和糖尿病等代谢疾病史,有长期乙醇及药物滥用史;④经影像学检查证实有脑内原发肿瘤或转移性病变、有脑缺血性病灶以及脑内其他器质性病变,有全身其他脏器或系统肿瘤性病变。剔除标准:为了减少年龄差异造成的生理性结果偏倚,剔除了<18岁和>60岁的患者。另选取56名同期在我院行全身PET/CT检查无阳性发现且无上述疾病史的健康体检者作为对照组,其中男性29名、女性27名,年龄19~58(41.96±9.27)岁。所有患者均为右利手,且均于检查前签署了知情同意书。本研究符合《赫尔辛基宣言》的原则。
-
显像设备为美国GE公司Discovery™ VCT PET/CT仪,18F-FDG由美国GE公司 Minitrace医用回旋加速器和北京派特公司FDG自动合成装置合成,放射化学纯度>95%。检查前受试者禁食6 h以上,指尖采血验血糖,控制空腹血糖<6.1 mmol/L。患者静脉注射18F-FDG,剂量为5.55 MBq/kg。在室温舒适的环境中休息40~50 min后行PET/CT显像。显像时将患者头部固定,采用先CT扫描,后PET扫描的方式进行采集;先进行体部三维采集,后进行头部三维采集。采集时间共30 min,其中头颅采集10 min。脑部PET/CT扫描参数:CT电压120 kV、电流240 mA、层厚5 mm;PET轴向显示野为25.0 cm,矩阵128×128。PET采集计数采用有序子集最大期望值算法(2次迭代,18个子集数)进行图像重建,所用函数为滤波函数,半高宽为2.5 mm,获得横断面、矢状面和冠状面的图像。
-
在Matalab 12.0平台上应用统计参数图(SPM)8软件先将PET图像转换为Analyze7图像数据格式,然后对图像进行位置校正及归一化处理,使之与Talairach脑图谱的空间坐标对应,使用2倍于图像空间分辨率的卷积核(8 mm×8 mm×8 mm)对图像进行高斯平滑处理,得到矩阵128×128、体素大小为2 mm×2 mm×2 mm的目标图像[4]。之后进行图像的统计学处理,分别将贫血患者与健康对照者及轻度、中度、重度贫血患者间的脑18F-FDG PET图像进行体素对体素的两独立样本t检验(方差齐),检验水平为P<0.05,并进行族错误率(FWE)校正,体素阈值K>50,得到各自组间的脑代谢差异分布图。同时借助统计参数图软件(SPM)8中的插件xjView软件对差异有统计学意义的脑区进行立体定位分析和体素值定量分析,同时得出各异常区域的t值。应用SPSS 21.0软件进行统计学分析,符合正态分布的计量资料以
$ {{\bar x}} \pm {{s}} $ 表示,组间比较采用两独立样本t检验。计数资料以例数及百分数表示,组间比较采用χ2检验。P<0.05为差异有统计学意义。 -
贫血患者与健康对照者的年龄分布差异无统计学意义(t=−0.448,P=0.655)。51例贫血患者中,女性占比明显高于男性(68.6%对31.4%),且差异有统计学意义(χ2=4.564,P=0.026)。贫血患者的一般资料和血红蛋白浓度见表1,其中轻度、中度、重度贫血患者分别为27、18、6例。
贫血程度 性别 例数 年龄(岁) 血红蛋白浓度(g/L) 轻度贫血 男 9 30~55(39.67±8.41) 94~118(108.25±10.57) 女 18 21~60(38.33±14.99) 92~107(99.26±4.72) 中度贫血 男 5 31~54(46.80±9.31) 68~86(80.80±7.29) 女 13 22~55(41.62±10.22) 70~85(77.85±5.93) 重度贫血 男 2 47~52(49.50±3.54) 43~52(47.50±6.36) 女 4 22~50(37.25±13.89) 42~56(50.50±6.45) 表 1 贫血患者的一般资料和血红蛋白浓度
Table 1. General data and hemoglobin concentration in anemia patients
-
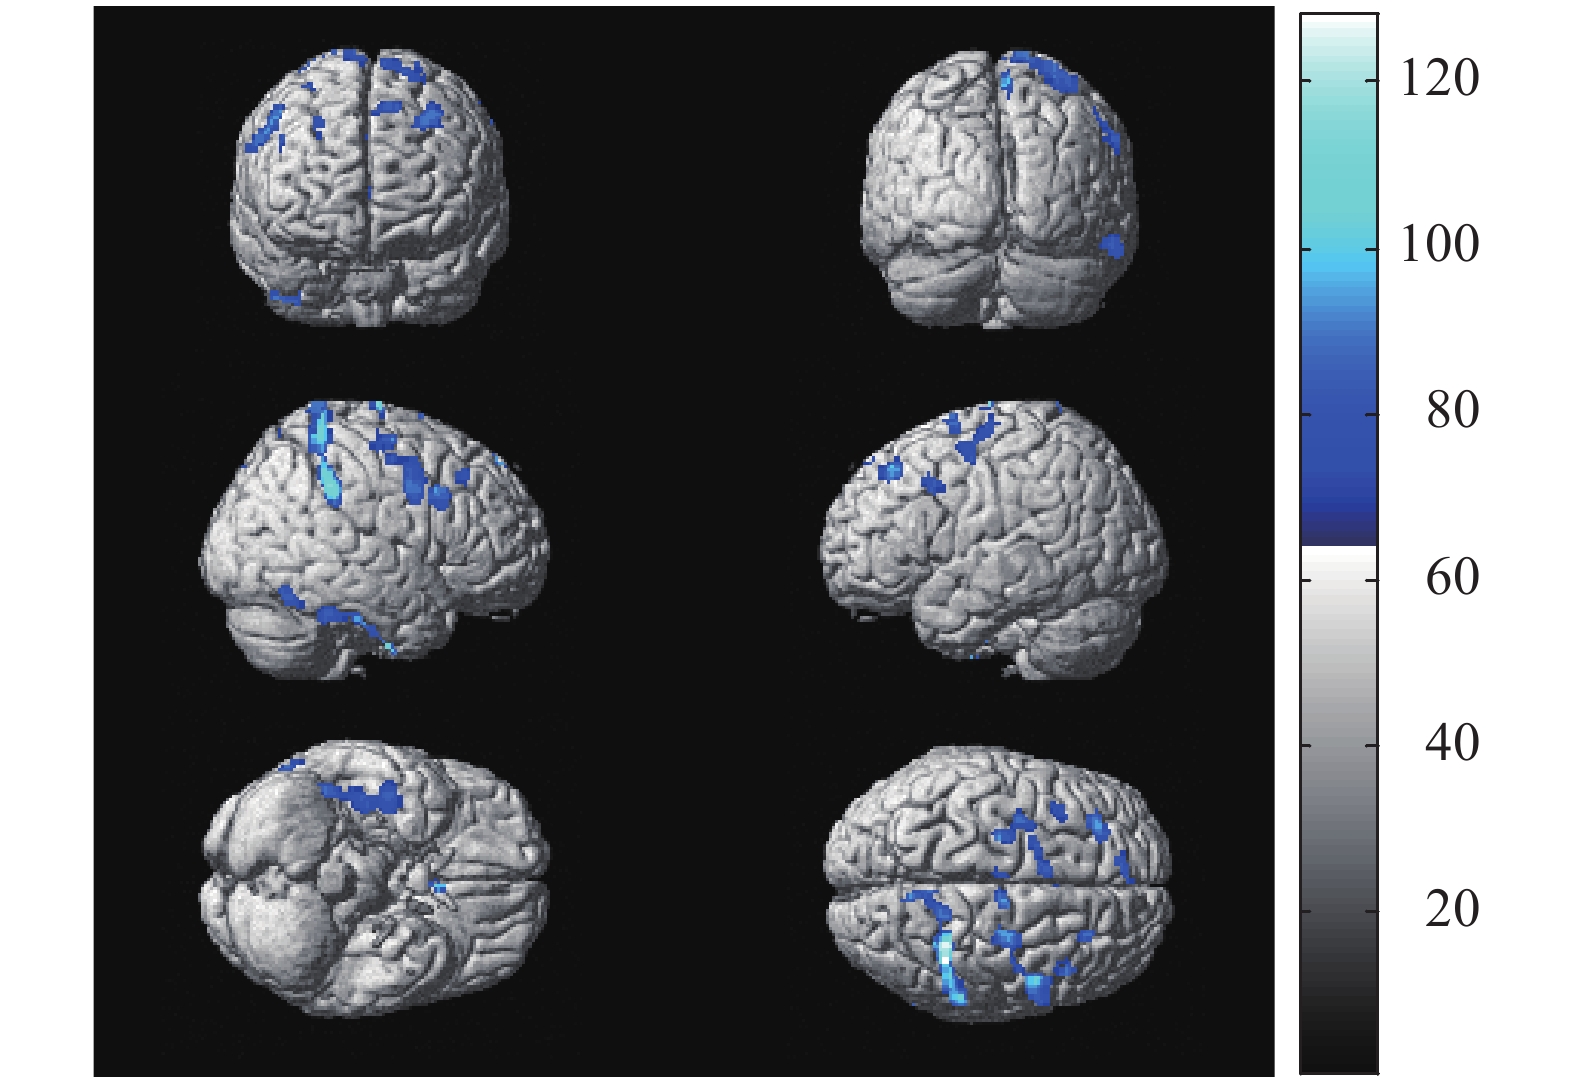
与健康对照者比较,贫血患者在静息状态下脑18F-FDG PET图像均以葡萄糖代谢减低为主,涉及的脑区包括双侧额上、中、下回,右侧颞叶下回和右侧顶下小叶,未见明显代谢增高脑区,总体素数为3705个,其代谢减低区的具体分布见图1和表2。

图 1 51例贫血患者与56名健康对照者比较脑葡萄糖代谢减低区的统计参数图 蓝色所示代谢减低区为双侧额上、中、下回,右侧颞叶下回和右侧顶下小叶
Figure 1. The statistical parameter map of cerebral glucose metabolism decreased in 51 patients with anemia compared with 56 normal controls
脑功能区 Talairach坐标 体素数(个) t值 P值 X Y Z 左侧额上回 −24 64 −8 88 5.56 <0.05 左侧额中下回 −32 8 48 591 5.74 <0.05 右侧额上回 26 32 48 115 5.53 <0.05 右侧额中回 36 −10 50 1299 5.01 <0.05 右侧额下回 52 10 4 375 5.69 <0.05 右侧颞叶下回 68 −64 −6 736 5.85 <0.05 右侧顶下小叶 40 −42 42 501 5.62 <0.05 表 2 51例贫血患者与56名健康对照者比较脑葡萄糖代谢 的减低区
Table 2. Positions of the reduced glucose metabolism cerebral regions in 51 patients with anemia compared with 56 normal controls
-
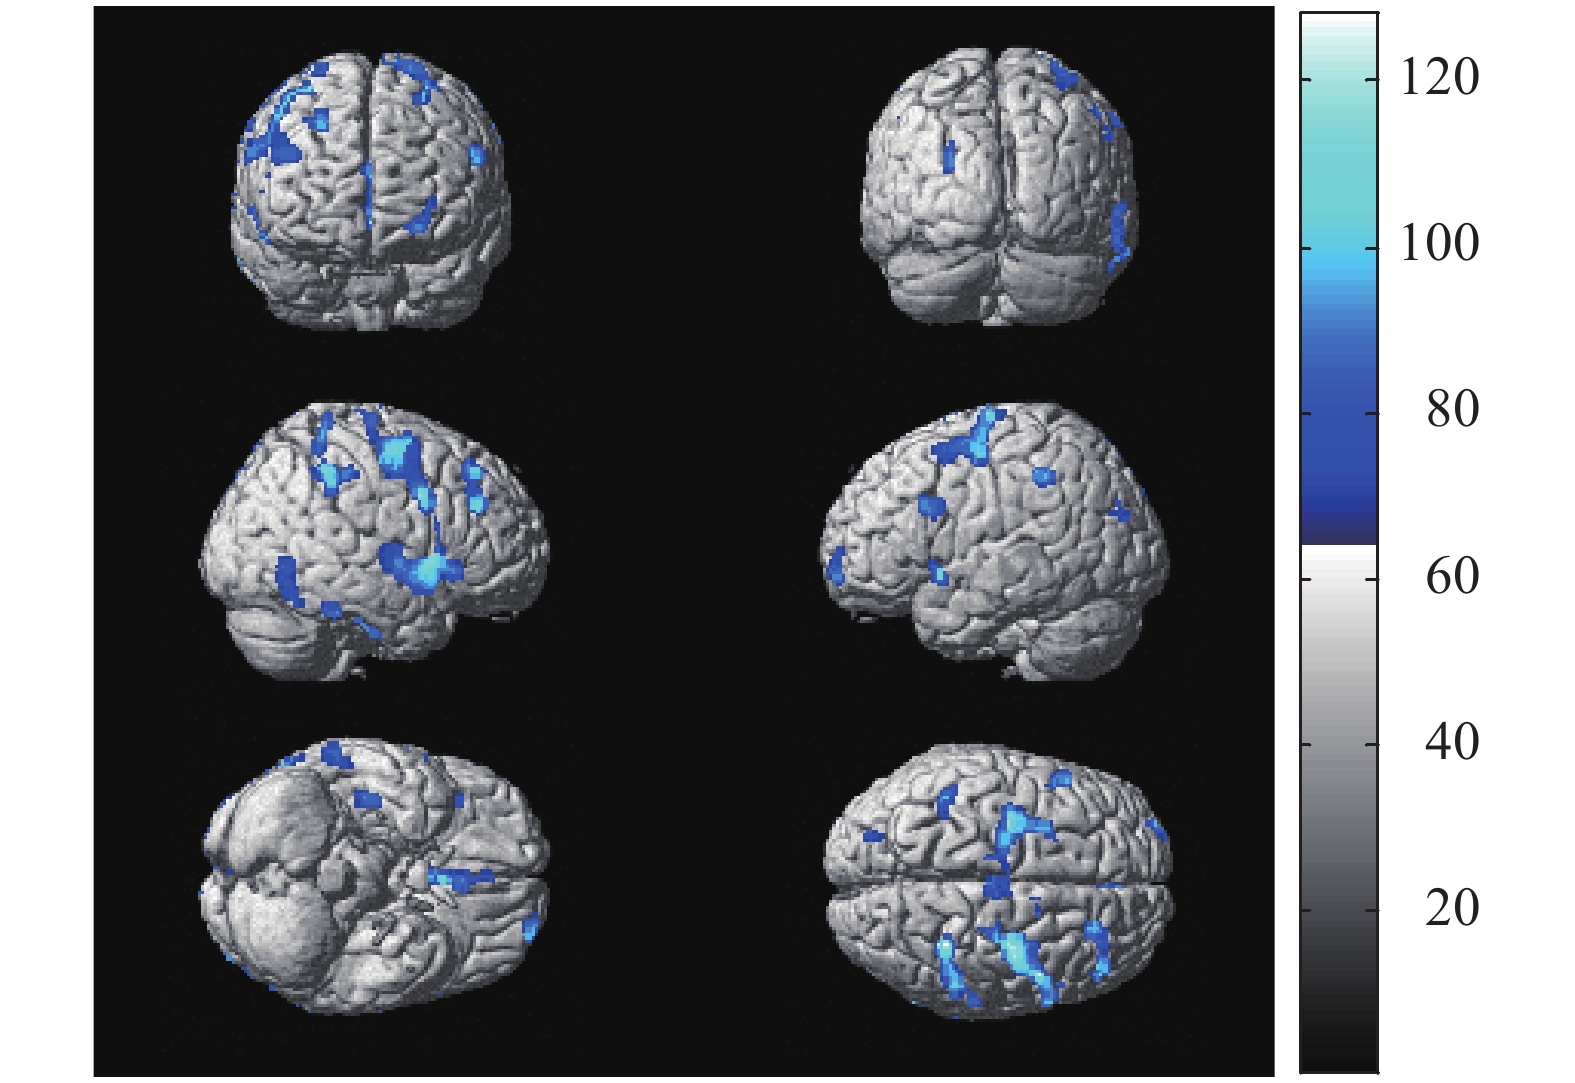
与轻度贫血患者比较,中度贫血患者脑葡萄糖代谢减低区见于双侧额下回、右侧额中回、右侧颞叶下回和右侧顶下小叶,总体素数为832个,其代谢减低区的具体分布见图2和表3。与轻度贫血患者比较,重度贫血患者脑葡糖糖代谢减低区见于双侧额上回、双侧额中下回、右侧颞叶下回和右侧顶下小叶,总体素数为1834个,其代谢减低区的具体分布见图3和表4。与中度贫血患者比较,重度贫血患者脑葡萄糖代谢减低区见于左侧额上回、左侧额中下回、右侧额中回、右侧颞叶下回和右侧顶下小叶,总体素数为1598个,其代谢减低区的具体分布见图4和表5。
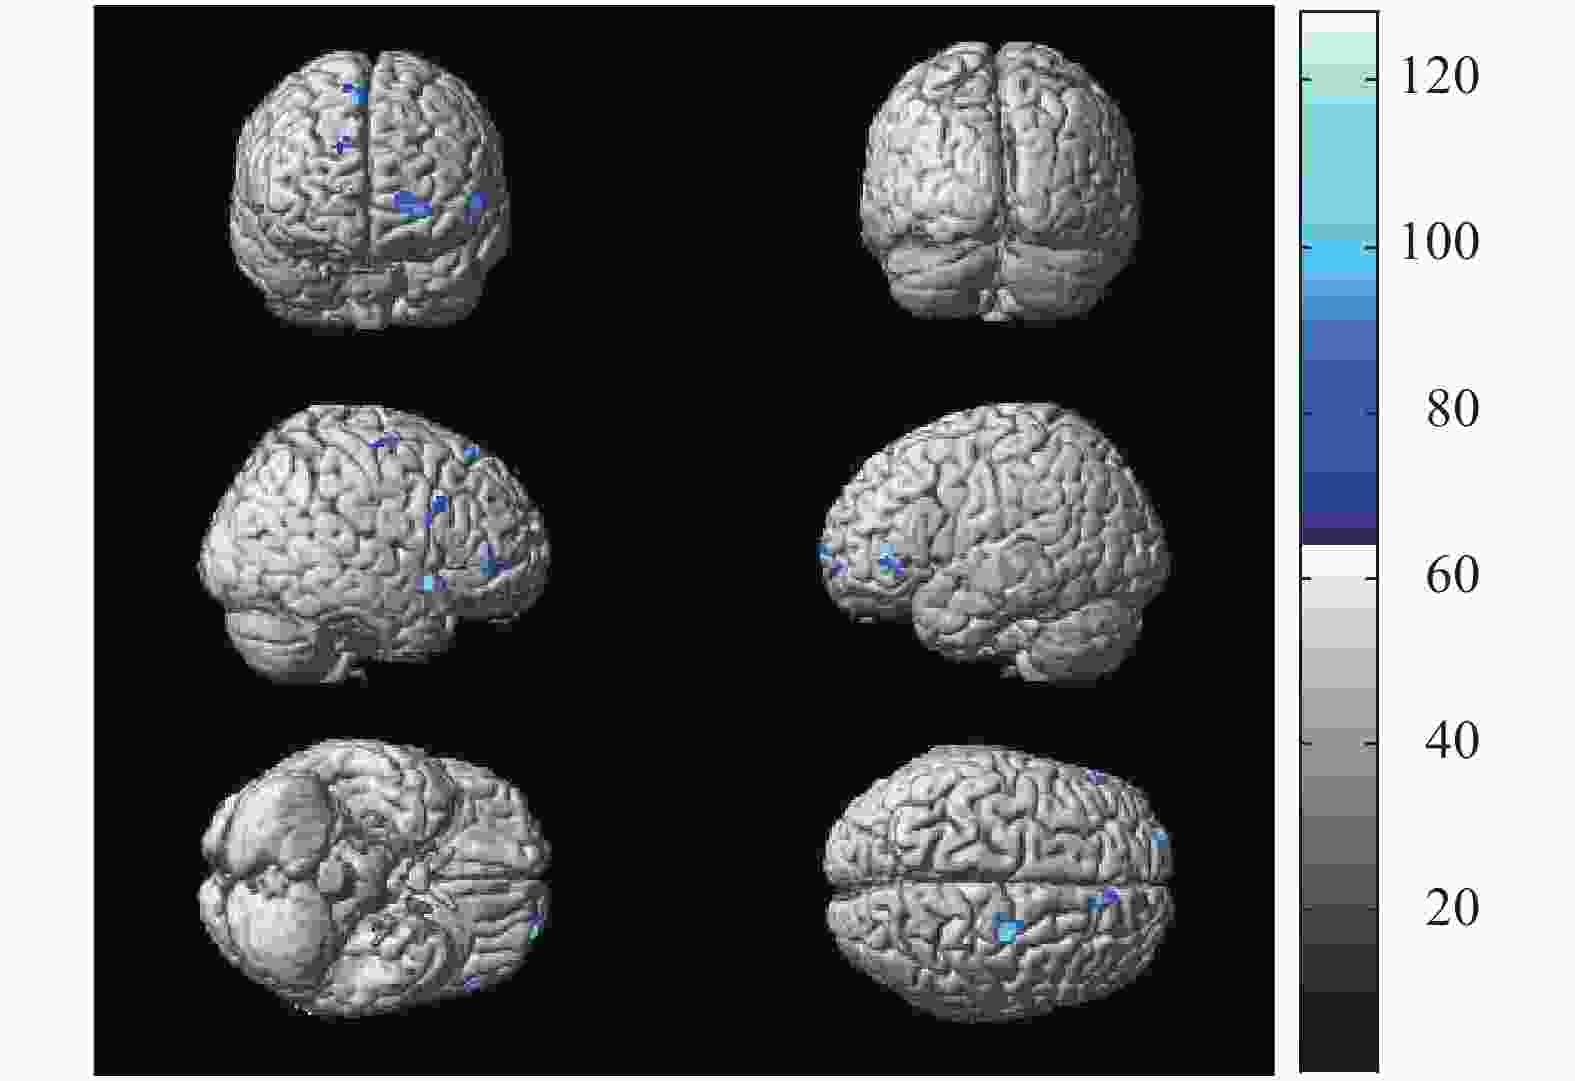
图 2 18例中度贫血患者与27例轻度贫血患者比较脑葡萄糖代谢减低区的统计参数图
Figure 2. The statistical parameter map of cerebral glucose metabolism decreased in 18 patients with moderate anemia compared with 27 mild anemia
脑功能区 Talairach坐标 体素数(个) t值 P值 X Y Z 左侧额下回 −60 34 0 195 5.58 <0.05 右侧额下回 58 52 2 207 5.86 <0.05 右侧额中回 24 −14 58 241 5.84 <0.05 右侧颞叶下回 52 12 −10 65 5.22 <0.05 右侧顶下小叶 24 −38 40 124 5.31 <0.05 表 3 18例中度贫血患者与27例轻度贫血患者比较脑葡萄 糖代谢的减低区
Table 3. Positions of the reduced glucose metabolism cerebral regions in 18 patients with moderate anemia compared with 27 mild anemia
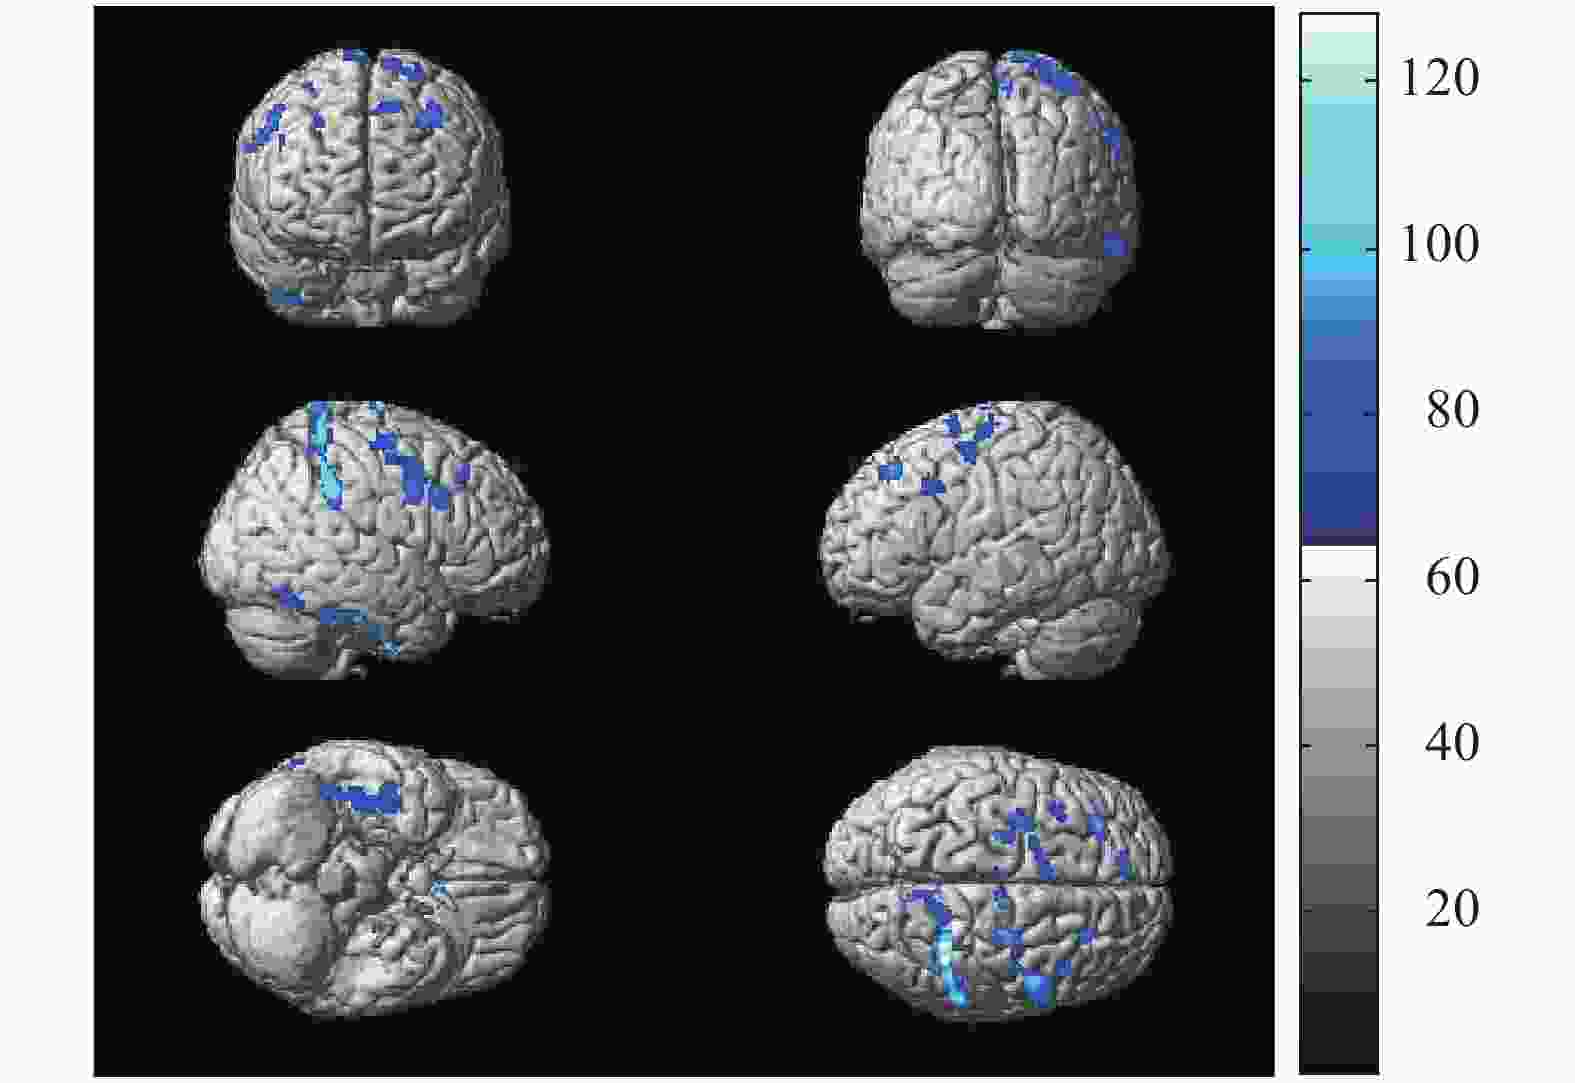
图 3 6例重度贫血患者与27例轻度贫血患者比较脑葡萄糖代谢减低区的统计参数图
Figure 3. The statistical parameter map of cerebral glucose metabolism decreased in 6 patients with severe anemia compared with 27 mild anemia
脑功能区 Talairach坐标 体素数(个) t值 P值 X Y Z 左侧额上回 −8 52 58 300 6.05 <0.05 左侧额中下回 −38 36 54 242 5.80 <0.05 右侧额上回 10 −14 82 126 5.54 <0.05 右侧额中下回 50 2 44 469 5.42 <0.05 右侧颞叶下回 46 −8 −50 351 5.80 <0.05 右侧顶下小叶 34 −46 62 346 5.73 <0.05 表 4 6例重度贫血患者与27例轻度贫血患者比较脑葡萄糖 代谢的减低区
Table 4. Positions of the reduced glucose metabolism cerebral regions in 6 patients with severe anemia compared with 27 mild anemia

图 4 6例重度贫血患者与18例中度贫血患者比较脑葡萄糖代谢减低区的统计参数图
Figure 4. The statistical parameter map of cerebral glucose metabolism decreased in 6 patients with severe anemia compared with 18 moderate anemia
脑功能区 Talairach坐标 体素数 t值 P值 X Y Z 左侧额上回 −26 −14 70 295 5.95 <0.05 左侧额中下回 −36 64 8 174 6.44 <0.05 右侧额中回 48 34 42 662 5.72 <0.05 右侧颞叶下回 74 −30 −28 325 5.92 <0.05 右侧顶下小叶 36 −44 62 142 6.48 <0.05 表 5 6例重度贫血患者与18例中度贫血患者比较脑葡萄糖 代谢的减低区
Table 5. Positions of the reduced glucose metabolism cerebral regions in 6 patients with severe anemia compared with 18 moderate anemia
-
贫血为一种慢性多系统累及性疾病,常有血液系统、神经系统、皮肤黏膜、循环系统、消化系统及内分泌系统等的临床表现。贫血早期常无相关临床症状或症状较轻,随着贫血程度加重,可逐渐出现各种症状,其中神经系统症状在贫血患者中比较常见且出现较早。脑组织对氧的需求量大且耐受能力远远低于其他器官,大脑重量只占人体重的2%左右,但其需氧量却占人体总需氧量的20%~25%[7],导致脑组织对缺氧十分敏感。而贫血患者由于脑组织供氧不足,容易造成神经系统功能损害,出现精神及神经症状。国内外大规模人群流行病学的研究结果显示,贫血与部分患者出现的抑郁[8-9]及认知能力下降[10-11]之间具有一定的相关性,基于此,相关学者利用神经影像学方法对贫血患者的大脑结构改变进行研究。Choi等[12]利用MRI发现贫血患者较正常对照者的脑白质体积萎缩,并与贫血严重程度呈正相关,而且贫血时脑白质体积萎缩与认知功能下降有关;Wolters等[13]使用弥散张量成像对贫血患者脑白质结构连通性的研究结果显示,脑白质纤维平均弥散率升高,这表明贫血时大脑结构连通性降低,同时还发现贫血时脑灌注与血红蛋白浓度呈负相关,推测贫血患者脑白质完整性及血流灌注的改变可能会导致患精神类疾病风险的增加。但查阅文献,尚未发现有贫血引起的脑代谢改变的研究,而本研究通过对51例贫血患者脑18F-FDG代谢改变的分析,研究贫血患者脑代谢改变的特点,进一步诠释贫血患者的脑损害特点及神经系统症状的发生机制,对临床诊治研究提供帮助。
本研究中贫血患者与健康对照者的性别构成差异有统计学意义,51例贫血患者中女性占比明显高于男性,这主要与女性妊娠、哺乳、月经生理周期及雄激素水平低于男性等因素相关[14]。
本研究结果显示,与健康对照者相比,贫血患者静息状态下脑葡萄糖代谢改变表现为多区域脑皮质葡萄糖代谢减低,未见明显代谢性增高区。代谢性减低区主要包括双侧额叶上、中、下回,右侧颞叶下回,右侧顶下小叶。分析贫血患者出现脑代谢减低的原因如下:(1)18F-FDG PET脑代谢显像是利用葡萄糖的同分异构体18F-FDG模拟天然葡萄糖在脑内代谢的全过程,获得较精确的脑内代谢分布影像[15]。贫血时由于外周血单位体积血红蛋白浓度、红细胞总数下降,血液携氧能力降低,使脑组织能够获得的氧减少,而脑组织的能量消耗全部来源于葡萄糖的有氧氧化。因此,贫血引起的脑组织缺氧会导致脑内代谢水平减低。(2)可能由于贫血时代偿性血流速度增快使脑组织与血液中物质交换能力减弱,导致其从血液中摄取氧及葡萄糖等物质的能力下降。贫血时引起的缺氧会使人体代偿反应机制发生作用,增加对于心、脑等重要器官的血液供应,使脑血流速度较正常人增加[16],以此来向大脑输送更多的氧气。但也有数项研究结果显示,虽然贫血时脑代偿性的血流增加,但与健康对照者相比,贫血时患者脑氧输送仍低于正常[17-18]。(3)贫血引起的炎症反应等使脑组织受损,导致其神经元代谢活动减低,神经传导通路受损;且贫血时儿茶酚胺和乙酰胆碱等多种神经递质的代谢降低,使脑组织中多巴胺受体数目和灵敏度下降,同时多巴胺合成减少,这也干扰了大脑的正常氧化代谢[19]。(4)可能与贫血引起的缺氧及随后的灌注增加[13]导致脑组织损伤,使脑组织出现代谢功能障碍有关。由于脑组织对缺氧十分敏感,贫血后造成的缺氧容易使脑组织损伤,随后机体代偿性的灌注增加可能会引起组织或细胞发生过氧化等进一步加重脑组织损伤,导致脑组织葡萄糖代谢能力下降,在PET图像上就表现为代谢减低区。通过轻度、中度、重度不同程度贫血患者之间的比较发现,随着贫血严重程度的增加,代谢减低区逐渐增多,且贫血时最易受累的脑区为额叶和小部分颞叶、顶叶。这也与以往研究中得出的贫血主要引起额、颞、顶叶处的脑白质体积萎缩,且脑白质体积萎缩程度与贫血严重程度呈正比的结果相符[12]。额、颞、顶叶是大脑发育中的高级皮质区域,在情绪加工、认知调节、执行控制等过程中均发挥重要作用[20]。而本研究结果显示,贫血患者额、颞、顶叶处葡萄糖代谢减低,提示这部分脑区神经元活动性下降,神经传导通路也可能受损,从而可能会导致贫血时患者出现抑郁及认知障碍等风险的增加。PET脑代谢显像可以从细胞及分子水平发现脑葡萄糖代谢差异,进而反映出相关脑区神经元活性的改变,这有助于早期发现贫血患者脑损伤改变,且能为临床贫血患者出现的抑郁及认知障碍等提供分子影像学依据和可能的评价指标,为患者早期及时治疗提供帮助,提高患者的生活质量。
虽然本研究结果初步揭示了不同程度贫血患者静息状态下脑葡萄糖代谢的差异,但是也存在一定的缺陷。首先由于PET/CT费用昂贵,单纯贫血患者进行此项检查的例数较少,因此本研究的样本量较少,这可能导致结果在一定程度上的不确定性,尤其分组结果,也难以根据患者病因进行分组研究;其次本研究是回顾性研究,缺乏患者的行为学改变及相关认知或抑郁量表等相关数据,无法量化脑葡萄糖代谢改变与行为学改变的相关性。在以后的研究中,应进一步扩大样本量,对不同类型的贫血进行分类研究,进一步深入探讨贫血患者的脑损伤机制及其脑功能改变。
综上所述,本研究中我们发现,贫血患者静息脑代谢显像表现为涉及情感、认知功能区的葡萄糖代谢减低,且随着贫血程度的加重,代谢减低区的范围扩大。通过脑代谢显像能够发现贫血患者脑内代谢异常的改变,可为贫血伴发神经精神疾病的诊断提供依据。
利益冲突 本研究由署名作者按以下贡献声明独立开展,不涉及任何利益冲突。
作者贡献声明 孙强负责研究命题的提出与设计、研究过程的实施、数据的获取与处理分析、论文的撰写与修订;付畅、孙萌萌负责研究过程的指导与实施、数据的分析;李会强、尤阳、王珍珍负责研究过程的实施、数据的获取;轩昂负责协助研究的实施、数据的分析;徐俊玲负责指导研究设计的提出、数据的分析、最终版本的修订。
贫血患者大脑静息葡萄糖代谢改变的研究
Changes in resting-state brain glucose metabolism in patients with anemia
-
摘要:
目的 探讨不同程度贫血患者大脑静息状态下葡萄糖代谢改变的特点。 方法 回顾性分析2016年12月至2019年4月经郑州大学人民医院临床诊断为贫血的51例患者的脑部18F-氟脱氧葡萄糖(FDG)PET/CT影像资料,其中男性16例、女性35例,年龄21~60(41.13±9.78)岁。根据WHO和相关文献中的贫血诊断标准将患者分为轻度贫血(90 g/L~正常下限)、中度贫血(60~90 g/L)、重度贫血(30~60 g/L)3组。将56名同期行全身PET/CT检查的健康体检者作为对照组,其中男性29名、女性27名,年龄19~58(41.96±9.27)岁。采用统计参数图(SPM)8软件对贫血患者及健康对照者的PET图像进行处理与分析。分别将贫血患者与健康对照者,轻度、中度、重度贫血患者间的脑PET图像进行体素对体素的两独立样本t检验,得到各自组间的脑葡萄糖代谢差异分布图,同时利用xjView软件对差异有统计学意义的脑区进行立体定位分析及体素值定量分析,得出各异常区域的t值。 结果 与健康对照者比较,贫血患者脑PET图像表现为区域性大脑静息葡萄糖代谢减低,累及的脑区包括双侧额上、中、下回,右侧颞叶下回和右侧顶下小叶,未见明显代谢增高脑区,总体素数为3705个(t=5.01~5.85,均P<0.05)。与轻度贫血患者比较,中度贫血患者脑代谢减低区见于双侧额下回、右侧额中回、右侧颞叶下回和右侧顶下小叶,总体素数为832个(t=5.22~5.86,均P<0.05);重度贫血患者脑代谢减低区见于双侧额上回、双侧额中下回、右侧颞叶下回和右侧顶下小叶,总体素数为1834个(t=5.42~6.05, 均P<0.05)。与中度贫血患者比较,重度贫血患者脑代谢减低区见于左侧额上回、左侧额中下回、右侧额中回、右侧颞叶下回和右侧顶下小叶,总体素数为1598个(t=5.72~6.48,均P<0.05)。 结论 贫血患者大脑静息状态下葡萄糖代谢改变以区域性葡萄糖代谢减低为主,代谢减低区多涉及情感、认知等相关的脑区,且随着贫血程度的加重,脑代谢减低区的范围扩大。 -
关键词:
- 贫血 /
- 氟脱氧葡萄糖F18 /
- 正电子发射断层显像术 /
- 体层摄影术,X线计算机 /
- 大脑 /
- 葡萄糖代谢
Abstract:Objective To investigate changes in resting glucose metabolism in the brain of patients with anemia of different degrees. Methods The brain 18F-fluorodeoxyglucose (FDG) PET/CT imaging data of 51 patients who were clinically diagnosed with anemia in People's Hospital of Zhengzhou University from December 2016 to April 2019 were retrospectively analyzed. The study population included 16 males and 35 females aged 21−60 (41.13±9.78) years. According to the diagnostic criteria of anemia in WHO and relevant literature, the patients were divided into 3 groups: mild anemia (90 g/L–lower limits of normal), moderate anemia (60–90 g/L) and severe anemia (30−60 g/L). A total of 56 healthy physical examiners were recruited as controls; this group included 29 males and 27 females aged 19–58 (41.96±9.27) years. Statistical Parametric Mapping 8 software was used to process and analyze the PET images of anemia group and healthy controls. The brain PET images of all anemia groups and the control group were tested by voxel-to-voxel two-sample t-test to obtain difference distribution maps of brain PET metabolism between each group. XjView software was used to conduct stereotaxic and quantitative analyses of voxel values in brain regions reflecting statistical differences. The t values of all abnormal regions were obtained. Results Compared with those in the control group, hypometabolic brain areas in patients with anemia were mainly distributed in the bilateral superior, middle, and inferior frontal gyri; the right inferior temporal gyri; and the right inferior parietal lobule gyri, the total voxel value was 3705 (t=5.01–5.85, all P<0.05). Hypermetabolic areas were not observed in anemia patients. Compared with that in the mild group, hypometabolism in the moderate group was observed in the bilateral inferior frontal, right middle frontal, right inferior temporal gyri, and the right inferior parietal lobule gyri, the total voxel value was 832 (t=5.22–5.86, all P<0.05). Hypometabolism in the severe group was observed in the bilateral superior frontal, bilateral middle-inferior frontal, right inferior temporal, and right inferior parietal lobule gyri, the total voxel value was 1834 (t=5.42–6.05, all P<0.05). Compared with that in the moderate group, hypometabolism in the severe group was noted in the left superior frontal, left middle-inferior frontal, and right middle frontal gyri, right inferior temporal lobe, and right inferior parietal lobule gyri, the total voxel value was 1598 (t=5.72–6.48, all P<0.05). Conclusions Patients with anemia showed relative reductions in regional cerebral resting glucose metabolism. The cerebral regions demonstrating reduced metabolism were mainly related to emotion cognition. As anemia progressed, areas reflecting a decrease in cerebral metabolism increased. -
图 1 51例贫血患者与56名健康对照者比较脑葡萄糖代谢减低区的统计参数图 蓝色所示代谢减低区为双侧额上、中、下回,右侧颞叶下回和右侧顶下小叶
Figure 1. The statistical parameter map of cerebral glucose metabolism decreased in 51 patients with anemia compared with 56 normal controls
图 2 18例中度贫血患者与27例轻度贫血患者比较脑葡萄糖代谢减低区的统计参数图
Figure 2. The statistical parameter map of cerebral glucose metabolism decreased in 18 patients with moderate anemia compared with 27 mild anemia
图 3 6例重度贫血患者与27例轻度贫血患者比较脑葡萄糖代谢减低区的统计参数图
Figure 3. The statistical parameter map of cerebral glucose metabolism decreased in 6 patients with severe anemia compared with 27 mild anemia
图 4 6例重度贫血患者与18例中度贫血患者比较脑葡萄糖代谢减低区的统计参数图
Figure 4. The statistical parameter map of cerebral glucose metabolism decreased in 6 patients with severe anemia compared with 18 moderate anemia
表 1 贫血患者的一般资料和血红蛋白浓度
Table 1. General data and hemoglobin concentration in anemia patients
贫血程度 性别 例数 年龄(岁) 血红蛋白浓度(g/L) 轻度贫血 男 9 30~55(39.67±8.41) 94~118(108.25±10.57) 女 18 21~60(38.33±14.99) 92~107(99.26±4.72) 中度贫血 男 5 31~54(46.80±9.31) 68~86(80.80±7.29) 女 13 22~55(41.62±10.22) 70~85(77.85±5.93) 重度贫血 男 2 47~52(49.50±3.54) 43~52(47.50±6.36) 女 4 22~50(37.25±13.89) 42~56(50.50±6.45)  下载: 导出CSV
表 2 51例贫血患者与56名健康对照者比较脑葡萄糖代谢 的减低区
Table 2. Positions of the reduced glucose metabolism cerebral regions in 51 patients with anemia compared with 56 normal controls
脑功能区 Talairach坐标 体素数(个) t值 P值 X Y Z 左侧额上回 −24 64 −8 88 5.56 <0.05 左侧额中下回 −32 8 48 591 5.74 <0.05 右侧额上回 26 32 48 115 5.53 <0.05 右侧额中回 36 −10 50 1299 5.01 <0.05 右侧额下回 52 10 4 375 5.69 <0.05 右侧颞叶下回 68 −64 −6 736 5.85 <0.05 右侧顶下小叶 40 −42 42 501 5.62 <0.05
下载: 导出CSV
表 3 18例中度贫血患者与27例轻度贫血患者比较脑葡萄 糖代谢的减低区
Table 3. Positions of the reduced glucose metabolism cerebral regions in 18 patients with moderate anemia compared with 27 mild anemia
脑功能区 Talairach坐标 体素数(个) t值 P值 X Y Z 左侧额下回 −60 34 0 195 5.58 <0.05 右侧额下回 58 52 2 207 5.86 <0.05 右侧额中回 24 −14 58 241 5.84 <0.05 右侧颞叶下回 52 12 −10 65 5.22 <0.05 右侧顶下小叶 24 −38 40 124 5.31 <0.05
下载: 导出CSV
表 4 6例重度贫血患者与27例轻度贫血患者比较脑葡萄糖 代谢的减低区
Table 4. Positions of the reduced glucose metabolism cerebral regions in 6 patients with severe anemia compared with 27 mild anemia
脑功能区 Talairach坐标 体素数(个) t值 P值 X Y Z 左侧额上回 −8 52 58 300 6.05 <0.05 左侧额中下回 −38 36 54 242 5.80 <0.05 右侧额上回 10 −14 82 126 5.54 <0.05 右侧额中下回 50 2 44 469 5.42 <0.05 右侧颞叶下回 46 −8 −50 351 5.80 <0.05 右侧顶下小叶 34 −46 62 346 5.73 <0.05
下载: 导出CSV
表 5 6例重度贫血患者与18例中度贫血患者比较脑葡萄糖 代谢的减低区
Table 5. Positions of the reduced glucose metabolism cerebral regions in 6 patients with severe anemia compared with 18 moderate anemia
脑功能区 Talairach坐标 体素数 t值 P值 X Y Z 左侧额上回 −26 −14 70 295 5.95 <0.05 左侧额中下回 −36 64 8 174 6.44 <0.05 右侧额中回 48 34 42 662 5.72 <0.05 右侧颞叶下回 74 −30 −28 325 5.92 <0.05 右侧顶下小叶 36 −44 62 142 6.48 <0.05
下载: 导出CSV
-
[1] Buttarello M. Laboratory diagnosis of anemia: are the old and new red cell parameters useful in classification and treatment, how?[J]. Int J Lab Hematol, 2016, 38(Suppl1): S123−132. DOI: 10.1111/ijlh.12500. [2] Ganz T. Anemia of inflammation[J]. N Engl J Med, 2019, 381(12): 1148−1157. DOI: 10.1056/NEJMra1804281. [3] 马藤, 轩昂, 张杰, 等. 2型糖尿病患者大脑静息葡萄糖代谢改变研究[J]. 国际放射医学核医学杂志, 2018, 42(1): 25−29. DOI: 10.3760/cma.j.issn.1673-4114.2018.01.005.
Ma T, Xuan A, Zhang J, et al. Changes in resting-state brain glucose metabolism in patients with type 2 diabetes[J]. Int J Radiat Med Nucl Med, 2018, 42(1): 25−29. DOI: 10.3760/cma.j.issn.1673-4114.2018.01.005.[4] 孙萌萌, 付畅, 史大鹏, 等. 不同分期肺腺癌患者大脑静息葡萄糖代谢改变研究[J]. 国际放射医学核医学杂志, 2015, 39(6): 437−441, 446. DOI: 10.3760/cma.j.issn.1673-4114.2015.06.001.
Sun MM, Fu C, Shi DP, et al. Preliminary study of metabolic changes in brain glucose of patients with lung adenocarcinoma[J]. Int J Radiat Med Nucl Med, 2015, 39(6): 437−441, 446. DOI: 10.3760/cma.j.issn.1673-4114.2015.06.001.[5] World Health Organization. Nutritional anaemias: report of a WHO scientific group[J]. World Health Organ Tech Rep Ser, 1968, 405: 5−37. [6] 陈灏珠, 林果为, 王吉耀. 实用内科学[M]. 14版. 北京: 人民卫生出版社, 2013: 2308−2312.
Chen HZ, Lin GW, Wang JY. Practice of internal medicine[M]. 14th ed. Beijing: People's Medical Publishing House, 2013: 2308−2312.[7] Kisilevsky A, Gelb AW, Bustillo M, et al. Anaemia and red blood cell transfusion in intracranial neurosurgery: a comprehensive review[J]. Br J Anaesth, 2018, 120(5): 988−998. DOI: 10.1016/j.bja.2017.11.108. [8] Vulser H, Wiernik E, Hoertel N, et al. Association between depression and anemia in otherwise healthy adults[J]. Acta Psychiatr Scand, 2016, 134(2): 150−160. DOI: 10.1111/acps.12595. [9] Shafi M, Taufiq F, Mehmood H, et al. Relation between depressive disorder and iron deficiency anemia among adults reporting to a secondary healthcare facility: a hospital-based case control study[J]. J Coll Physicians Surg Pak, 2018, 28(6): 456−459. DOI: 10.29271/jcpsp.2018.06.456. [10] Dlugaj M, Winkler A, Weimar C, et al. Anemia and mild cognitive impairment in the german general population[J]. J Alzheimers Dis, 2016, 49(4): 1031−1042. DOI: 10.3233/JAD-150434. [11] Qin TT, Yan MM, Fu Z, et al. Association between anemia and cognitive decline among Chinese middle-aged and elderly: evidence from the China health and retirement longitudinal study[J/OL]. BMC Geriatr, 2019, 19(1): 305[2020-05-13]. https://pubmed.ncbi.nlm.nih.gov/31718564. DOI: 10.1186/s12877-019-1308-7. [12] Choi S, O'Neil SH, Joshi AA, et al. Anemia predicts lower white matter volume and cognitive performance in sickle and non-sickle cell anemia syndrome[J]. Am J Hematol, 2019, 94(10): 1055−1065. DOI: 10.1002/ajh.25570. [13] Wolters FJ, Zonneveld HI, Licher S, et al. Hemoglobin and anemia in relation to dementia risk and accompanying changes on brain MRI[J]. Neurology, 2019, 93(9): e917−e926. DOI: 10.1212/WNL.0000000000008003. [14] 马秋月, 张世琨, 刘珏, 等. 2012年中国农村育龄妇女贫血状况调查[J]. 中华医学杂志, 2018, 98(26): 2115−2119. DOI: 10.3760/cma.j.issn.0376-2491.2018.26.011.
Ma QY, Zhang SK, Liu Y, et al. Anemia status of Chinese rural women of reproductive age in 2012[J]. Natl Med J China, 2018, 98(26): 2115−2119. DOI: 10.3760/cma.j.issn.0376-2491.2018.26.011.[15] 徐梅, 牛荣, 邵小南, 等. Scenium软件研究不同性别正常人脑葡萄糖代谢随年龄变化的规律[J]. 中国医学影像学杂志, 2014, 22(9): 659−663. DOI: 10.3969/j.issn.1005-5185.2014.09.005.
Xu M, Niu R, Shao XN, et al. Change of human cerebral glucose metabolism with age and gender by using Scenium software[J]. Chin J Med Imaging, 2014, 22(9): 659−663. DOI: 10.3969/j.issn.1005-5185.2014.09.005.[16] Duffin J, Hare GMT, Fisher JA. A mathematical model of cerebral blood flow control in anaemia and hypoxia[J]. J Physiol, 2020, 598(4): 717−730. DOI: 10.1113/JP279237. [17] Zheng G, Wen JQ, Yu WK, et al. Anemia rather than hypertension contributes to cerebral hyperperfusion in young adults undergoing hemodialysis: a phase contrast MRI study[J/OL]. Sci Rep, 2016, 6(1): 22346[2020-05-13]. https://pubmed.ncbi.nlm.nih.gov/26923866. DOI: 10.1038/srep22346. [18] Hoiland RL, Bain AR, Rieger MG, et al. Hypoxemia, oxygen content, and the regulation of cerebral blood flow[J]. Am J Physiol Regul Integr Comp Physiol, 2016, 310(5): R398−R413. DOI: 10.1152/ajpregu.00270.2015. [19] 陈娜飞, 陈铁虎, 曲华. 贫血对老年患者认知功能的影响[J]. 实用医学杂志, 2013, 29(3): 418−420. DOI: 10.3969/j.issn.1006-5725.2013.03.029.
Chen NF, Chen TH, Qu H. The influence of anemia on congnitive function in elderly patients[J]. J Pract Med, 2013, 29(3): 418−420. DOI: 10.3969/j.issn.1006-5725.2013.03.029.[20] Liang X, Zou QH, He Y, et al. Coupling of functional connectivity and regional cerebral blood flow reveals a physiological basis for network hubs of the human brain[J]. Proc Natl Acad Sci U S A, 2013, 110(5): 1929−1934. DOI: 10.1073/pnas.1214900110. -

 点击查看大图
计量
- 文章访问数: 2278
- HTML全文浏览量: 1641
- PDF下载量: 15
