


-
阿尔茨海默病(Alzheimer disease,AD)是一种常见的神经退行性疾病,占痴呆总数的60%~80%,其给患者家庭及社会带来了沉重的负担[1]。AD的病理学特征为β淀粉样蛋白(amyloid-β protein,Aβ)沉积导致的老年斑、tau蛋白高度磷酸化引起的神经原纤维缠结以及其他神经退行性改变,如突触减少和神经元丢失[2]。目前,常用于AD诊断的脑脊液生物标志物包括反映脑Aβ沉积的Aβ42和Aβ40,以及反映皮层纤维原缠结的t-tau和p-tau,这些标志物对AD具有较高的诊断率,但其异常也可能在其他痴呆患者中出现[2-3]。研究结果表明,脑脊液中t-tau/Aβ42水平的比值(the level ratio of t-tau to Aβ42,t-tau/Aβ42)和Aβ42/Aβ40水平的比值(the level ratio of Aβ42 to Aβ40,Aβ42/Aβ40)相比单独的t-tau、p-tau、Aβ42和Aβ40可能是更为有效的AD诊断生物标志物[3-4]。此外,AD患者脑脊液中α突触核蛋白(α-synuclein,α-syn)的水平高于轻度认知障碍患者和健康者[5]。11C-匹兹堡化合物B(Pittsburgh compound-B,PIB)对纤维状Aβ具有高亲和力,是Aβ沉积的特异性标志物;11C-PIB PET/CT可提供不同临床阶段Aβ沉积的信息,并与尸检结果显示的Aβ沉积区域密切相关,故其可作为AD早期诊断的可靠影像学手段[6]。本研究经计算得出脑脊液生物标志物α-syn、Aβ40、Aβ42、t-tau、p-tau、t-tau/Aβ42和Aβ42/Aβ40诊断AD的最佳临界值,并分析它们与11C-PIB PET/CT显像诊断AD的准确率及相关性,探讨临床应用中最具预测性的脑脊液生物标志物,从而为AD的诊断提供参考。
-
选取2011年1月至2020年3月就诊于北部战区总医院的66名受试者的临床资料进行回顾性研究,其中男性32名、女性34名,年龄61~82(71.0±3.4)岁。根据诊断标准分为AD患者组(50例)和健康对照组(16名)。为保证研究结果的准确性和一致性,所有入组标准及量表评定均由2位精神科主治医师完成。AD组的纳入标准:参照美国国立神经病语言障碍卒中研究所AD及相关疾病协会制定的标准[7],①简易精神状态量表(mini-mental state examination,MMSE)评分<26分;②临床痴呆评定量表(clinical dementia rating,CDR)评分≥1分;③Hachinski缺血指数<4分。AD组的排除标准:①患有其他类型痴呆(如额叶痴呆或血管性痴呆);②患有严重精神疾病或长期服用大量抗精神病药物;③认知功能严重障碍不能配合检查。健康对照组的纳入标准:①MMSE评分>26分;②CDR评分=0分;③无认知功能障碍。健康对照组的排除标准:①患有中枢神经系统疾病;②患有严重精神疾病或长期服用大量抗精神病药物。
受试者或其家属均签署了知情同意书且经北部战区总医院伦理委员会批准,批准文号:第(2019)07。
-
使用美国GE公司的MINItrace回旋加速器和TRACElab FXc放射性药物合成装置,通过“反应瓶”法合成11C-PIB显像剂(原料购买于江苏华益科技有限公司),放射化学纯度>99%,药物经内毒素和热源检查均符合放射性药品的要求。所有受试者均进行11C-PIB PET/CT显像,使用美国GE公司的Discovery VCT PET/CT扫描仪。PET扫描参数:三维模式采集,轴向视野15.6 cm、轴向采样间隔3.27 mm、采样层厚3.75 mm,扫描范围从颅顶至颅底,显示视野25 cm、矩阵192×192。螺旋CT扫描参数:峰值电压120 kV、电流200 mA、螺距0.984、矩阵512×512。11C-PIB的注射剂量为3.7 MBq/kg,注射后40 min开始采集,连续采集20 min。
-
对PET图像进行衰减校正和数据迭代重建后与CT图像经Xeleris工作站同机融合得到横断面、冠状面和矢状面图像,由3位核医学科主任医师在隐去临床信息的情况下,采用手动勾画法在前扣带回、外侧颞叶、顶叶皮层和额叶皮层独立勾画ROI,并对图像进行分析评估,意见不一致时协商取得一致。以小脑皮质作为参考区域,计算平均Aβ沉积标准化摄取值比(standardized uptake value ratio,SUVR),以1.41为临界值,>1.41为阳性[8]。
-
所有受试者均在PET/CT显像前行腰椎穿刺收集脑脊液样本,使用美国Thermo Fisher公司的Multiskan FC酶标仪,采用酶联免疫吸附法检测脑脊液生物标志物α-syn、Aβ40、Aβ42、t-tau和p-tau的水平,计算t-tau/Aβ42和Aβ42/Aβ40。
-
采用SPSS18.0软件进行统计学分析。绘制脑脊液生物标志物的ROC曲线,确定其诊断AD的最佳临界值,并得出AUC、诊断AD的灵敏度和特异度。符合正态分布的计量资料用
$\bar x \pm s$ 表示,脑脊液生物标志物的组间比较采用独立样本t检验(方差齐);性别和诊断效能等计数资料的比较采用χ2检验。采用Pearson相关性分析评价脑脊液生物标志物与11C-PIB PET/CT的SUVR间的相关性,Kappa一致性检验分析脑脊液生物标志物与11C-PIB累积的一致性。Kappa值≥0.75为两者的一致性较好;0.4≤Kappa值<0.75为两者的一致性一般;Kappa值<0.4为两者的一致性较差。P<0.05为差异有统计学意义。 -
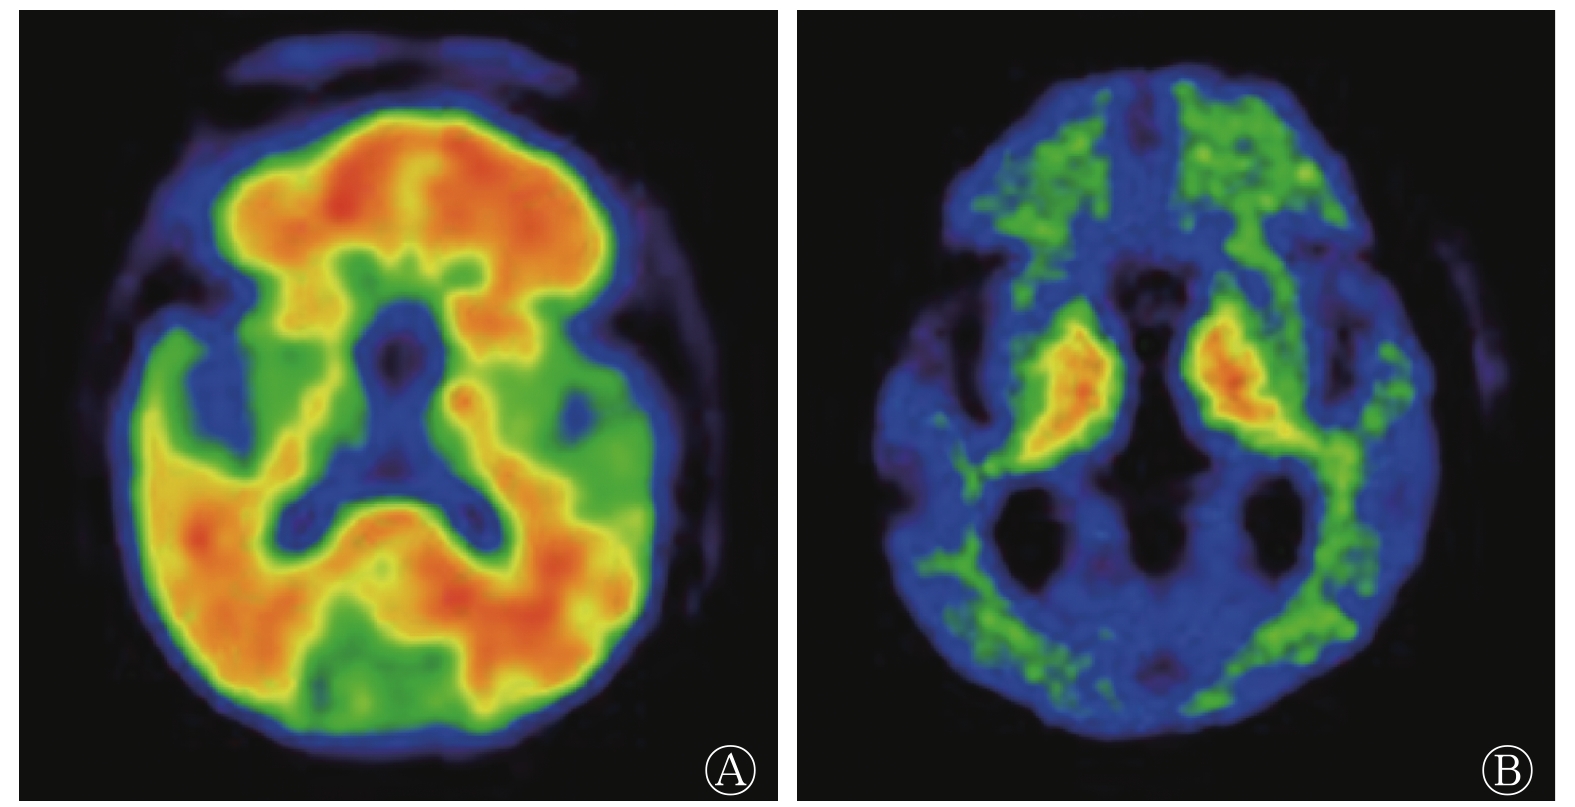
由表1可知,AD患者组和健康对照组在性别、年龄和教育年限方面的差异均无统计学意义(均P>0.05),组间具有同质性;2组受试者MMSE和CDR评分的差异均有统计学意义(均P<0.001);AD患者组脑脊液标志物α-syn、t-tau和p-tau水平及t-tau/Aβ42均高于健康对照组(均P<0.01),而Aβ42水平和Aβ42/Aβ40均低于健康对照组(均P<0.05);AD患者组11C-PIB PET/CT显像的阳性率为82.0%,其典型病例的图像见图1。
项目 AD患者组(n=50) 健康对照组(n=16) 检验值 P值 男性/女性(例) 26/24 6/10 χ2=1.020 0.312 年龄(岁) 70.0±4.8 71.0±5.7 t=2.668 0.612 教育年限(年) 7.1±6.4 8.4±6.1 t=3.021 0.505 CDR(分) 1.33±0.45 0 t=6.001 <0.001 MMSE(分) 20.1±3.8 29.3±2.1 t=3.986 <0.001 α-syn(pg/mL) 560±194 410±85 t=2.315 0.001 Aβ40(pg/mL) 9621±614 9897±1802 t=−4.223 0.082 Aβ42(pg/mL) 589±405 895±392 t=−5.443 0.020 t-tau(pg/mL) 679±302 345±102 t=4.001 0.008 p-tau(pg/mL) 99±41 55±22 t=2.336 <0.001 t-tau/Aβ42 1.061±0.697 0.262±0.137 t=3.291 <0.001 Aβ42/Aβ40 0.065±0.014 0.099±0.028 t=−3.487 0.013 11C-PIB PET/CT阳性率 82.0%(41/50) 12.5%(2/16) χ2=25.787 <0.001 注:α-syn、Aβ40、Aβ42、t-tau、p-tau均为脑脊液生物标志物。AD为阿尔茨海默病;CDR为临床痴呆评定量表;MMSE为简易精神状态量表;α-syn为α突触核蛋白;Aβ为β淀粉样蛋白;t-tau/Aβ42为t-tau/Aβ42水平的比值;Aβ42/Aβ40为Aβ42/Aβ40水平的比值;PIB为匹兹堡化合物B;PET为正电子发射断层显像术;CT为计算机体层摄影术 表 1 2组受试者临床资料的比较
Table 1. Comparison of clinical data in two groups

图 1 AD患者的典型11C-PIB PET/CT图
Figure 1. Typical 11C-Pittsburgh compound-B PET/CT image of patients with Alzheimer disease
-
由ROC曲线的AUC可判断脑脊液生物标志物对AD患者的诊断准确率,AUC越大,诊断准确率越高。脑脊液生物标志物对AD患者的诊断准确率由高到低依次为t-tau/Aβ42、Aβ42/Aβ40、α-syn、Aβ42、t-tau、p-tau和Aβ40。t-tau/Aβ42和Aβ42/Aβ40诊断AD的最佳临界值分别为0.509和0.072,α-syn诊断AD的最佳临界值为465 pg/mL(表2)。
脑脊液生物标志物 AUC 最佳临界值 灵敏度(%) 特异度(%) 95%CI P值 α-syn(pg/mL) 0.795 465 74.0 68.8 0.628~0.851 0.004 Aβ40(pg/mL) 0.601 8562 42.3 54.0 0.402~0.732 0.074 Aβ42(pg/mL) 0.703 623 70.1 68.5 0.613~0.823 0.010 t-tau(pg/mL) 0.644 542 57.8 82.9 0.496~0.805 0.006 p-tau(pg/mL) 0.621 62 72.9 48.1 0.499~0.791 0.009 t-tau/Aβ42 0.892 0.509 80.0 81.2 0.801~0.949 < 0.001 Aβ42/Aβ40 0.865 0.072 76.0 75.0 0.658~0.900 < 0.001 注:ROC为受试者工作特征;AUC为曲线下面积;CI为可变区间;α-syn为α突触核蛋白;Aβ为β淀粉样蛋白;t-tau/Aβ42为t-tau/Aβ42水平的比值;Aβ42/Aβ40为Aβ42/Aβ40水平的比值 表 2 脑脊液生物标志物ROC曲线的指标结果
Table 2. Index results of receiver opertor characteristic curve of cerebrospinal fluid biomarkers
-
由表2可知,t-tau/Aβ42、Aβ42/Aβ40和α-syn的诊断准确率较高,故分别分析三者与11C-PIB PET/CT显像联合诊断的价值。由表3可知,t-tau/Aβ42与11C-PIB PET/CT显像联合诊断的灵敏度和准确率均高于两者单独诊断(均P<0.05);Aβ42/Aβ40和α-syn分别与11C-PIB PET/CT显像联合诊断的灵敏度均高于其单独诊断(均P<0.05);其他各项指标的比较,差异均无统计学意义(均P>0.05)。
诊断项目 灵敏度(%) 特异度(%) 准确率(%) t-tau/Aβ42 80.0(40/50)a 81.2(13/16) 80.3a Aβ42/Aβ40 76.0(38/50)b 75.0(12/16) 75.8 α-syn 74.0(37/50)c 68.8(11/16) 72.7 11C-PIB PET/CT 78.0(39/50)abc 75.0(12/16) 77.2a 11C-PIB PET/CT+t-tau/Aβ42 96.0(48/50) 87.5(14/16) 93.9 11C-PIB PET/CT+Aβ42/Aβ40 94.0(47/50) 81.2(13/16) 90.9 11C-PIB PET/CT+α-syn 94.0(47/50) 75.0(12/16) 89.4 注:a表示与11C-PIB PET/CT+t-tau/Aβ42比较,灵敏度和准确率均较低(χ2=6.061、5.469、7.162、7.439,均P<0.05);b表示与11C-PIB PET/CT+Aβ42/Aβ40比较,灵敏度均较低(χ2=6.353、5.316,均P<0.05);c表示与11C-PIB PET/CT+α-syn比较,灵敏度均较低(χ2=7.440、5.316,均P<0.05)。PIB为匹兹堡化合物B;PET为正电子发射断层显像术;CT为计算机体层摄影术;t-tau/Aβ42为t-tau/Aβ42水平的比值;Aβ42/Aβ40为Aβ42/Aβ40水平的比值;Aβ为β淀粉样蛋白;α-syn为α突触核蛋白。t-tau、Aβ42、Aβ40和α-syn均为脑脊液生物标志物 表 3 脑脊液生物标志物、11C-PIB PET/CT及其联合诊断的效能
Table 3. The diagnostic efficacy of cerebrospinal fluid biomarkers, 11C-Pittsburgh compound-B PET/CT and their combined diagnosis
-
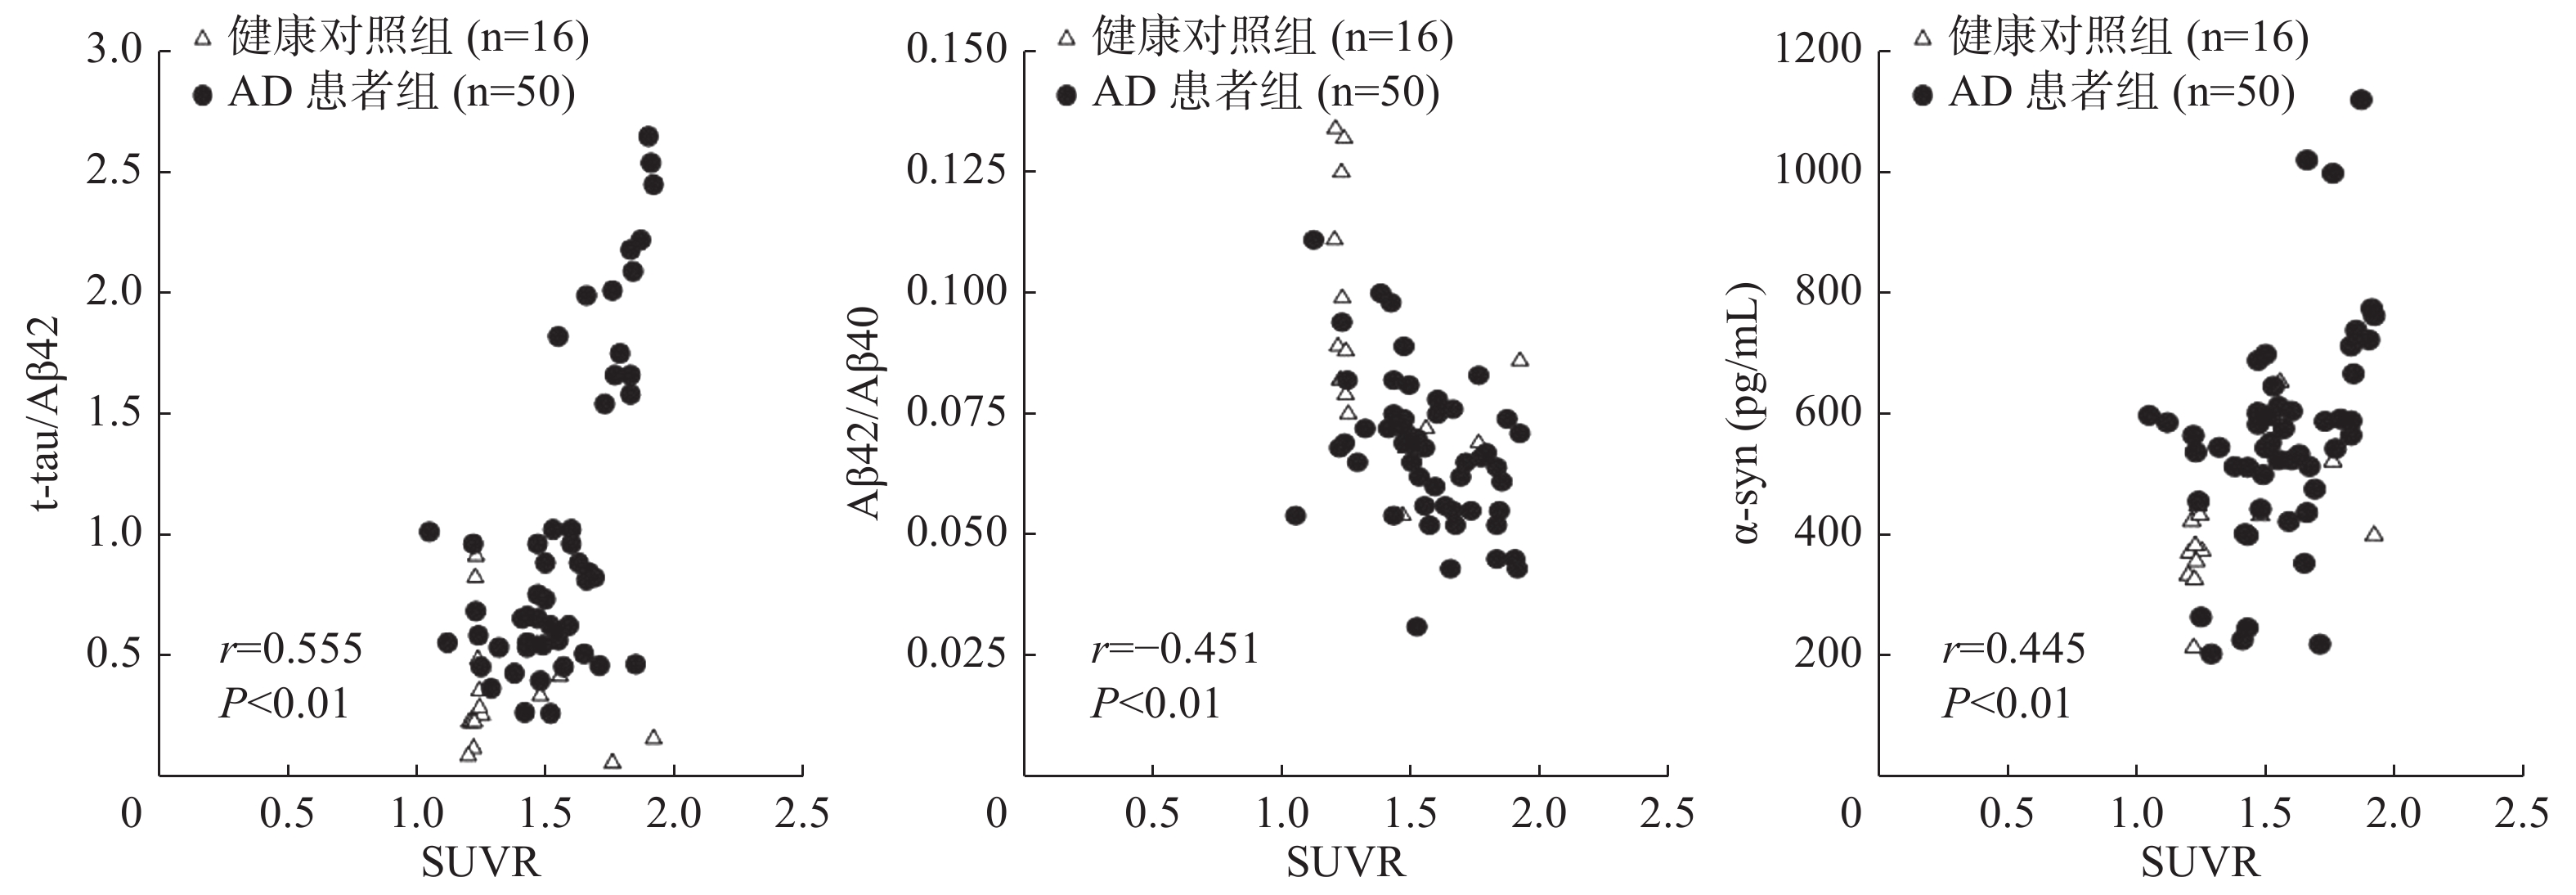
由图2可见,t-tau/Aβ42、Aβ42/Aβ40和α-syn与11C-PIB PET/CT显像的SUVR有显著相关性(r=0.555、−0.451、0.445,均P<0.01);t-tau/Aβ42、Aβ42/Aβ40和α-syn与11C-PIB PET/CT诊断一致性的Kappa值分别为0.769、0.623、0.587,均P<0.001,其中t-tau/Aβ42与11C-PIB PET/CT诊断的一致性较好;α-syn和Aβ42/Aβ40与11C-PIB PET/CT诊断的一致性一般。

图 2 脑脊液生物标志物与11C-PIB PET/CT的SUVR相关性分析的散点图
Figure 2. Scatter plot of correlation analysis between cerebrospinal fluid biomarkers and standardized uptake value ratio of 11C-Pittsburgh compound-B PET/CT
-
近十几年来,脑脊液生物标志物(如Aβ42、t-tau和p-tau)及11C-PIB PET/CT显像已广泛应用于神经退行性疾病的早期诊断。本研究分析了脑脊液生物标志物与11C-PIB PET/CT显像诊断AD的准确率及相关性,并得出了脑脊液生物标志物诊断AD的最佳临界值。
AD患者组脑脊液中t-tau、p-tau和α-syn水平以及t-tau/Aβ42均高于健康对照组;Aβ42水平和Aβ42/Aβ40均低于健康对照组,即AD患者脑脊液生物标志物的水平较健康对照者均表现出异常的升高或降低。本研究中AD患者的11C-PIB PET/CT显像阳性率为82.0%,这与以往研究中11C-PIB PET/CT显像阳性率65%~91.2%基本相符[9],部分患者出现11C-PIB PET/CT阴性结果可能是其Aβ沉积的形式不典型所致。同时,认知功能正常的老年人中有2例表现为11C-PIB PET/CT阳性,有研究结果显示,此类人群可能处于AD的临床前期[9-10]。Duits等[11]的研究结果显示,t-tau/Aβ42的最佳临界值在0.5~0.6范围内,且临界值为0.52时有最高的诊断灵敏度和特异度,其变化范围较其他脑脊液生物标志物窄,是目前可靠的诊断AD的生物标志物。一项在小样本人群中采用18F-florbetapir PET显像探究脑脊液生物标志物最佳临界值的研究结果表明,tau/Aβ42可作为Aβ沉积的有效预测因子[12]。本研究结果显示,t-tau/Aβ42的AUC为0.892,最佳临界值为0.509,诊断的灵敏度和特异度分别为80.0%和81.2%,其诊断的准确率最高;Aβ42/Aβ40的AUC为0.865,最佳临界值为0.072,诊断的灵敏度和特异度分别为76.0%和75.0%,其诊断的准确率仅次于t-tau/Aβ42;t-tau/Aβ42和Aβ42/Aβ40分别与11C-PIB PET/CT显像联合诊断的灵敏度均高于两者单独诊断,且t-tau/Aβ42与11C-PIB PET/CT诊断的一致性较好,Aβ42/Aβ40与11C-PIB PET/CT诊断的一致性一般。脑脊液标志物Aβ42/Aβ40能够客观反映Aβ42和Aβ40水平,使用Aβ42/Aβ40代替Aβ42使AD诊断的准确率显著升高[13]。一项多中心研究结果显示,脑脊液标志物Aβ42的最佳临界值在192~638 pg/mL内变化,其差异性很大[14],本研究中Aβ42的最佳临界值为623 pg/mL。这些差异可能是因为AD的诊断缺乏“金标准”,在确定最佳临界值的时候难免会权衡灵敏度和特异度,或由于现有的统计学方法存在一定的缺陷所致,也可能与样本量较小、患者接受PET/CT扫描时示踪剂到达大脑的剂量、患者运动产生的伪影、患者的脑萎缩程度以及脑Aβ缺乏有关[10]。脑脊液生物标志物t-tau/Aβ42和Aβ42/Aβ40与11C-PIB PET/CT的SUVR具有显著相关性,这表明t-tau/Aβ42和Aβ42/Aβ40能够较好地反映AD患者的Aβ沉积。Wang等[15]的研究结果也显示,t-tau/Aβ42能更好地区分AD患者和健康者,可作为临床中可靠的脑脊液生物标志物。Niemantsverdriet等[16]发现,在临床诊断AD时,使用Aβ42/Aβ40代替Aβ42可增加脑脊液Aβ与18F-AV45 PET/CT诊断的一致性。Hake等[17]的一项关于AD和轻度认知功能障碍的研究结果显示,18F-florbetapir PET/CT显像中前扣带回和后扣带回的SUVR与脑脊液标志物t-tau/Aβ42和Aβ42水平相关。
有研究结果显示,AD与大脑中不溶性的α-syn水平有关,α-syn与特定的突触前蛋白结合可直接参与神经递质的释放,细胞外增加的α-syn和tau蛋白与神经元丢失和磷酸化水平升高有关,最终可导致神经原纤维缠结,其被认为是一种反映突触退行性病变和神经元死亡的生物标志物[18]。本研究也发现,AD患者脑脊液标志物α-syn的AUC为0.795,最佳临界值为465 pg/mL,诊断的灵敏度和特异度分别为74.0%和68.8%,其可用于区分AD患者与健康者。α-syn与11C-PIB PET/CT显像联合诊断的灵敏度均高于两者单独诊断,且与11C-PIB PET/CT的SUVR呈正相关,与11C-PIB PET/CT诊断的一致性一般。动物实验结果表明,α-syn可协同诱导tau和Aβ纤维化[19]。也有研究结果表明,α-syn或可参与谷氨酸能神经元的传递,这可能与AD患者早期海马的萎缩相关,且α-syn和tau蛋白在神经退行性病变方面可能存在协同作用[18]。
综上所述,本研究结果表明,脑脊液生物标志物t-tau/Aβ42和Aβ42/Aβ40与11C-PIB PET/CT联合使用可提高对AD诊断的准确率。同时,脑脊液标志物α-syn可能与AD的病理机制密切相关,可作为潜在的AD诊断生物标志物。
利益冲突 本研究由署名作者按以下贡献声明独立开展,不涉及任何利益冲突。
作者贡献声明 武晓丹负责资料的选取,数据的分析、论文的撰写与修改;战莹负责数据的统计学分析;郭佳负责图像的处理;陈宇峰负责药物的合成;郝珊瑚负责资料的选取、数据的统计;张国旭负责研究的选题与设计;王治国负责研究的选题与设计、方案的建立、论文的审阅。
脑脊液生物标志物与11C-PIB PET/CT显像对阿尔茨海默病的诊断准确率及相关性研究
Diagnostic accuracy and correlation between cerebrospinal fluid biomarkers and 11C-PIB PET/CT imaging in Alzheimer disease
-
摘要:
目的 探讨脑脊液生物标志物与11C-匹兹堡化合物B(PIB)PET/CT显像在阿尔茨海默病(AD)中的诊断准确率及相关性,确定脑脊液生物标志物诊断AD的最佳临界值。 方法 回顾性分析2011年1月至2020年3月在北部战区总医院行11C-PIB PET/CT显像和腰椎穿刺的66名受试者的临床资料,其中男性32名、女性34名,年龄61~82(71.0±3.4)岁。根据诊断标准分为AD患者组(50例)和健康对照组(16名)。采用酶联免疫吸附测定法检测脑脊液生物标志物α突触核蛋白(α-syn)、β淀粉样蛋白(Aβ)40、Aβ42、t-tau、p-tau水平,并计算t-tau/Aβ42水平的比值(t-tau/Aβ42)、Aβ42/Aβ40水平的比值(Aβ42/Aβ40)。采用受试者工作特征(ROC)曲线分析脑脊液生物标志物诊断AD的最佳临界值、灵敏度和特异度。分析11C-PIB PET/CT图像,计算平均Aβ沉积标准化摄取值比(SUVR),分析2组受试者脑脊液生物标志物与11C-PIB PET/CT显像诊断AD的准确率及相关性。2组间脑脊液生物标志物水平的比较采用独立样本t检验,计数资料的比较采用χ2检验,相关性采用Pearson相关性分析,一致性分析采用Kappa检验。 结果 AD患者组脑脊液生物标志物α-syn、t-tau、p-tau水平及t-tau/Aβ42均高于健康对照组(t=2.315、4.001、2.336、3.291,均P<0.01),而Aβ42水平和Aβ42/Aβ40均低于健康对照组(t=−5.443、−3.487,均P<0.05)。t-tau/Aβ42诊断AD的准确率最高(AUC=0.892,P<0.001),其次为Aβ42/Aβ40和α-syn(AUC=0.865、0.795,均P<0.01)。t-tau/Aβ42和Aβ42/Aβ40诊断AD的最佳临界值分别为0.509和0.072,α-syn诊断AD的最佳临界值为465 pg/mL。t-tau/Aβ42、Aβ42/Aβ40、α-syn和11C-PIB PET/CT显像诊断的灵敏度分别为80.0%(40/50)、76.0%(38/50)、74.0%(37/50)和78.0%(39/50),前三者分别与后者联合诊断AD的灵敏度为96.0%(48/50)、94.0%(47/50)和94.0%(47/50),均高于其单独诊断(χ2=5.316~7.440,均P<0.05);t-tau/Aβ42与11C-PIB PET/CT显像联合诊断的准确率均高于其单独诊断(93.9%对80.3%,93.9%对77.2%),且差异有统计学意义(χ2=5.469、7.439,均P<0.05)。t-tau/Aβ42、Aβ42/Aβ40和α-syn与11C-PIB PET/CT显像的SUVR有显著相关性(r=0.555、−0.451、0.445,均P<0.01);t-tau/Aβ42、Aβ42/Aβ40和α-syn与11C-PIB PET/CT显像诊断一致性的Kappa值分别为0.769、0.623、0.587,均P<0.001,其中t-tau/Aβ42与11C-PIB PET/CT显像诊断的一致性较好。 结论 t-tau/Aβ42、Aβ42/Aβ40和α-syn均为理想的AD诊断标准,结合11C-PIB PET/CT显像可提高对AD诊断的准确率。 -
关键词:
- 阿尔茨海默病 /
- 淀粉样蛋白 /
- tau蛋白质类 /
- 正电子发射断层显像术 /
- 体层摄像术,X线计算机 /
- 11C-匹兹堡化合物B
Abstract:Objective To investigate the diagnostic accuracy and correlation between cerebrospinal fluid biomarkers and 11C-Pittsburgh compound-B (PIB) PET/CT imaging in Alzheimer disease (AD). The optimal cut-off values of cerebrospinal fluid biomarkers are also determined. Methods The clinical data of 66 subjects who underwent 11C-PIB PET/CT imaging and lumbar puncture at the General Hospital of Northern Theater Command from January 2011 to March 2020 were retrospectively analyzed. The participants included 32 males and 34 females aged 61–82 (71.0±3.4) years and were divided into the AD patient group (n=50) and the healthy control group (n=16) according to established criteria. Enzyme-linked immunosorbent assay was used to detect levels of the cerebrospinal fluid biomarkers α-synuclein (α-syn), β-amyloid (Aβ) 40, Aβ42, t-tau and p-tau. The level ratios of t-tau to Aβ42 (t-tau/Aβ42) and Aβ42 to Aβ40 (Aβ42/Aβ40) were calculated. The receiver operator characteristic (ROC) curve was used to analyze the diagnostic optimal cut-off value, sensitivity, and specificity of the cerebrospinal fluid biomarkers. 11C-PIB PET/CT images were analyzed. The average Aβ deposition standardized uptake value ratio (SUVR) was calculated, and the accuracy and correlation between the two groups of cerebrospinal fluid biomarkers and 11C-PIB PET/CT imaging in the diagnosis of AD were analyzed. The levels of cerebrospinal fluid biomarkers between the two groups was compared by independent-sample t test, and the count data were compared by χ2 test. Pearson correlation coefficients were calculated for correlation analysis, and consistency was determined using the Kappa test. Results The levels of cerebrospinal fluid biomarkers α-syn, t-tau andp-tau as well as t-tau/Aβ42 in the AD patient group were higher than those in the healthy control group (t=2.315, 4.001, 2.336, 3.291, all P<0.01), while the Aβ42 level and Aβ42/Aβ40 were lower than those in the healthy control group (t=−5.443, −3.487, both P<0.05). T-tau/Aβ42 revealed the highest diagnostic accuracy for AD (AUC=0.892, P<0.001), followed by Aβ42/Aβ40 and α-syn (AUC=0.865, 0.795, both P<0.01). The optimal cut-off values of t-tau/Aβ42 and Aβ42/Aβ40 were 0.509 and 0.072, respectively, and the aptimal cut-off value of α-syn was 465 pg/mL. The sensitivities of t-tau/Aβ42, Aβ42/Aβ40, α-syn and 11C-PIB PET/CT imaging for predicting AD were 80.0% (40/50), 76.0% (38/50), 74.0% (37/50) and 78.0% (39/50), respectively. The sensitivities of the first three methods in combination with 11C-PIB PET/CT imaging for predicting AD were 96.0% (48/50), 94.0% (47/50) and 94.0% (47/50), respectively, which were all higher than a single method (χ2=5.316–7.440, all P<0.05). The combined diagnostic accuracy of t-tau/Aβ42 and 11C-PIB PET/CT imaging was greater than that of a single diagnostic method (93.9% vs. 80.3%, 93.9% vs. 77.2%), and the difference noted was statistically significant (χ2=5.469, 7.439, both P<0.05). T-tau/Aβ42, Aβ42/Aβ40 and α-syn level were significantly correlated with 11C-PIB PET/CT SUVR (r=0.555, −0.451, 0.445, all P<0.01). The Kappa value of diagnostic consistencies of t-tau/Aβ42, Aβ42/Aβ40 and α-syn with 11C-PIB PET/CT imaging were 0.769, 0.623 and 0.587, respectively (all P<0.001). Among the criteria considered, t-tau/Aβ42 demonstrated great diagnostic consistency with 11C-PIB PET/CT. Conclusions T-tau/Aβ42, Aβ42/Aβ40 and α-syn are ideal diagnostic criteria for AD. Combining these parameters with 11C-PIB PET/CT imaging could improve the accuracy of AD diagnosis. -
图 1 AD患者的典型11C-PIB PET/CT图
Figure 1. Typical 11C-Pittsburgh compound-B PET/CT image of patients with Alzheimer disease
图 2 脑脊液生物标志物与11C-PIB PET/CT的SUVR相关性分析的散点图
Figure 2. Scatter plot of correlation analysis between cerebrospinal fluid biomarkers and standardized uptake value ratio of 11C-Pittsburgh compound-B PET/CT
表 1 2组受试者临床资料的比较
Table 1. Comparison of clinical data in two groups
项目 AD患者组(n=50) 健康对照组(n=16) 检验值 P值 男性/女性(例) 26/24 6/10 χ2=1.020 0.312 年龄(岁) 70.0±4.8 71.0±5.7 t=2.668 0.612 教育年限(年) 7.1±6.4 8.4±6.1 t=3.021 0.505 CDR(分) 1.33±0.45 0 t=6.001 <0.001 MMSE(分) 20.1±3.8 29.3±2.1 t=3.986 <0.001 α-syn(pg/mL) 560±194 410±85 t=2.315 0.001 Aβ40(pg/mL) 9621±614 9897±1802 t=−4.223 0.082 Aβ42(pg/mL) 589±405 895±392 t=−5.443 0.020 t-tau(pg/mL) 679±302 345±102 t=4.001 0.008 p-tau(pg/mL) 99±41 55±22 t=2.336 <0.001 t-tau/Aβ42 1.061±0.697 0.262±0.137 t=3.291 <0.001 Aβ42/Aβ40 0.065±0.014 0.099±0.028 t=−3.487 0.013 11C-PIB PET/CT阳性率 82.0%(41/50) 12.5%(2/16) χ2=25.787 <0.001 注:α-syn、Aβ40、Aβ42、t-tau、p-tau均为脑脊液生物标志物。AD为阿尔茨海默病;CDR为临床痴呆评定量表;MMSE为简易精神状态量表;α-syn为α突触核蛋白;Aβ为β淀粉样蛋白;t-tau/Aβ42为t-tau/Aβ42水平的比值;Aβ42/Aβ40为Aβ42/Aβ40水平的比值;PIB为匹兹堡化合物B;PET为正电子发射断层显像术;CT为计算机体层摄影术  下载: 导出CSV
表 2 脑脊液生物标志物ROC曲线的指标结果
Table 2. Index results of receiver opertor characteristic curve of cerebrospinal fluid biomarkers
脑脊液生物标志物 AUC 最佳临界值 灵敏度(%) 特异度(%) 95%CI P值 α-syn(pg/mL) 0.795 465 74.0 68.8 0.628~0.851 0.004 Aβ40(pg/mL) 0.601 8562 42.3 54.0 0.402~0.732 0.074 Aβ42(pg/mL) 0.703 623 70.1 68.5 0.613~0.823 0.010 t-tau(pg/mL) 0.644 542 57.8 82.9 0.496~0.805 0.006 p-tau(pg/mL) 0.621 62 72.9 48.1 0.499~0.791 0.009 t-tau/Aβ42 0.892 0.509 80.0 81.2 0.801~0.949 < 0.001 Aβ42/Aβ40 0.865 0.072 76.0 75.0 0.658~0.900 < 0.001 注:ROC为受试者工作特征;AUC为曲线下面积;CI为可变区间;α-syn为α突触核蛋白;Aβ为β淀粉样蛋白;t-tau/Aβ42为t-tau/Aβ42水平的比值;Aβ42/Aβ40为Aβ42/Aβ40水平的比值
下载: 导出CSV
表 3 脑脊液生物标志物、11C-PIB PET/CT及其联合诊断的效能
Table 3. The diagnostic efficacy of cerebrospinal fluid biomarkers, 11C-Pittsburgh compound-B PET/CT and their combined diagnosis
诊断项目 灵敏度(%) 特异度(%) 准确率(%) t-tau/Aβ42 80.0(40/50)a 81.2(13/16) 80.3a Aβ42/Aβ40 76.0(38/50)b 75.0(12/16) 75.8 α-syn 74.0(37/50)c 68.8(11/16) 72.7 11C-PIB PET/CT 78.0(39/50)abc 75.0(12/16) 77.2a 11C-PIB PET/CT+t-tau/Aβ42 96.0(48/50) 87.5(14/16) 93.9 11C-PIB PET/CT+Aβ42/Aβ40 94.0(47/50) 81.2(13/16) 90.9 11C-PIB PET/CT+α-syn 94.0(47/50) 75.0(12/16) 89.4 注:a表示与11C-PIB PET/CT+t-tau/Aβ42比较,灵敏度和准确率均较低(χ2=6.061、5.469、7.162、7.439,均P<0.05);b表示与11C-PIB PET/CT+Aβ42/Aβ40比较,灵敏度均较低(χ2=6.353、5.316,均P<0.05);c表示与11C-PIB PET/CT+α-syn比较,灵敏度均较低(χ2=7.440、5.316,均P<0.05)。PIB为匹兹堡化合物B;PET为正电子发射断层显像术;CT为计算机体层摄影术;t-tau/Aβ42为t-tau/Aβ42水平的比值;Aβ42/Aβ40为Aβ42/Aβ40水平的比值;Aβ为β淀粉样蛋白;α-syn为α突触核蛋白。t-tau、Aβ42、Aβ40和α-syn均为脑脊液生物标志物
下载: 导出CSV
-
[1] Pascoal TA, Mathotaarachchi S, Mohades S, et al. Amyloid-β and hyperphosphorylated tau synergy drives metabolic decline in preclinical Alzheimer's disease[J]. Mol Psychiatry, 2017, 22(2): 306−311. DOI: 10.1038/mp.2016.37. [2] 唐丽娜, 许小明, 李艳红. 阿尔茨海默病发病机制研究进展[J]. 中国老年学杂志, 2016, 36(10): 2545−2548. DOI: 10. 3969/j.issn.1005-9202.2016.10.111.
Tang LN, Xu XM, Li YH. Progress in the pathogenesis of Alzheimer's disease[J]. Chin J Gerontol, 2016, 36(10): 2545−2548. DOI: 10. 3969/j.issn.1005-9202.2016.10.111.[3] 贾建华, 段玉清, 侯文彬, 等. 靶向Tau蛋白PET分子探针的研究进展[J]. 国际放射医学核医学杂志, 2020, 44(5): 317−322. DOI: 10.3760/cma.j.cn121381-201910028-00031.
Jia JH, Duan YQ, Hou WB, et al. Research progress of PET molecular probes targeting Tau protein[J]. Int J Radiat Med Nucl Med, 2020, 44(5): 317−322. DOI: 10.3760/cma.j.cn121381-201910028-00031.[4] Weston PS, Paterson RW, Modat M, et al. Using florbetapir positron emission tomography to explore cerebrospinal fluid cut points and gray zones in small sample sizes[J/OL]. Alzheimers Dement (Amst), 2015, 1(4): 440−446[2020-04-07]. https://www.ncbi.nlm.nih.gov/pmc/articles/PMC4691234. DOI: 10.1016/j.dadm.2015.10.001. [5] Wang ZY, Han ZM, Liu QF, et al. Use of CSF α-synuclein in the differential diagnosis between Alzheimer's disease and other neurodegenerative disorders[J]. Int Psychogeriatr, 2015, 27(9): 1429−1438. DOI: 10.1017/S1041610215000447. [6] Hatashita S, Yamasaki H. Clinically different stages of Alzheimer's disease associated by amyloid deposition with [11C]-PIB PET imaging[J]. J Alzheimers Dis, 2010, 21(3): 995−1003. DOI: 10.3233/JAD-2010-100222. [7] Dubois B, Feldman HH, Jacova C, et al. Research criteria for the diagnosis of Alzheimer's disease: revising the NINCDS-ADRDA criteria[J]. Lancet Neurol, 2007, 6(8): 734−746. DOI: 10.1016/S1474-4422(07)70178-3. [8] Nordberg A, Carter SF, Rinne J, et al. A European multicentre PET study of fibrillar amyloid in Alzheimer's disease[J]. Eur J Nucl Med Mol Imaging, 2013, 40(1): 104−114. DOI: 10.1007/s00259-012-2237-2. [9] Ossenkoppele R, Jansen WJ, Rabinovici GD, et al. Prevalence of amyloid PET positivity in dementia syndromes: a meta-analysis[J]. JAMA, 2015, 313(19): 1939−1949. DOI: 10.1001/jama.2015.4669. [10] de Wilde A, van der Flier WM, Pelkmans W, et al. Association of amyloid positron emission tomography with changes in diagnosis and patient treatment in an unselected memory clinic cohort: the ABIDE project[J]. JAMA Neurol, 2018, 75(9): 1062−1070. DOI: 10.1001/jamaneurol.2018.1346. [11] Duits FH, Teunissen CE, Bouwman FH, et al. The cerebrospinal fluid "Alzheimer profile": easily said, but what does it mean?[J]. Alzheimers Dement, 2014, 10(6): 713−723. DOI: 10.1016/j.jalz.2013.12.023. [12] Weston PS, Paterson RW, Modat M, et al. Using florbetapir positron emission tomography to explore cerebrospinal fluid cut points and gray zones in small sample sizes[J/OL]. Alzheimers Dement (Amst), 2015, 1(4): 440−446[2020-04-07]. https://www.ncbi.nlm.nih.gov/pmc/articles/PMC4691234. DOI: 10.1016/j.dadm.2015.10.001. [13] Li QX, Villemagne VL, Doecke JD, et al. Alzheimer's disease normative cerebrospinal fluid biomarkers validated in PET amyloid-β characterized subjects from the Australian imaging, biomarkers and lifestyle (AIBL) study[J]. J Alzheimers Dis, 2015, 48(1): 175−187. DOI: 10.3233/JAD-150247. [14] Bartlett JW, Frost C, Mattsson N, et al. Determining cut-points for Alzheimer's disease biomarkers: statistical issues, methods and challenges[J]. Biomark Med, 2012, 6(4): 391−400. DOI: 10.2217/bmm.12.49. [15] Wang MJ, Yi S, Han JY, et, al. Analysis of cerebrospinal fluid and [11C]PIB PET biomarkers for Alzheimer's disease with updated protocols[J]. J Alzheimers Dis, 2016, 52(4): 1403−1413. DOI: 10.3233/JAD-160143. [16] Niemantsverdriet E, Ottoy J, Somers C, et al. The cerebrospinal fluid Aβ1-42/Aβ1-40 ratio improves concordance with amyloid-PET for diagnosing Alzheimer's disease in a clinical setting[J]. J Alzheimers Dis, 2017, 60(2): 561−576. DOI: 10.3233/JAD-170327. [17] Hake A, Trzepacz PT, Wang SF, et al. Florbetapir positron emission tomography and cerebrospinal fluid biomarkers[J]. Alzheimers Dement, 2015, 11(8): 986−993. DOI: 10.1016/j.jalz.2015.03.002. [18] Kang JH, Irwin DJ, Chen-Plotkin AS, et al. Association of cerebrospinal fluid β-amyloid 1-42, t-tau, p-tau181, and α-synuclein levels with clinical features of drug-naive patients with early Parkinson disease[J]. JAMA Neurol, 2013, 70(10): 1277−1287. DOI: 10.1001/jamaneurol.2013.3861. [19] Lewczuk P, Matzen A, Blennow K, et al. Cerebrospinal fluid Aβ42/40 corresponds better than Aβ42 to amyloid PET in Alzheimer's disease[J]. J Alzheimers Dis, 2017, 55(2): 813−822. DOI: 10.3233/JAD-160722. -

 点击查看大图
计量
- 文章访问数: 3130
- HTML全文浏览量: 1985
- PDF下载量: 25
