


-
抑郁症是一种以明显而持久的情绪低落、兴趣减退及思维缓慢等为主要表现的心理障碍,对患者的工作和生活以致生命造成严重威胁。抑郁症已成为仅次于心脑血管病的人类第二大疾病[1]。然而,目前对于抑郁症的研究尚不充分,对于抑郁症的发病机制和病因尚不明确[2]。
近年来,随着影像学技术在精神和心理疾病领域的应用,基于血氧水平依赖的静息态功能磁共振成像(resting-state functional MRI,rs-fMRI)技术[3],作为研究脑功能异常的方法有着自己特有的优势,其可以在无创伤条件下对大脑进行特定的研究,并有较高的空间分辨率[4],被广泛应用于静息态人脑自发活动的研究中。在众多rs-fMRI指标中,低频振幅(amplitude of low frequency fluctuation,ALFF)被认为可以反映静息态下大脑自发神经活动水平的高低,具有重要的生理意义[5],可能是研究抑郁症患者发病机制的有效方法[6];而低频振幅比率(fractional amplitude of low frequency fluctuation,fALFF)是一种改良的ALFF方法,通过采用0.01~0.08 Hz之间的信号振荡平均强度与整个频段振荡信号的比值,可去除生理噪音带来的影响,提高检测脑自发活动的灵敏度和特异度[7-8]。因此,本研究采用ALFF和fALFF的方法,初步探讨首次发作抑郁症患者局部脑区活动的异常变化,为抑郁症可能的发病机制提供理论依据。
-
选取2019年1月至12月就诊于苏州大学附属广济医院心理门诊的抑郁症患者17例,其中男性5例、女性12例,年龄19~54(37.18±11.53)岁,受教育年限6~16年。为保证研究结果的准确性及一致性,所有入组标准及量表评定均由2位精神科主治医师完成。纳入标准:①同时符合中国精神障碍分类与诊断标准[9]和美国精神障碍诊断与统计手册(DSM-5)抑郁症的诊断标准[10];②首次发作且未用药的患者;③17项汉密尔顿抑郁量表(17-item Hamilton depression rating scale,HAMD-17)总分≥17分;④年龄为18~60周岁;⑤右利手;⑥无MRI禁忌证。排除标准:①颅内存在病变者(包括神经系统变性疾病、脑外伤或脑血管病等脑器质性病变等);②存在其他基础性疾病者(不稳定性心血管、呼吸、内分泌或免疫相关等疾病);③其他精神疾病或服用药物引起的继发性抑郁者;④合并其他精神障碍或药物、酒精依赖者;⑤存在MRI绝对禁忌证或其他情况不能配合检查者。
-
收集2019年1月至12月面向社会招募的正常志愿者17名,其中,男性8名、女性9名,年龄20~58(37.24±13.50)岁,受教育年限9~16年。纳入标准:①精神状况良好,无家族性精神疾病病史;②无颅脑外伤及手术史;③无严重的器质性疾病;④右利手;⑤无MRI禁忌证。
所有受试者或其家属均签署了知情同意书。本研究获得了苏州大学附属广济医院伦理委员会的批准,批准文号:苏广伦审2019-030。
-
所有受试者均采用德国西门子公司生产的SIEMENS 3.0T MRI系统进行数据采集,采用16通道头线圈。受试者均为头先进,仰卧位,扫描时受试者清醒、闭眼、头部固定、安静平卧于检查床上,进行常规磁共振T1、T2加权成像平扫,对头部未发现异常信号者,进行rs-fMRI扫描。血氧水平依赖rs-fMRI扫描采用平面回波成像序列采集,扫描参数:重复时间(TR)2000 ms、回波时间(TE)30 ms、翻转角90°、层厚3.5 mm、层距0.9 mm、视野224 mm×224 mm、矩阵64×64、体素大小 3.5 mm×3.5 mm×3.5 mm,层数32,采集240个时间点。
-
在MATLAB R2017a平台上运行DPABI V4.3[11],对rs-fMRI数据进行预处理,为避免MRI设备匀场效应及受试者不适应封闭的磁体环境对后续统计结果造成的影响,去除rs-fMRI前10个时间点的数据,将后续230个时间点的功能影像数据纳入分析,对功能影像预处理,进行时间校正(slice timing)、空间对齐(realignment)、空间标准化(normalization)和空间平滑(smooth),去除头动平移≥3 mm与旋转移动≥3°的受试者图像,其余图像均纳入后续分析。
采用DPARSF 4.4软件[11]对上述图像进行去线性漂移,对0.01~0.08 Hz下信号的功率谱进行开方,得到ALFF值;将此范围内的ALFF值相加得到其总值,与0.01~0.25 Hz的全频段振幅总值相除,即得到fALFF。将每个体素的ALFF值及fALFF与全脑信号幅值均值相除,对全脑的体素进行标准化处理。
-
采用REST1.8软件基于蒙特卡罗模拟法AlphaSim对结果进行多重校正(单个体素P<0.005,连续体素数k≥50、校正后P<0.05),并将结果叠加于标准结构模板,最终提取首发抑郁症组患者与正常对照组受试者对比异常的脑区ALFF值和fALFF,并确定对应MNI(蒙特利尔神经病学研究)坐标以及BA(Brodmann)分区上有统计学意义脑区的具体解剖位置。
-
采用SPSS19.0软件对人口学资料进行统计学处理与分析。计数资料采用χ2检验,呈正态分布的计量资料以均数±标准差(
$ \bar x$ ±s)表示。采用DPABI V4.3软件对上述MRI预处理后的数据进行统计分析,在方差齐的情况下,采用两独立样本的 t 检验。对脑区ALFF值和fALFF分别与HAMD-17评分行Pearson相关性分析。P<0.05为差异有统计学意义。 -
抑郁症组与正常对照组的年龄、性别及受教育程度之间的差异均无统计学意义(P>0.05),具有可比性,详见表1。正常对照组的HAMD-17评分明显低于抑郁症组,差异有统计学意义(t=−15.250,P<0.001)。
组别 性别
(男/女,例)年龄
(岁)受教育年限
(年)HAMD-17
评分正常对照组
(n=17)8/9
37.18±11.53
12.88±1.83
1.76±1.20
抑郁症组
(n=17)5/12
37.24±13.50
22.12±5.37
12.41±2.81
t值 − −0.014 0.579 −15.250 P值 0.480 0.989 0.568 <0.001 注:表中,HAMD-17:17项汉密尔顿抑郁量表;−:无此项数据 表 1 抑郁症组与正常对照组的临床特点
Table 1. Clinical characteristics of depression and control group
-
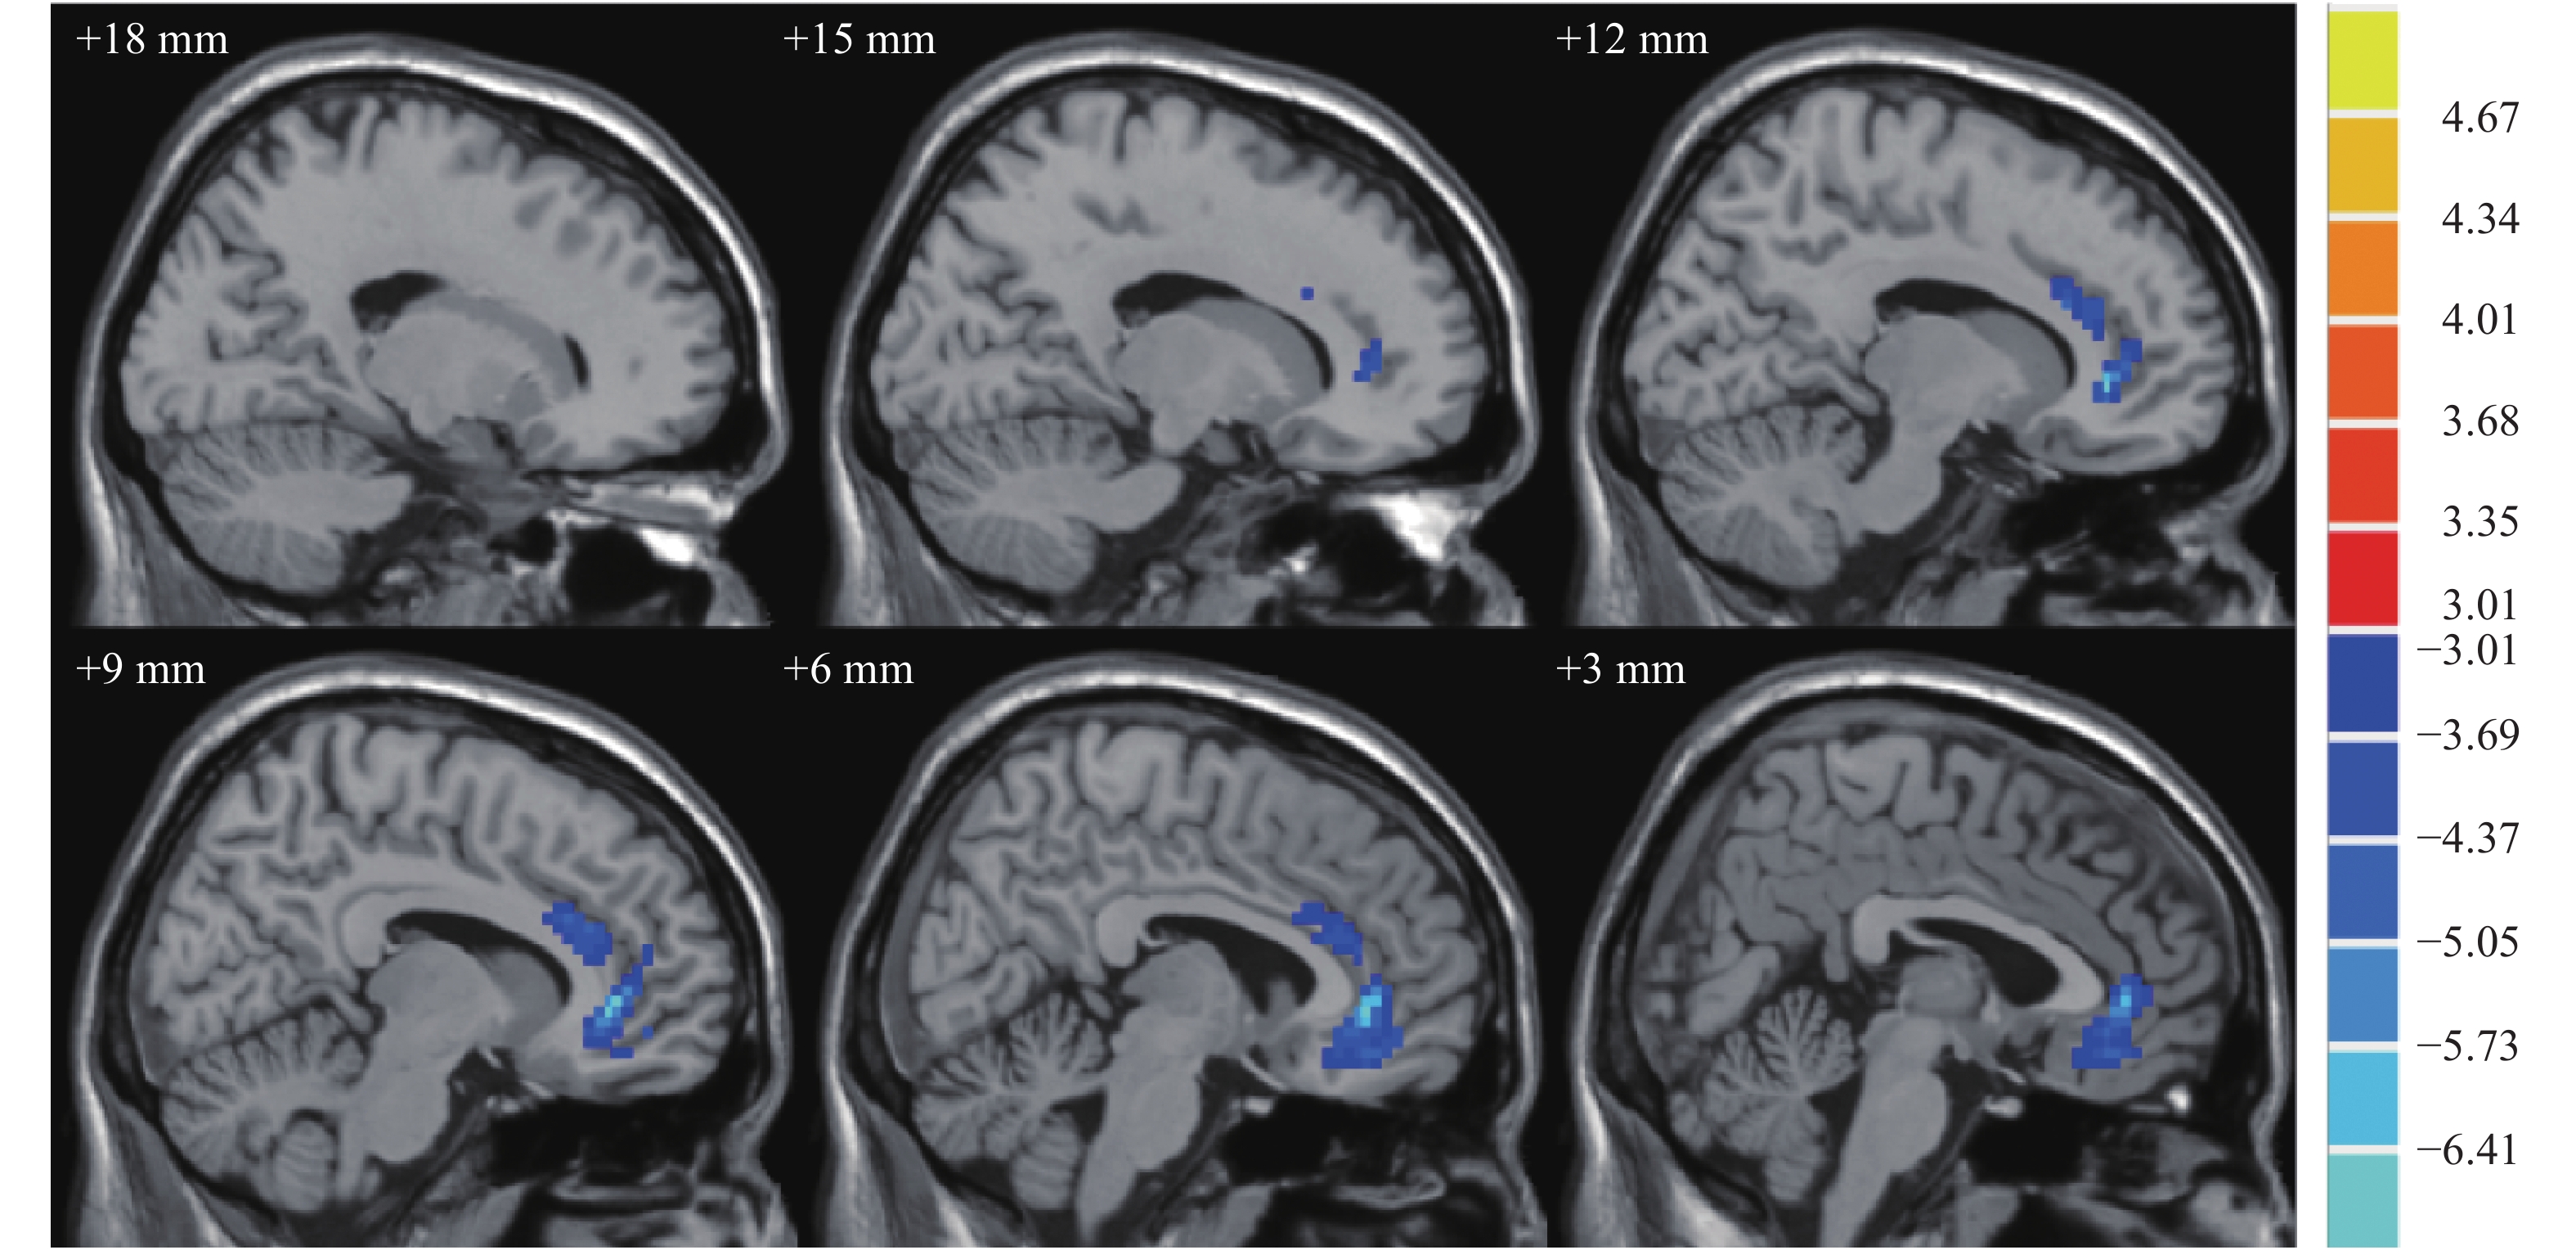
抑郁症组患者脑区右前扣带回、右前扣带回和旁扣带回的ALFF值均较正常对照组减低,差异均有统计学意义(t=−7.08、−4.56,均P<0.05)。其他具体数值见表2。抑郁症组与正常对照组ALFF值有差异的脑区横断面和矢状面MRI图像见图1和图2。
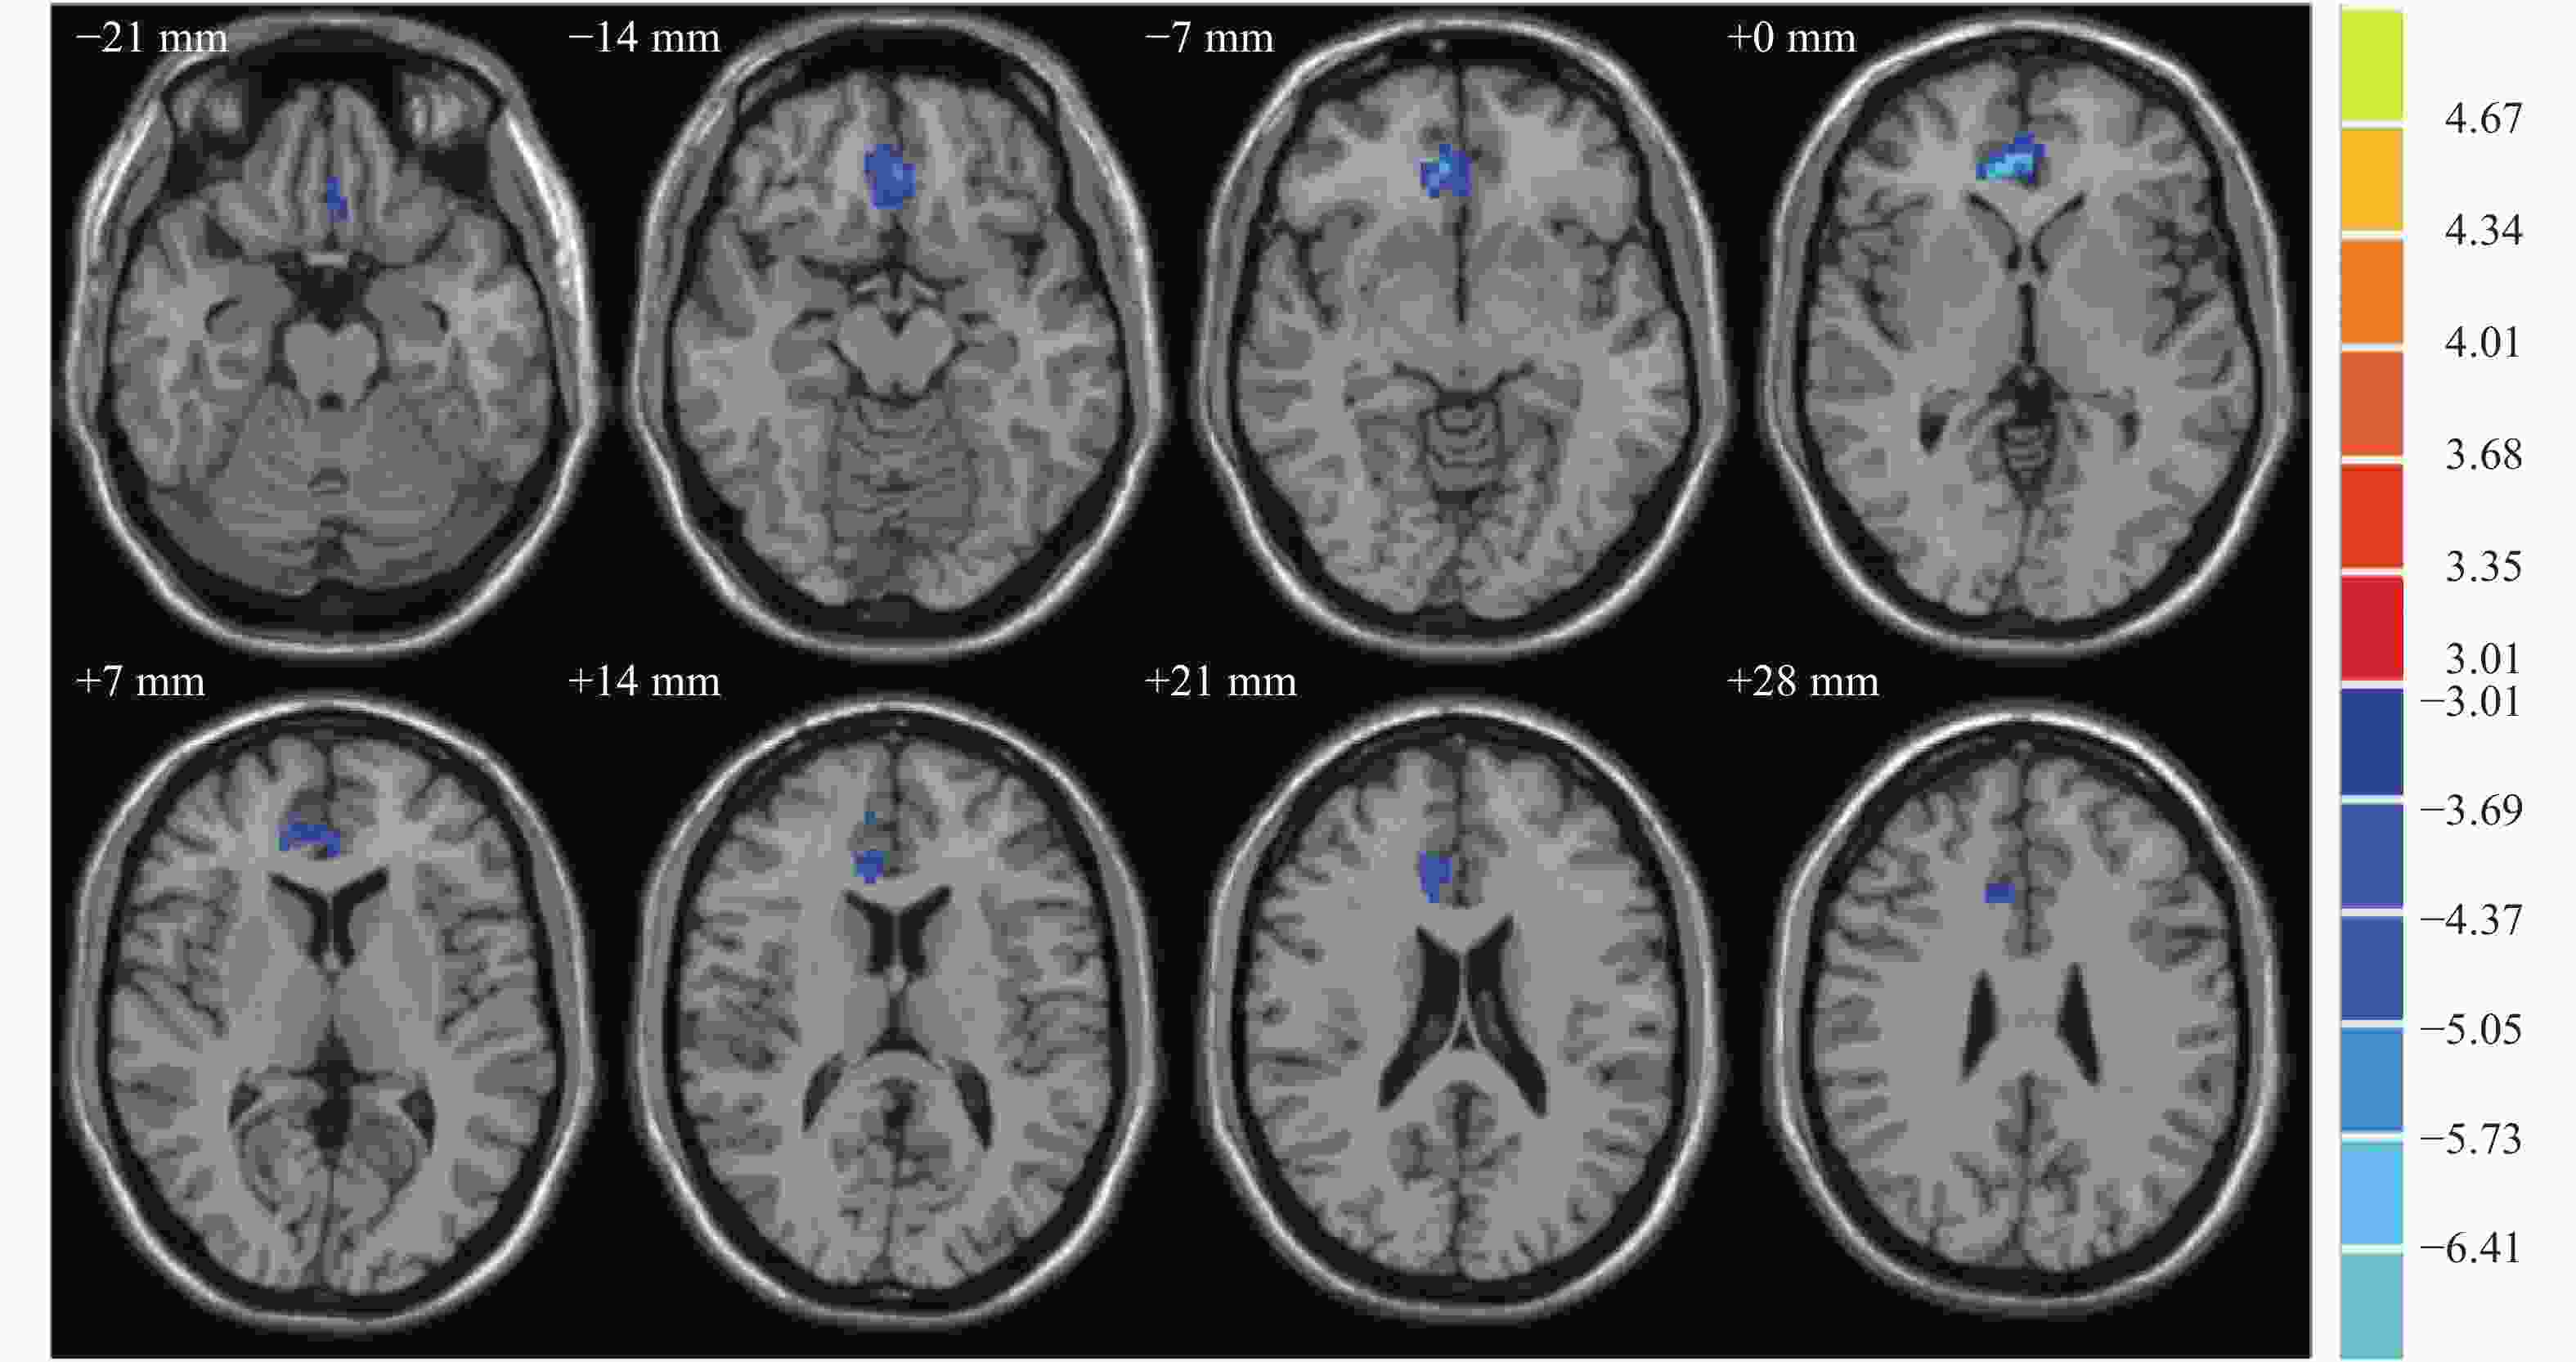
图 1 抑郁症组与正常对照组ALFF值有差异的脑区横断面MRI图像
Figure 1. Differences in amplitude of low frequency fluctuation values between depression and control group in axial position
组别 BA分区 最大差异点MNI坐标(mm) 连续体素数(k值) ALFF值 x y z 正常对照组(n=17) 右前扣带回 11 9 36 −3 79 0.76±0.12 右前扣带回和旁扣带回 − 9 24 24 53 0.77±0.16 抑郁症组(n=17) 右前扣带回 11 9 36 −3 79 0.51±0.11a 右前扣带回和旁扣带回 − 9 24 24 53 0.56±0.08a 注:表中,a:与正常对照组比较,t=−7.08、−4.56,均 P<0.05。BA:Brodmann;MNI:蒙特利尔神经病学研究所;ALFF:低频振幅;−:无具体分区 表 2 抑郁症组与正常对照组脑区ALFF值的差异
Table 2. Differences in amplitude of low frequency fluctuation values between depression and control group

图 2 抑郁症组与正常对照组ALFF值有差异的脑区矢状面MRI图像
Figure 2. Differences in amplitude of low frequency fluctuation values between depression and control group in sagittal position
-
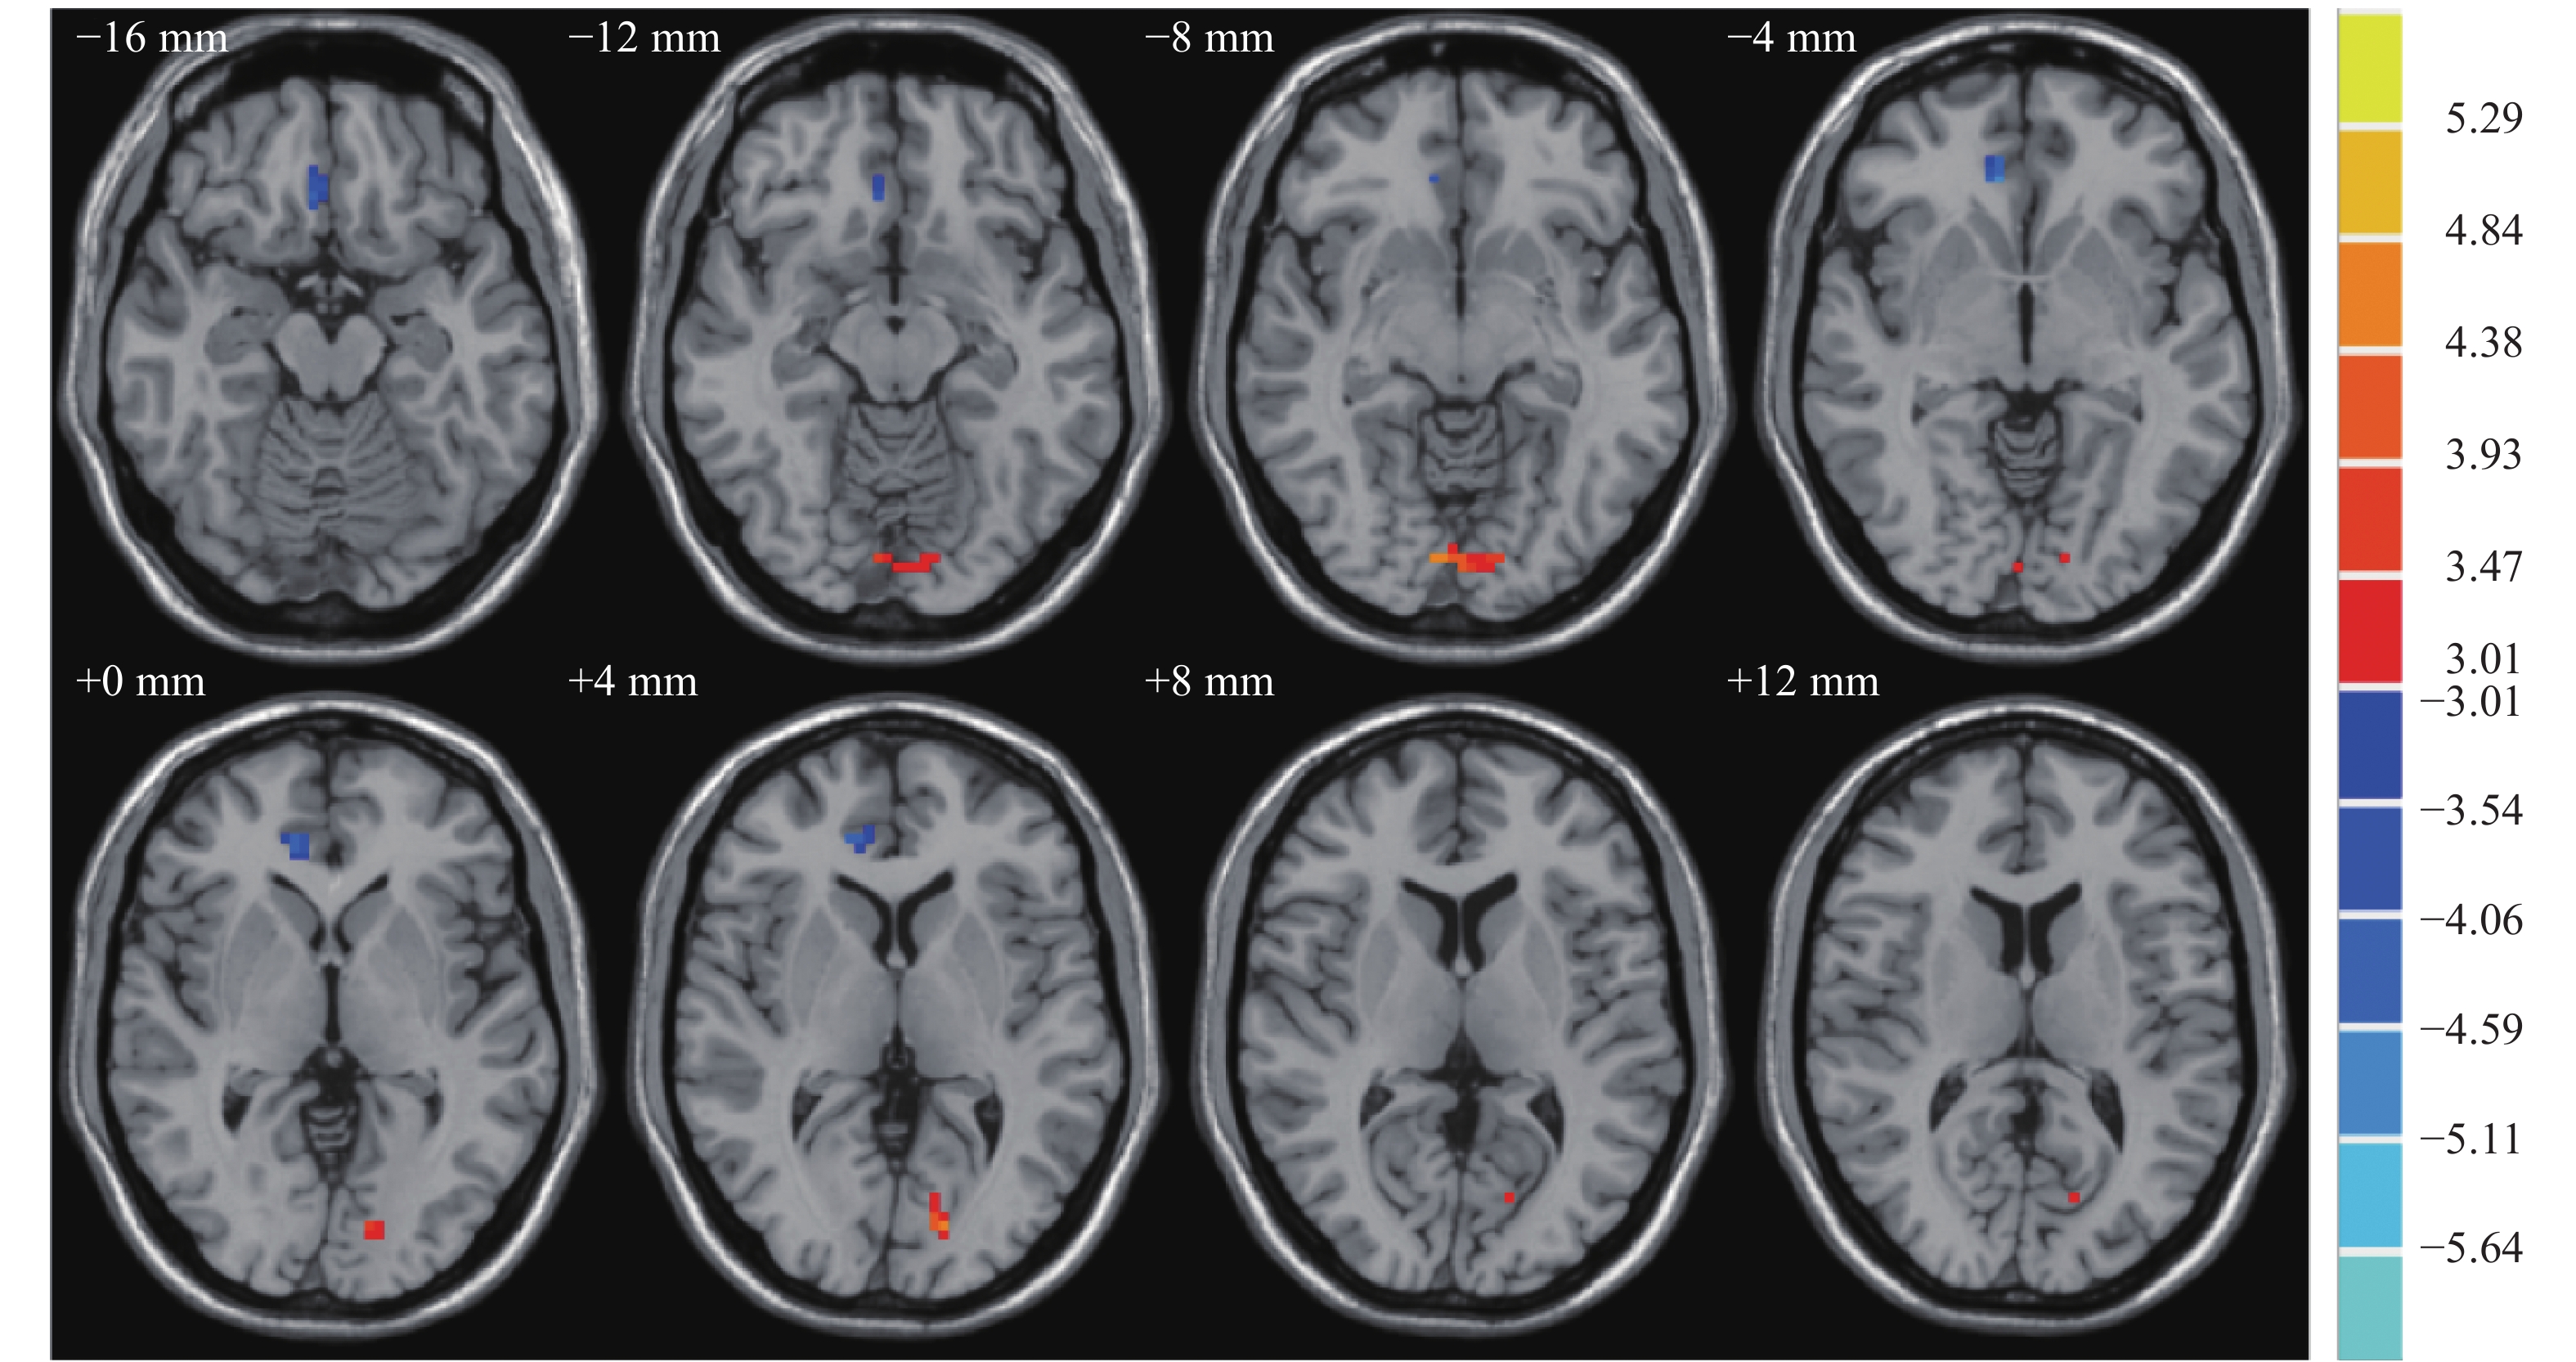
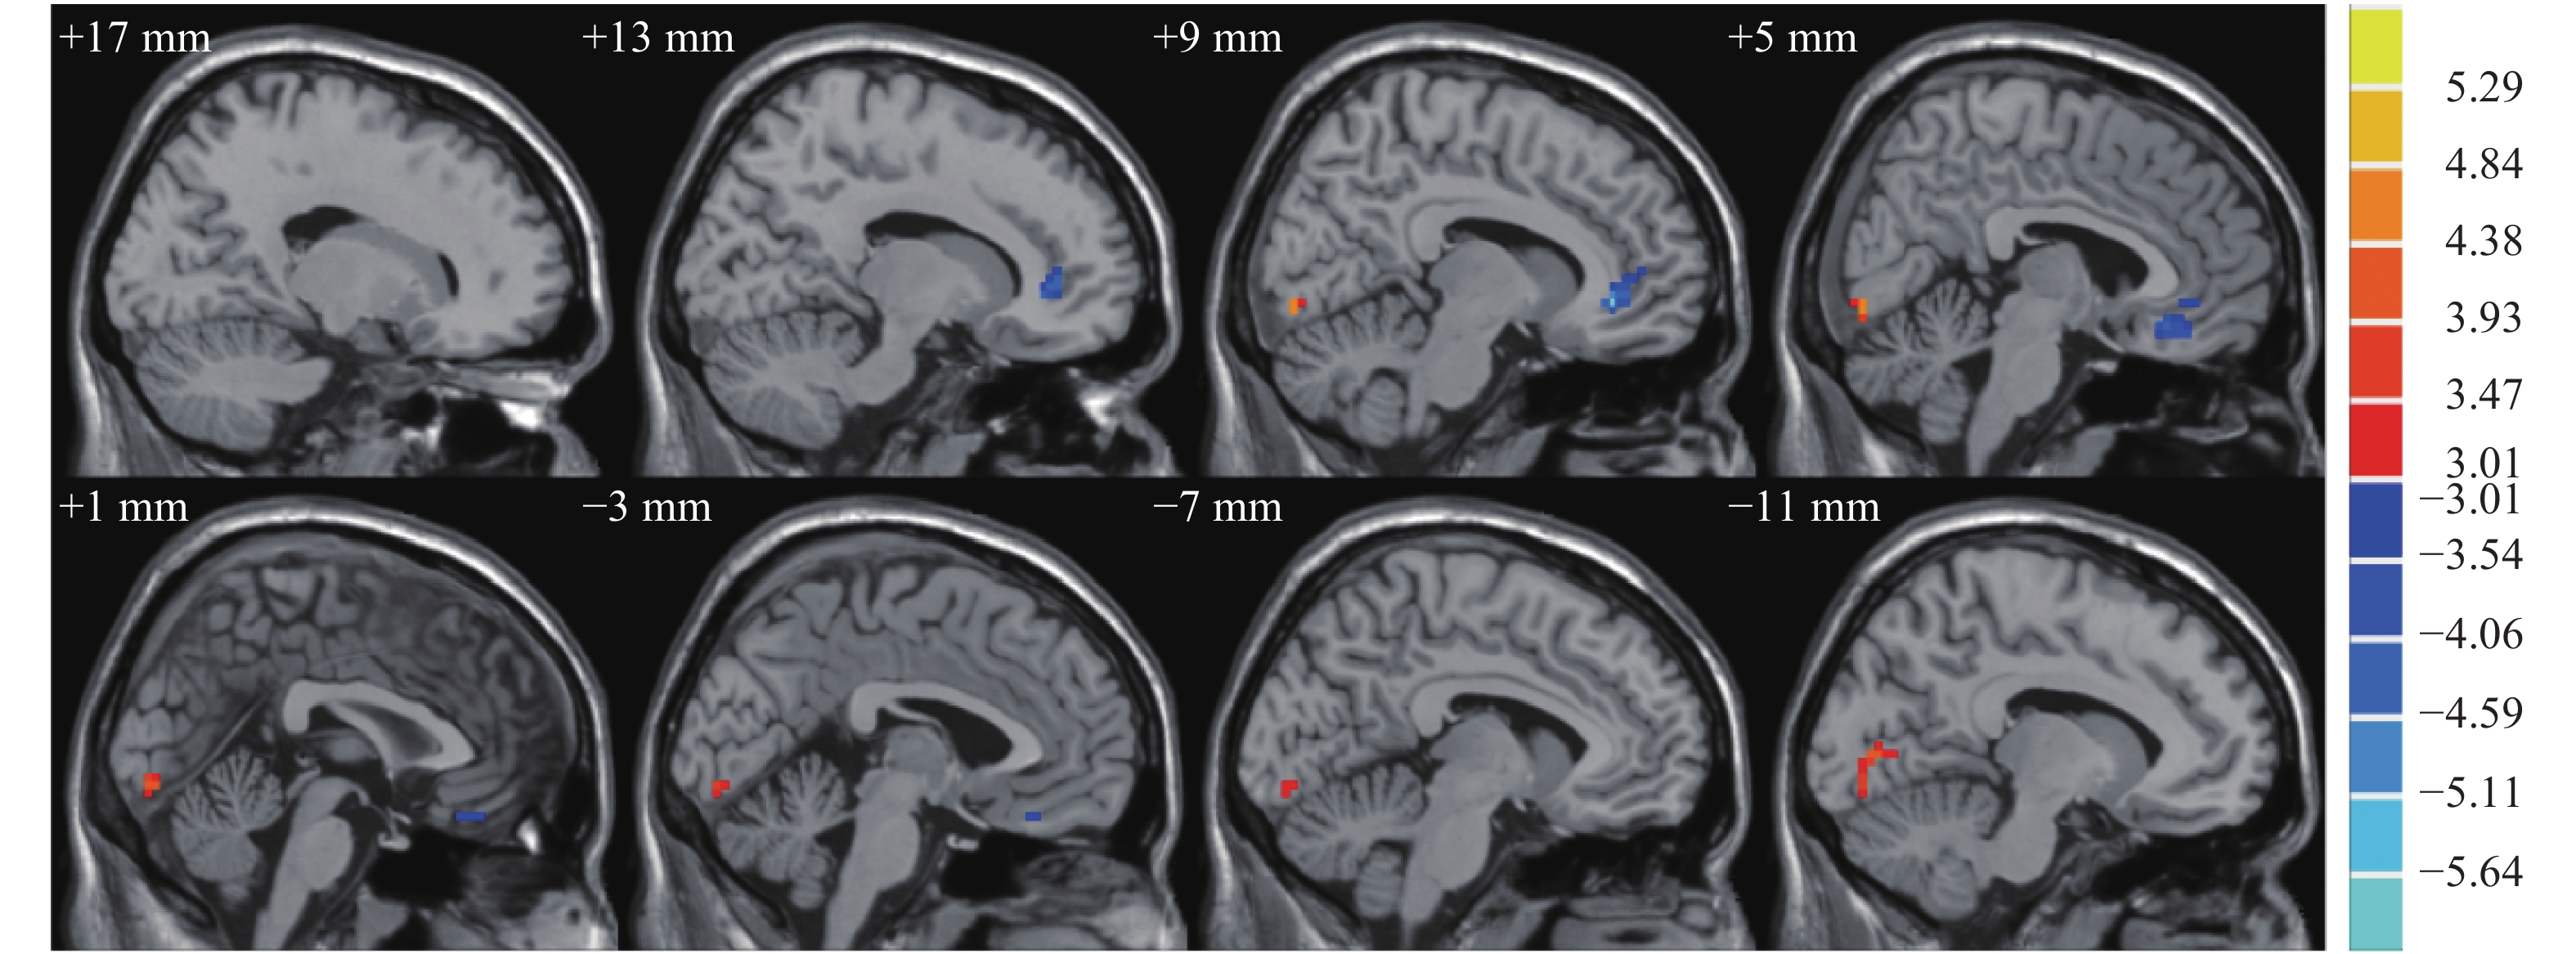
抑郁症组患者脑区右前扣带回的fALFF较正常对照组降低,左舌回的fALFF较正常对照组升高,差异均有统计学意义(t=−5.64、4.61,均P<0.05),具体数据详见表3。抑郁症组与正常对照组fALFF有差异的脑区横断面和矢状面MRI图像见图3和图4。
组别 BA分区 最大差异点MNI坐标(mm) 连续体素数(k值) fALFF x y z 正常对照组(n=17) 右前扣带回 11 9 36 −6 23 1.04±0.05 左舌回 18 9 −87 −9 35 0.99±0.08 抑郁症组(n=17) 右前扣带回 11 9 36 −6 23 0.96±0.06a 左舌回 18 9 −87 −9 35 1.11±0.09a 注:表中,a:与正常对照组比较,t=−5.64、4.61,均 P<0.05。BA:Brodmann;MNI:蒙特利尔神经病学研究所;fALFF:低频振幅比率 表 3 抑郁症组与正常对照组脑区fALFF的差异
Table 3. Differences in fractional amplitude of low frequency fluctuation values between depression and control groups
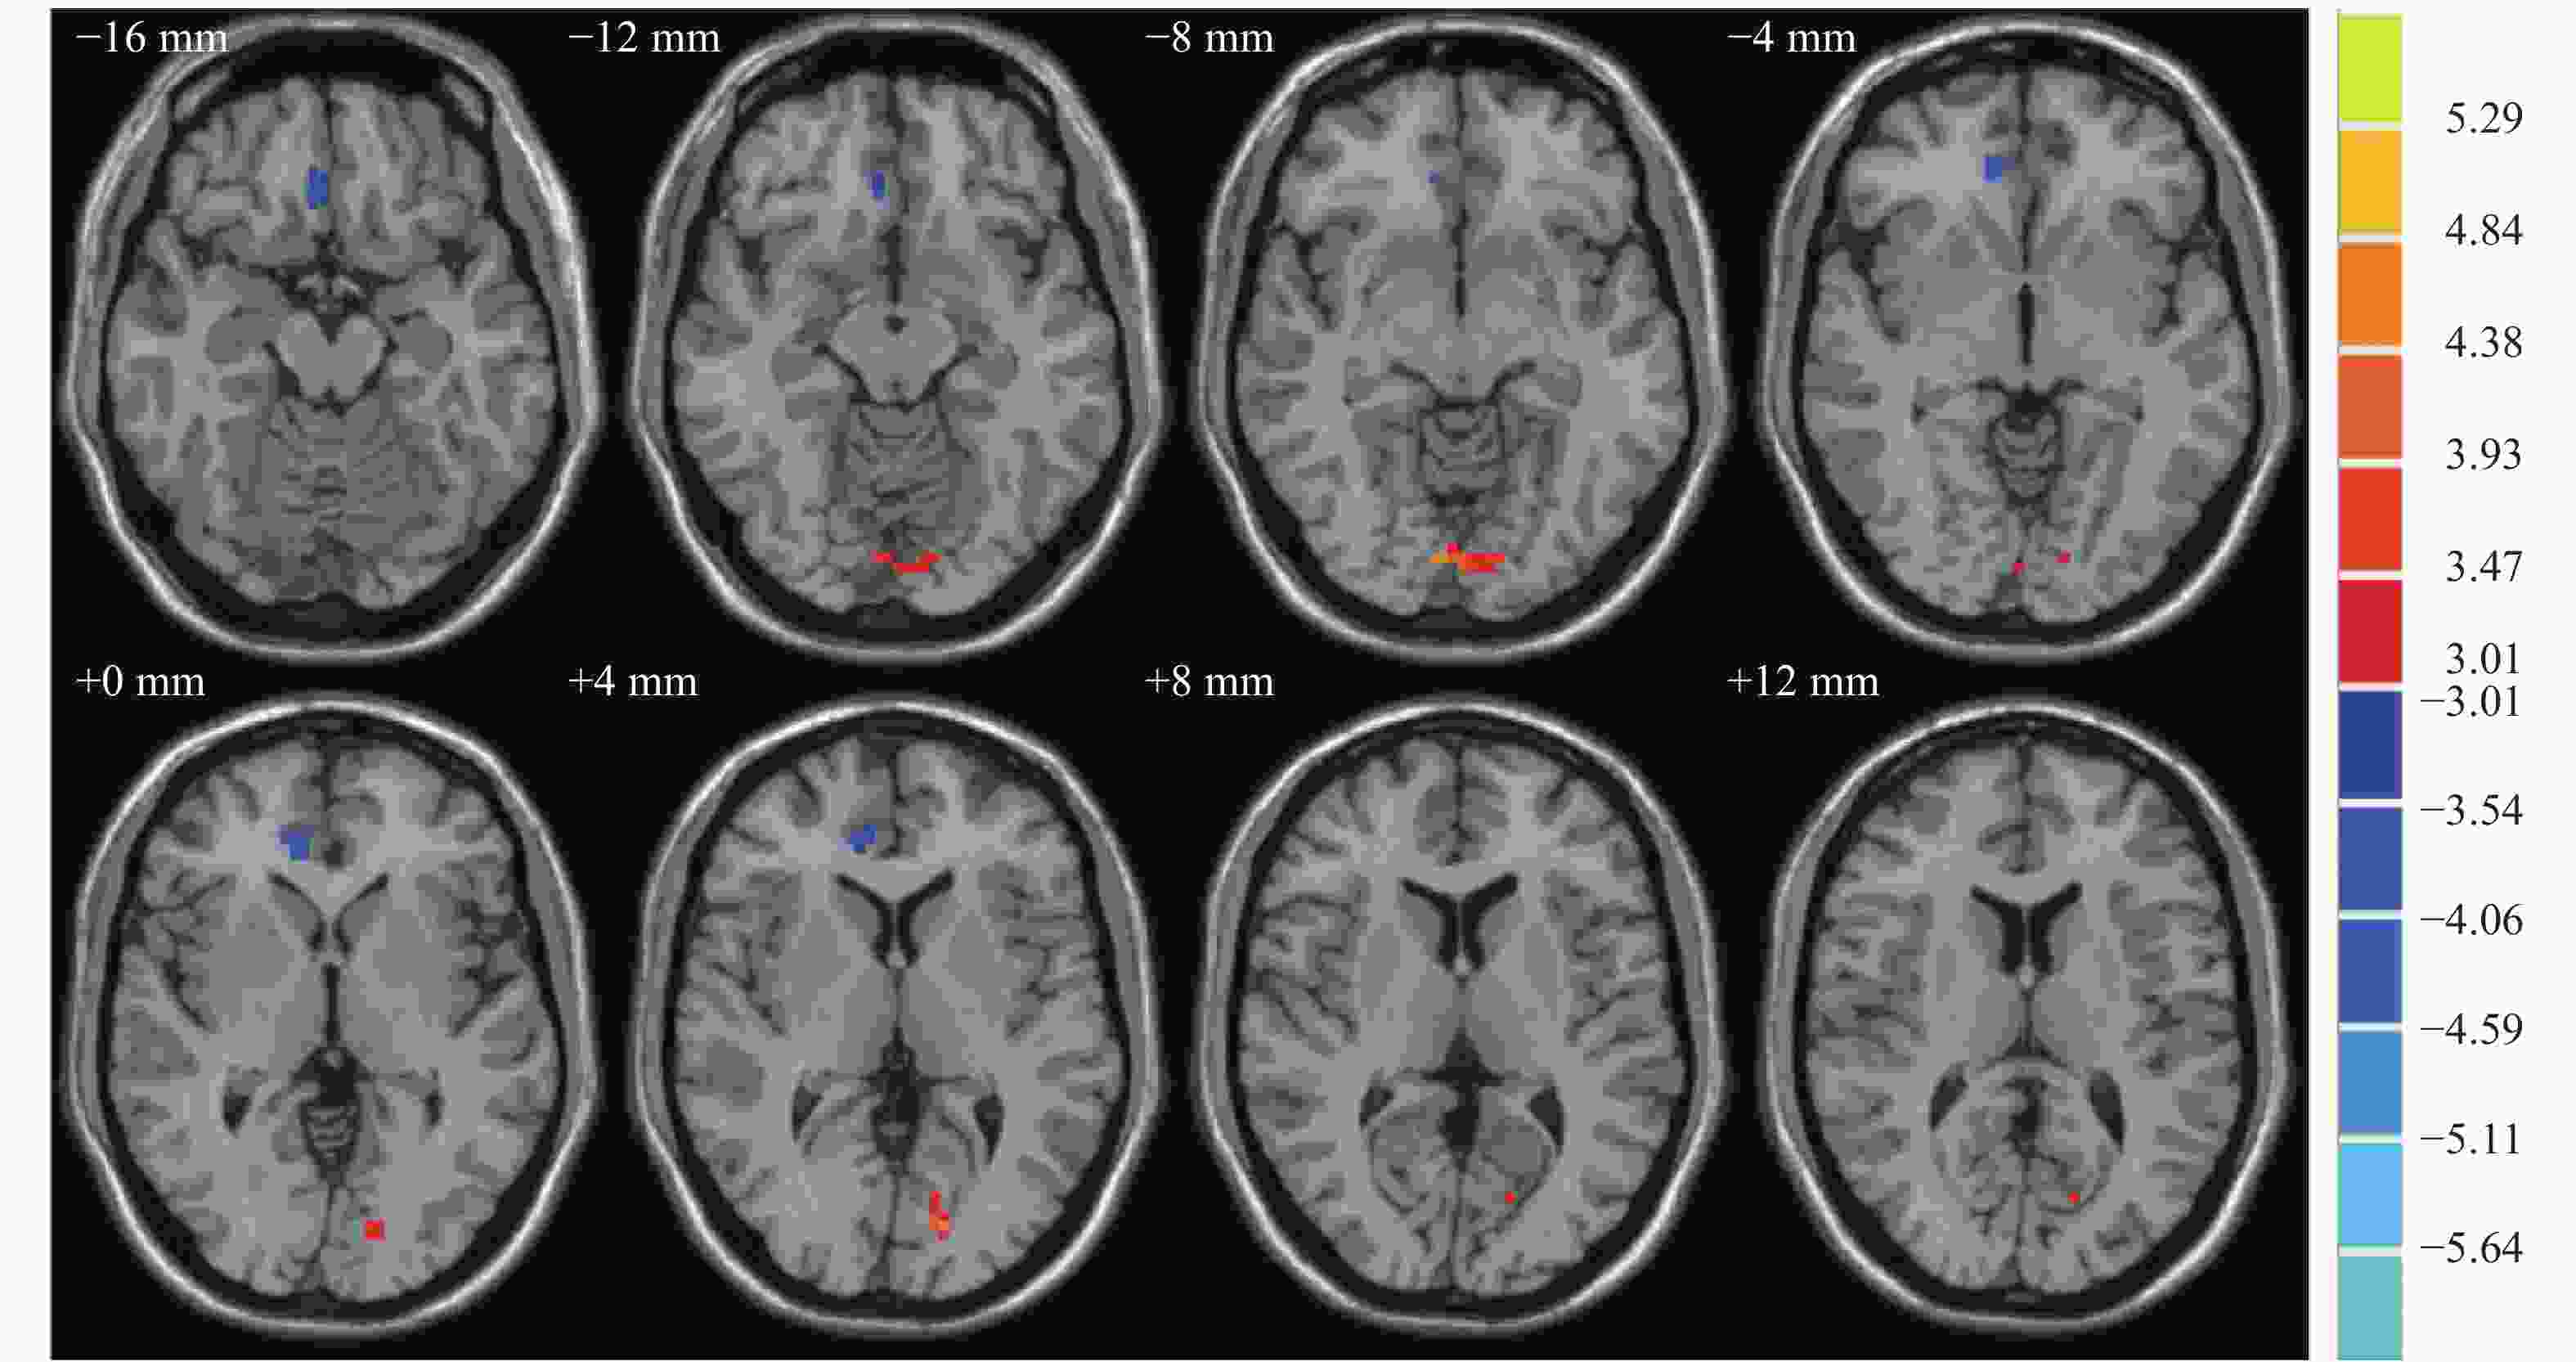
图 3 抑郁症组与正常对照组fALFF有差异的脑区横断面MRI图像
Figure 3. Differences in fractional amplitude of low frequency fluctuation values between depression and control group in axial position

图 4 抑郁症组与正常对照组fALFF有差异的脑区矢状面MRI图像
Figure 4. Differences in fractional amplitude of low frequency fluctuation values between depression and control group in sagittal position
-
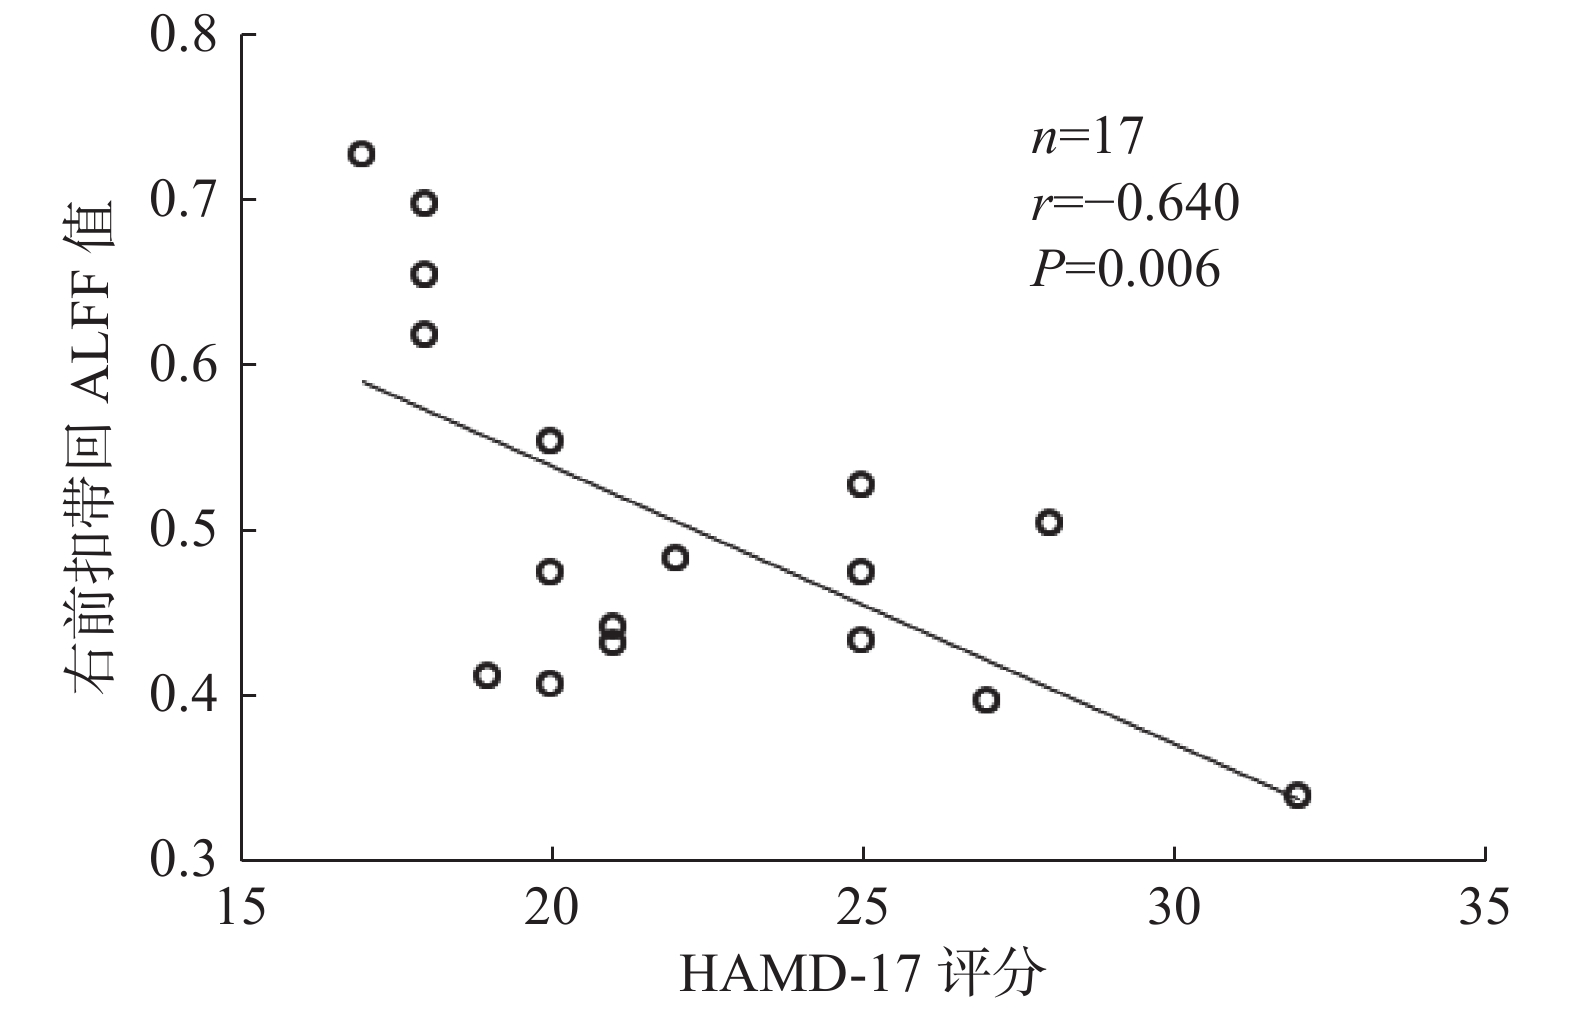
Pearson相关性分析结果显示,首发抑郁症患者脑区右前扣带回ALFF值与其HAMD-17评分呈负相关(r=−0.640,P=0.006)(图5),而右旁扣带回ALFF值、右前扣带回及左舌回fALFF与其HAMD-17评分均无相关性(r=−0.328、−0.029、−0.052,均P>0.05)。

图 5 17例首发抑郁症患者右前扣带回ALFF值与HAMD-17评分的相关性结果
Figure 5. Correlation between amplitude of low frequency fluctuation values of right anterior cingulate gyrus and HAMD-17 score in 17 patients with first episode depression
-
近年来,随着脑部影像学的发展,强烈提示抑郁症可能是神经网络异常导致的神经功能调节异常,而非单一脑部局灶性病变所致[12-13]。ALFF技术运用低频段(0.01~0.08 Hz)的大脑自发活动血氧水平依赖信号,探测静息态下大脑局部脑活动强度,可反映大脑的自发神经功能,并能准确定位有变化的脑区域,被广泛应用于临床研究[7]。当局部脑区ALFF值升高时,说明该处神经元活动性增强,反之则说明该处神经元活动性减弱[14]。但由于操作时仪器噪声大,大脑某些部位如脑室会出现较大能量,且对研究结果来说并不一定有生理意义,因此Zou等[7]提出fALFF方法,将所得低频率的能量除以整个频率范围内的能量,有效避免了脑室等生理噪声的影响,提高了自发神经活动信号检测的灵敏度及特异度[15]。本研究采用ALFF和fALFF方法,探讨了首发抑郁症患者局部脑区活动的异常变化,结果发现ALFF值和fALFF异常的脑区有相同的,也有不同的,这有利于更加全面地定位首发抑郁症患者功能异常的脑区,为抑郁症可能的病理生理机制提供理论依据,为早期诊断提供可靠的影像学依据。
抑郁症是一种发作性疾病,在发作期会出现心境低落及相关症状,且患者社会功能受损,而发作间隙时心理活动可以完全正常。根据之前(间隔至少2个月前)是否有过另一次抑郁发作,抑郁症分为首次发作抑郁症和复发性抑郁症。在抑郁症的发病机制中,较多学者认为与默认网络有关,默认网络学说最早由Raichle等[16]提出,主要脑区包括内侧前额叶、扣带回、双侧角回及楔前叶等,与人脑对内外环境的监测、情绪的加工、情景记忆的提取等功能密切相关,其中前额叶、扣带回等在信息传输与整合中起非常重要的作用,两者的异常可能是导致整个默认网络功能异常的关键。扣带回前下部主要与人的情绪加工有关,其功能异常可能导致情绪加工发生障碍,情绪加工障碍是抑郁症的重要表现之一,因此扣带回是抑郁症病理生理学研究中重要的结构和功能区域[17]。Meta分析结果发现,抑郁症组的前扣带回体积显著缩小[18-19],而基于体素的重性抑郁障碍形态学研究的Meta分析结果表明,双侧前扣带皮层灰质的减少与抑郁症的病因有关[20]。另有研究结果显示,抑郁症患者在双侧扣带回存在ALFF值异常[21]。Lai等[22]的研究证实了首发抑郁症患者右前扣带回的局部一致性(Reho)降低,并与抑郁症的严重程度相关。我们发现右前扣带回ALFF值和fALFF均明显降低,这一结果与既有结论相符,且该部位的ALFF值与HAMD-17评分呈负相关,结合既往研究提示,抑郁症患者不仅扣带回体积减少,且该区域神经元活动性也有所减弱,因此抑郁症的发病可能与扣带回体积的减少及该区域神经元活动性减弱有关,进一步表明了前扣带回可能与抑郁症常伴随的认知障碍、情绪障碍和焦虑情绪有关[23]。
枕叶位于大脑半球后部,是视觉认知网络的重要组成部分,主要参与视觉信息的接收和整合、面部和情绪的识别等[24]。枕叶受损时不仅会发生与视觉相关的功能缺陷,还会引起记忆和运动知觉等功能的障碍,其组成部分舌回是视觉识别环路中最重要的脑区。Yue等[25]的研究结果显示,抑郁症患者面部情绪处理异常是由舌回和右梭状回之间的视觉认知网络联结脱离引起的。有研究者发现,抑郁症患者治疗后右舌回的fALFF减低[17],而我们研究发现,抑郁症组较正常对照组左舌回的fALFF增加,因此舌回神经元活动的异常改变可能是视觉识别网络障碍及情感系统损坏的神经基础。
本研究中首发抑郁症患者右前扣带回ALFF值和fALFF均明显降低,右前扣带回和旁扣带回ALFF值降低,左舌回fALFF增高,显示ALFF值和fALFF的差异脑区有重叠,也有不同。正常对照组和抑郁症组的ALFF值是有差异的,而正常对照组和抑郁症组的整个频率范围的能量也是不同的,可能会产生不同的结果,因此需同时计算ALFF值和fALFF,更加充分、全面地定位首发抑郁症患者异常功能的脑区。
本研究也具有一定局限性,如样本量较小、年龄区间较小、只有首发抑郁症患者、没有包括难治性抑郁症及治疗干预后抑郁症患者等,这些均可能会对结果产生影响,因此在未来的研究中需要扩大样本数量、扩大年龄区间、增加不同类型的患者。
综上所述,本研究证实了首发抑郁症患者在静息状态下脑功能区ALFF值及fALFF均发生变化,右前扣带回及右舌回的自发性脑神经活动异常可能参与了抑郁症发病的病理学机制,同时说明ALFF值及fALFF可用来检测脑功能障碍的异常变化。在今后的研究中拟将ALFF值、fALFF与抑郁症患者临床治疗前后的变化结合起来,观察疾病进展和转归时大脑内的持续变化过程,分析首发抑郁症患者临床表现与静息状态脑功能成像技术相关指标的相关性,进一步揭示抑郁症患者脑内功能性异常的改变与抑郁症的治疗方法及预后的相关性。
利益冲突 本研究由署名作者按以下贡献声明独立开展,不涉及任何利益冲突。
作者贡献声明 邱晶、王慧负责论文的撰写;王蕾、周治强负责磁共振数据的采集;徐雅洁负责数据的统计分析;顾卫国负责论文的审阅。
首次发作抑郁症患者静息态fMRI低频振幅的初步研究
Preliminary research on amplitude of low frequency fluctuation of resting state functional magnetic resonance imaging in first-episode major depressive disorder patients
-
摘要:
目的 探讨首次发作抑郁症患者脑区静息态功能磁共振成像(rs-fMRI)的低频振幅(ALFF)值和低频振幅比率(fALFF)的变化,并分析17项汉密尔顿抑郁量表(HAMD-17)评分与ALFF、fALFF异常脑区的相关性。 方法 选取2019年1月至12月就诊于苏州大学附属广济医院的首发抑郁症患者17例(抑郁症组:男性5例、女性12例,年龄19~54岁)和17名正常志愿者(正常对照组:男性8名、女性9名,年龄20~58岁),收集两组受试者的人口学资料以及HAMD-17评分并进行回顾性分析,所有受试者均行rs-fMRI扫描。基于MATLAB R2017a平台,采用ALFF和fALFF方法对rs-fMRI数据分析,比较2组受试者的ALFF值和fALFF,提取2组受试者差异有统计学意义的脑区。2组计量资料的比较采用两独立样本t检验,对脑区的ALFF值和fALFF分别与HAMD-17评分行Pearson相关性分析。 结果 与正常对照组相比,抑郁症组患者右前扣带回(0.51±0.11对0.76±0.12)、右前扣带回和旁扣带回(0.56±0.08对0.77±0.16)的ALFF值降低,差异有统计学意义(t=−7.08、−4.56,均P<0.05),右前扣带回的fALFF降低(0.96±0.06对1.04±0.05)、左舌回的fALFF升高(1.11±0.09对0.99±0.08),差异有统计学意义(t=−5.64、4.61,均P<0.05)。首发抑郁症患者右前扣带回ALFF值与患者HAMD-17评分呈负相关(r=−0.640,P=0.006),而右旁扣带回ALFF值、右前扣带回及左舌回fALFF与患者HAMD-17评分均无相关性。 结论 静息状态下首发抑郁症患者右前扣带回及左舌回的ALFF值和fALFF可能发生变化,这些脑区的自发性脑神经活动异常可能与HAMD-17评分有一定的相关性。 Abstract:Objective To investigate the alteration of baseline brain activity levels in first-episode depressive disorder patients by the amplitude of low frequency fluctuation (ALFF) and fractional amplitude of low frequency fluctuation (fALFF) based on the resting state functional magnetic resonance imaging (rs-fMRI). The correlations between the scores of HAMD-17 and the abnormal brain regions of ALFF and fALFF were analyzed. Methods Seventeen first-episode depressive patients (depression group: 5 males and 12 females, aged 19−54 years old) and 17 normal volunteers (control group: 8 males and 9 females, aged 20−58 years old) awere enrolled. Demographic data and HAMD-17 scores of the two groups were collected and analyzed by retrospective analysis, and rs-fMRI scanning was performed on the two groups. Based on the MATLAB R2017a platform, ALFF and fALFF methods were used to analyze the resting state scanning data. The ALFF and fALFF values of the two groups were compared by using DPABI v4.3 statistical software. The brain regions with statistically significant differences between the two groups were extracted by REST1.8 software. SPSS19.0 was used to analyze the demographic data. Two independent samples t-test was used for continuous variables with normal distributions. Pearson correlation analysis was performed between these brain regions and HAMD-17 scores. Results Compared with the control group, the depressive disorder patients of depression group had decreased ALFF in the right anterior cingulate (0.51±0.11 vs. 0.76±0.12) and right anterior cingulate and paracingulate gyrus (0.56±0.08 vs. 0.77±0.16), the difference was statistically significant (t=−7.08, −4.56, both P<0.05). Compared with the control group, the disorder patients of depressive group showed decreased fALFF in the right anterior cingulate (0.96±0.06 vs. 1.04±0.05), and increased fALFF in left lingual gyrus (1.11±0.09 vs. 0.99±0.08), the difference was statistically significant (t=−5.64, 4.61, both P<0.05). A negative correlation among ALFF values was found in the right anterior cingulate cortex and HAMD-17 score in first-episode depression patients (r=−0.640, P=0.006), whereas no correlation was found among ALFF values in the right anterior cingulate cortex, fALFF in the right anterior cingulate and left lingual gyrus, and HAMD-17 scores. Conclusions The values of ALFF and fALFF in the right anterior cingulate gyrus and left lingual gyrus may change in first-episode depression patients under resting state. The spontaneous abnormal brain nerve activity in these brain regions may be related to HAMD-17 scores. -
图 1 抑郁症组与正常对照组ALFF值有差异的脑区横断面MRI图像
Figure 1. Differences in amplitude of low frequency fluctuation values between depression and control group in axial position
图 2 抑郁症组与正常对照组ALFF值有差异的脑区矢状面MRI图像
Figure 2. Differences in amplitude of low frequency fluctuation values between depression and control group in sagittal position
图 3 抑郁症组与正常对照组fALFF有差异的脑区横断面MRI图像
Figure 3. Differences in fractional amplitude of low frequency fluctuation values between depression and control group in axial position
图 4 抑郁症组与正常对照组fALFF有差异的脑区矢状面MRI图像
Figure 4. Differences in fractional amplitude of low frequency fluctuation values between depression and control group in sagittal position
图 5 17例首发抑郁症患者右前扣带回ALFF值与HAMD-17评分的相关性结果
Figure 5. Correlation between amplitude of low frequency fluctuation values of right anterior cingulate gyrus and HAMD-17 score in 17 patients with first episode depression
表 1 抑郁症组与正常对照组的临床特点
Table 1. Clinical characteristics of depression and control group
组别 性别
(男/女,例)年龄
(岁)受教育年限
(年)HAMD-17
评分正常对照组
(n=17)8/9
37.18±11.53
12.88±1.83
1.76±1.20
抑郁症组
(n=17)5/12
37.24±13.50
22.12±5.37
12.41±2.81
t值 − −0.014 0.579 −15.250 P值 0.480 0.989 0.568 <0.001 注:表中,HAMD-17:17项汉密尔顿抑郁量表;−:无此项数据  下载: 导出CSV
表 2 抑郁症组与正常对照组脑区ALFF值的差异
Table 2. Differences in amplitude of low frequency fluctuation values between depression and control group
组别 BA分区 最大差异点MNI坐标(mm) 连续体素数(k值) ALFF值 x y z 正常对照组(n=17) 右前扣带回 11 9 36 −3 79 0.76±0.12 右前扣带回和旁扣带回 − 9 24 24 53 0.77±0.16 抑郁症组(n=17) 右前扣带回 11 9 36 −3 79 0.51±0.11a 右前扣带回和旁扣带回 − 9 24 24 53 0.56±0.08a 注:表中,a:与正常对照组比较,t=−7.08、−4.56,均 P<0.05。BA:Brodmann;MNI:蒙特利尔神经病学研究所;ALFF:低频振幅;−:无具体分区
下载: 导出CSV
表 3 抑郁症组与正常对照组脑区fALFF的差异
Table 3. Differences in fractional amplitude of low frequency fluctuation values between depression and control groups
组别 BA分区 最大差异点MNI坐标(mm) 连续体素数(k值) fALFF x y z 正常对照组(n=17) 右前扣带回 11 9 36 −6 23 1.04±0.05 左舌回 18 9 −87 −9 35 0.99±0.08 抑郁症组(n=17) 右前扣带回 11 9 36 −6 23 0.96±0.06a 左舌回 18 9 −87 −9 35 1.11±0.09a 注:表中,a:与正常对照组比较,t=−5.64、4.61,均 P<0.05。BA:Brodmann;MNI:蒙特利尔神经病学研究所;fALFF:低频振幅比率
下载: 导出CSV
-
[1] Saraceno B. The WHO World Health Report 2001 on mental health[J]. Epidemiol Psichiatr Soc, 2002, 11(2): 83−87. DOI: 10.1017/S1121189X00005546. [2] Besteher B, Gaser C, Nenadić I. Brain structure and subclinical symptoms: a dimensional perspective of psychopathology in the depression and anxiety spectrum[J]. Neuropsychobiology, 2020, 79(4-5): 270−283. DOI: 10.1159/000501024. [3] Hu XP, Chen SY, Huang CB, et al. Frequency-dependent changes in the amplitude of low-frequency fluctuations in patients with Wilson's disease: a resting-state fMRI study[J]. Metab Brain Dis, 2017, 32(3): 685−692. DOI: 10.1007/s11011-016-9946-3. [4] 郭冬玲, 高阳, 牛广明, 等. 首发抑郁症静息态脑功能低频振幅研究[J]. 磁共振成像, 2016, 7(6): 407−411. DOI: 10.12015/issn.1674-8034.2016.06.002.
Guo DL, Gao Y, Niu GM, et al. First-episode depression resting state of brain function low frequency amplitude research[J]. Chin J Magn Reson Imaging, 2016, 7(6): 407−411. DOI: 10.12015/issn.1674-8034.2016.06.002.[5] Lan MJ, Rizk MM, Pantazatos SP, et al. Resting-state amplitude of low-frequency fluctuation is associated with suicidal ideation[J]. Depress Anxiety, 2019, 36(5): 433−441. DOI: 10.1002/da.22888. [6] Hu L, Xiao MN, Ai M, et al. Disruption of resting-state functional connectivity of right posterior insula in adolescents and young adults with major depressive disorder[J]. J Affect Disord, 2019, 257: 23−30. DOI: 10.1016/j.jad.2019.06.057. [7] Zou QH, Zhu CZ, Yang YH, et al. An improved approach to detection of amplitude of low-frequency fluctuation (ALFF) for resting-state fMRI: fractional ALFF[J]. J Neurosci Methods, 2008, 172(1): 137−141. DOI: 10.1016/j.jneumeth.2008.04.012. [8] 刘洁, 张挽时, 钱龙, 等. 基于fALFF及ReHo法观察低氧暴露后飞行员静息态脑功能的变化[J]. 解放军医学杂志, 2015, 40(6): 507−512. DOI: 10.11855/j.issn.0577-7402.2015.06.18.
Liu J, Zhang WS, Qian L, et al. Changes in resting-state brain function of pilots after hypoxic exposure based on methods for fALFF and ReHo analysis[J]. Med J Chin PLA, 2015, 40(6): 507−512. DOI: 10.11855/j.issn.0577-7402.2015.06.18.[9] 中华医学会精神科分会. CCMD-3 中国精神障碍分类与诊断标准[S]. 济南: 山东科学技术出版社, 2001.
Chinese Society of Psychiatry. CCMD-3 Chinese classification and diagnostic criteria of mental disorders[S]. Jinan: Shandong Science and Technology Press, 2001.[10] 美国精神医学学会. 美国精神障碍诊断与统计手册DSM-5[M]. 5版. 北京: 北京大学出版社, 2015.
American Psychiatric Association. American mental disorder diagnosis and statistic manuel. DSM-5[M]. 5th ed. Beijing: Peking University Press, 2015.[11] Yan CG, Wang XD, Zuo XN, et al. DPABI: Data processing & analysis for (resting-state) brain imaging[J]. Neuroinformatics, 2016, 14(3): 339−351. DOI: 10.1007/s12021-016-9299-4. [12] Mulders PC, van Eijndhoven PF, Schene AH, et al. Resting-state functional connectivity in major depressive disorder: a review[J]. Neurosci Biobehav Rev, 2015, 56: 330−344. DOI: 10.1016/j.neubiorev.2015.07.014. [13] 赖明君, 潘小平, 魏新华, 等. 抑郁症患者静息态功能磁共振与睡眠结构研究[J]. 中国医学创新, 2019, 16(3): 25−29. DOI: 10.3969/j.issn.1674-4985.2019.03.006.
Lai MJ, Pan XP, Wei XH, et al. Resting-state functional magnetic resonance imaging and sleep structure analyze in depression[J]. Med Innovation China, 2019, 16(3): 25−29. DOI: 10.3969/j.issn.1674-4985.2019.03.006.[14] Zang YF, He Y, Zhu CZ, et al. Altered baseline brain activity in children with ADHD revealed by resting-state functional MRI[J]. Brain Dev, 2007, 29(2): 83−91. DOI: 10.1016/j.braindev.2006.07.002. [15] 房俊芳, 王倩, 王滨, 等. ALFF及fALFF在评价抑郁症脑活动异常中的应用[J]. 临床放射学杂志, 2015, 34(7): 1030−1034. DOI: 10.13437/j.cnki.jcr.2015.07.002.
Fang JF, Wang Q, Wang B, et a1. Amplitude of low-frequency oscillations in major depression as revealed by resting state functional magnetic resonance imaging[J]. J Clin Radio, 2015, 34(7): 1030−1034. DOI: 10.13437/j.cnki.jcr.2015.07.002.[16] Raichle ME, MacLeod AM, Snyder AZ, et al. A default mode of brain function[J]. Proc Natl Acad Sci U S A, 2001, 98(2): 676−682. DOI: 10.1073/pnas.98.2.676 . [17] Pizzagalli DA. Frontocingulate dysfunction in depression: toward biomarkers of treatment response[J]. Neuropsychopharmacology, 2011, 36(1): 183−206. DOI: 10.1038/npp.2010.166. [18] Koolschijn PC, van Haren NE, Lensvelt-Mulders GJ, et al. Brain volume abnormalities in major depressive disorder: a meta-analysis of magnetic resonance imaging studies[J]. Hum Brain Mapp, 2009, 30(11): 3719−3735. DOI: 10.1002/hbm.20801. [19] Caetano SC, Kaur S, Brambilla P, et al. Smaller cingulate volumes in unipolar depressed patients[J]. Biol Psychiatry, 2006, 59(8): 702−706. DOI: 10.1016/j.biopsych.2005.10.011. [20] Lai CH. Gray matter volume in major depressive disorder: a meta-analysis of voxel-based morphometry studies[J]. Psychiatry Res, 2013, 211(1): 37−46. DOI: 10.1016/j.pscychresns.2012.06.006. [21] Liu CH, Zhang GZ, Li B, et al. Role of inflammation in depression relapse[J]. J Neuroinflammation, 2019, 16(1): 90. DOI: 10.1186/s12974-019-1475-7. [22] Lai CH, Wu YT. The alterations in regional homogeneity of parieto-cingulate and temporo-cerebellum regions of first-episode medication-naïve depression patients[J]. Brain Imaging Behav, 2016, 10(1): 187−194. DOI: 10.1007/s11682-015-9381-9. [23] 邱天爽, 戴睿娇, 刘亚洁. 基于静息态fMRI低频振幅的首发抑郁症与功能脑区关联研究[J]. 数据采集与处理, 2015, 30(5): 940−947. DOI: 10.16337/j.1004-9037.2015.05.003.
Qiu TS, Dai RJ, Liu YJ. Amplitude of low-frequency fluctuation in first-episode depressed patient on resting-sate functional magnetic resonance imaging[J]. J Data Acquis Process, 2015, 30(5): 940−947. DOI: 10.16337/j.1004-9037.2015.05.003.[24] Wang Y, Zhong SM, Jia YB, et al. Interhemispheric resting state functional connectivity abnormalities in unipolar depression and bipolar depression[J]. Bipolar Disord, 2015, 17(5): 486−495. DOI: 10.1111/bdi.12315. [25] Yue YY, Yuan YG, Hou ZH, et al. Abnormal functional connectivity of amygdala in late-onset depression was associated with cognitive deficits[J/OL]. PloS one, 2013, 8(9): e75058[2020-02-09]. https://pubmed.ncbi.nlm.nih.gov/24040385. DOI: 10.1371/journal.pone.0075058. -

 点击查看大图

计量
- 文章访问数: 4487
- HTML全文浏览量: 3146
- PDF下载量: 24
