


-
随着SPECT/CT被广泛应用,CT衰减校正(CT attenuation correction,CTAC)技术也受到了众多临床工作者的关注,但其诊断的准确性存有争议。Shibutani等[1]发现,CTAC后可明显提高左心室下壁的放射性摄取率10%~15%。卫华等[2]研究结果表明,CTAC能够有效地鉴别心肌灌注显像(myocardial perfusion imaging,MPI)中左心室下后壁的伪影,但在心尖和前壁可引起新伪影的出现。
智能(intelligence quotient, IQ)-SPECT/CT采集技术是使用心脏专用多焦点准直器(SMART-ZOOM准直器)进行图像采集,具有灵敏度及空间分辨率高、扫描时间短、注射显像剂剂量少及辐射剂量低等优点[3]。李珺奇等[4]研究结果显示,IQ-SPECT/CT CTAC后,受检者左心室下壁和间壁的放射性摄取值明显升高,心尖部则显著降低。本研究中,我们对31例MPI确诊或可疑的冠心病患者同日分别行IQ-SPECT/CT和低能高分辨率(low energy high resolution,LEHR)-SPECT/CT,然后进行图像采集以及CTAC,通过量化血流灌注SPECT(quantitative perfusion SPECT,QPS)分析软件计算出心肌节段的放射性摄取值(%),比较经CTAC后IQ-SPECT/CT与LEHR-SPECT/CT MPI图像的变化,评价CTAC对两种采集方式所得图像的影响。
-
收集2018年5月至2018年10月在山西医科大学第一医院核医学科行静息MPI的患者31例(男性21例、女性10例),年龄19~63(49.4±12.01)岁。其中6例患有2型糖尿病、11例患有高血压。入选标准:可疑和(或)确诊为冠心病的患者。排除标准:严重心律不齐的患者。
-
德国西门子公司生产的Siemens Symbia T16双探头SPECT/CT仪。显像剂为 99Tcm- MIBI(99Tcm由北京原子高科公司提供,MIBI由江苏省原子医学研究所江原制造厂提供),放射化学纯度>95%。
-
所有患者在空腹状态下静脉注射99Tcm-MIBI 925 MBq(25 mCi),于20 min后进食脂肪餐,60 min后行SPECT MPI,随后行IQ-SPECT/CT+CTAC与LEHR-SPECT/CT+CTAC。
采用IQ-SPECT/CT门控技术、SMART-ZOOM准直器进行图像采集,参数:能峰140 keV、窗宽±20%、矩阵128×128、放大倍数1.00。患者取仰卧位,双上臂抱头、固定,从右前斜38°至左后斜66°旋转采集208°。IQ-SPECT/CT两个探头共采集34帧,25 s/帧,约8 min。采用有序子集最大期望值法重建图像,重建参数:迭代次数10、子集3。采用LHER-SPECT/CT门控技术、LEHR准直器进行图像采集,参数:能峰140 keV、窗宽±20%、矩阵 64×64、放大倍数1.45。患者取仰卧位,双上臂抱头、固定,探头贴近胸壁,从右前斜45°至左后斜45°旋转采集180°。LHER-SPECT/CT两个探头共采集64帧,35 s/帧,约20 min。采用Butterworth滤波反投影法重建图像,重建参数:截止频率为 0.6、陡度因子为5(机器默认参数)。
IQ-SPECT/CT与LHER-SPECT/CT图像采集完成后分别行CTAC,扫描参数均为管电压130 kV、管电流13 mAs、层厚5 mm、螺距1.0。
-
①视觉分析:由两名有10年以上工作经验的核医学科医师分别对同一患者的IQ-SPECT/CT CTAC前后图像及手动配位后图像、LEHR-SPECT/CT MPI CTAC前后图像进行双盲法分析判断,如果意见不一致则寻求第3名有10年以上工作经验的核医学科医师判别。②半定量分析:QPS软件自动将左心室心肌分为17节段,以靶心图内最高放射性计数为100%,自动获取左心室各节段的放射性摄取值(%)。放射性摄取值(%)=某个心肌节段的放射性计数/靶心图内放射性计数最高心肌节段×100%。将17节段分为5个大心肌节段(心尖段;前壁:前壁心尖段、中段及基底段;侧壁:侧壁心尖段、中段及基底段;间壁:间壁心尖段、中段及基底段;下壁:下壁心尖段、中段及基底段),评价CTAC对IQ-SPECT/CT和LHER-SPECT/CT各心肌节段放射性摄取值的影响。
-
采用SPSS21.0软件对数据进行统计学分析。对符合正态分布的计量资料用均数±标准差(
$\bar{{{x}}}\pm s$ )表示,两组间比较采用配对t检验。率的比较采用卡方检验。一致性分析采用Kappa检验,Kappa系数值<0.20、0.21~0.40、0.41~0.60、0.61~0.80、0.81~1.00分别代表一致性强度较差、一般、中等、较强、强。P<0.05为差异有统计学意义。 -
CTAC前,IQ-SPECT/CT MPI图像正常者10名、异常者21例;LEHR-SPECT/CT MPI图像正常者13名、异常者18例,两组各心肌节段MPI图像正常者、异常者的比较均无明显差异,且具有很高的一致性(Kappa值=0.795,P<0.001)。IQ-SPECT/CT、LEHR-SPECT/CT CTAC前有3例患者左心室下壁的放射性分布不一致,在IQ-SPECT/CT中放射性分布略稀疏,而在LEHR-SPECT/CT中放射性分布基本正常。
-
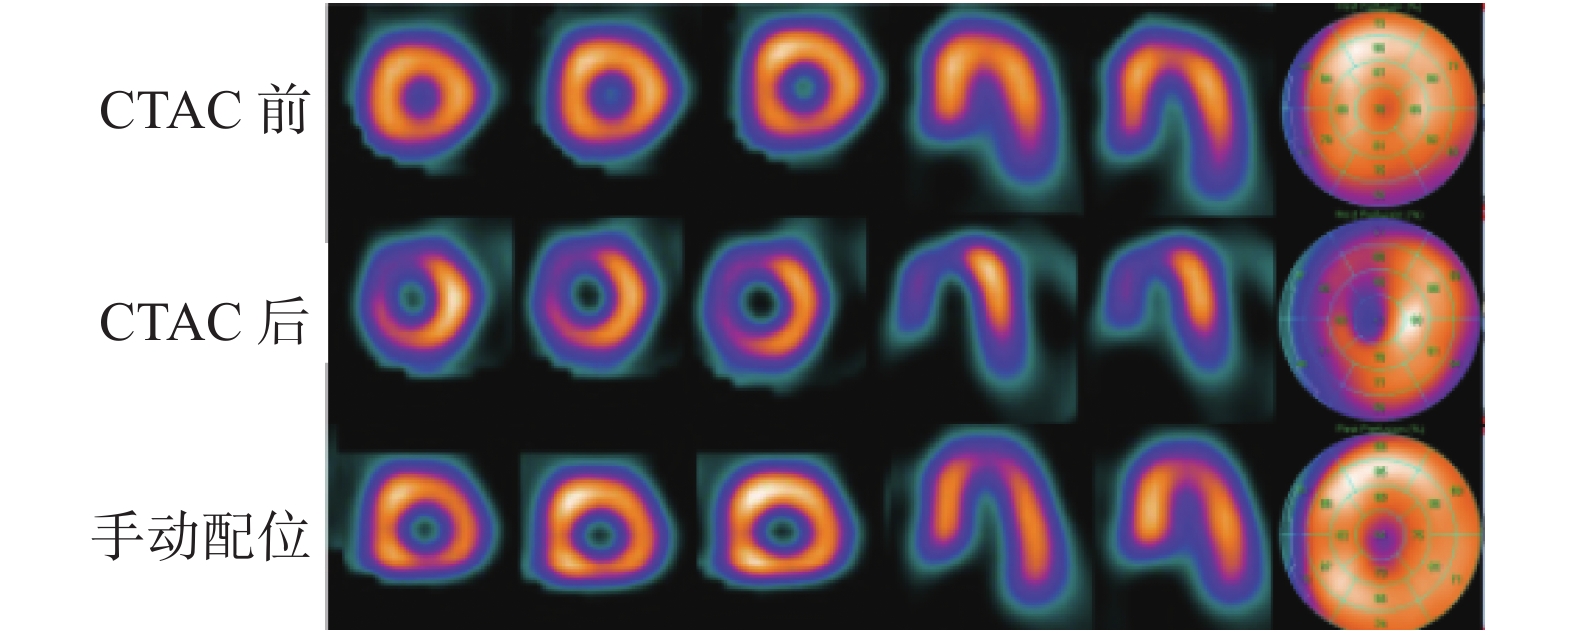
IQ-SPECT/CT CTAC后有17例患者(55%,17/31)的左心室间壁放射性分布明显稀疏(图1),7例患者(23%,7/31)的左心室前壁明显稀疏;LEHR-SPECT/CT CTAC后有7例患者(23%,7/31)的左心室心尖放射性分布明显稀疏,14例患者(45%,14/31)的左心室下壁放射性得到补偿。两种方法比较,IQ-SPECT/CT CTAC后心肌节段出现明显稀疏的比例(77%,24/31)显著高于LEHR-SPECT/CT CTAC后(23%,7/31),且差异有统计学意义(χ2=16.52,P<0.001)(表1)。
显像方法 心尖 前壁 侧壁 下壁 间壁 合计(稀疏) IQ-SPECT/CT CTAC后 0 7(稀疏) 0 0 17(稀疏) 24 a LEHR-SPECT/CT CTAC后 7(稀疏) 0 0 14(补偿) 0 7 IQ-SPECT/CT CTAC手动配位后 5(稀疏) 0 0 15(补偿) 2(补偿) 5 注:表中,a: 与LEHR-SPECT/CT CTAC后相比,差异有统计学意义(χ 2=16.52,P<0.001)。IQ:智能;SPECT:单光子发射计算机体层摄影术;CT:计算机体层摄影术;AC:衰减校正;LEHR:低能高分辨率 表 1 IQ-SPECT/CT 、LEHR-SPECT/CT CTAC后和IQ-SPECT/CT CTAC手动配位后左心室各室壁的放射性分布情况(例)
Table 1. The radioactivity distribution of left ventricular wall after intelligence quotient-SPECT/CT, low energy high resolution-SPECT/CT CT attenuation correction and intelligence quotient-SPECT/CT CT attenuation correction manual coordination (case)
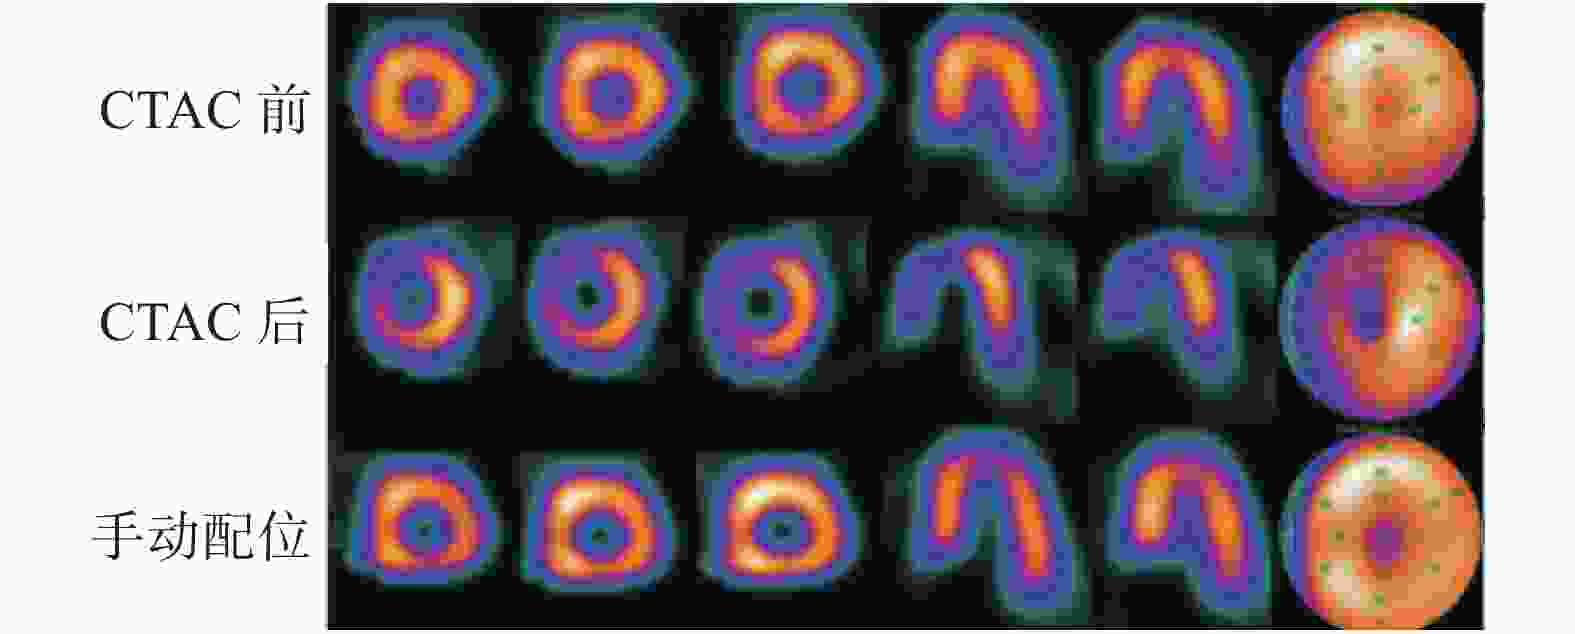
图 1 高血压患者(女性,63岁)的IQ-SPECT/CT CTAC前后及手动配位后MPI的对比图
Figure 1. Comparison of myocardial perfusion imaging before and after intelligence quotient-SPECT/CT CT attenuation correction and manual coordination (female patient with hypertension, 63 years old)
-
由表1可知,IQ-SPECT/CT CTAC后心肌节段出现明显稀疏的比例较高(24/31,77%),对其原始图像分析后发现,31例患者(31/31,100%)均存在不同程度的配位不准。而在LEHR-SPECT/CT 中,分析31例患者(31/31,100%)的原始图像后,发现配位良好。将IQ-SPECT/CT MPI与CT图像进行手动重新配位后发现,5例患者(16%,5/31)心尖放射性分布稀疏、15例患者(48%,15/31)下壁放射性得到补偿、2例患者(6%,2/31)间壁放射性得到补偿。配位后与LEHR-SPECT/CT (23%,7/31)比较,差异无统计学意义(χ2=0.103,P=0.748)。
-
由表2可知,IQ-SPECT/CT CTAC后左心室心尖、前壁、间壁的放射性摄取值明显低于CTAC前(t=4.014、4.232、5.473,均P<0.05);左心室下壁的放射性摄取值高于CTAC前;IQ-SPECT/CT CTAC配位后与CTAC前比较,左心室心尖的放射性摄取值降低(t=3.439,P=0.002);前壁、侧壁、下壁和间壁的放射性摄取值均增高,且差异均有统计学意义(t=−2.497,P=0.018;t=−2.672,P=0.012;t=−7.632, P<0.001;t=−3.557,P <0.001)。由表3可知,LEHR-SPECT/CT CTAC后左心室前壁、下壁及间壁的放射性摄取值明显高于CTAC前,且差异均有统计学意义。
显像方法 心尖 前壁 侧壁 下壁 间壁 IQ-SPECT/CT CTAC前 65.71±25.69 204.23±43.24 355.81±46.79 191.58±33.06 316.19±47.43 IQ-SPECT/CT CTAC后 58.68±20.39a 184.66±41.22a 351.58±49.27 203.26±30.18 270.03±65.33a IQ-SPECT/CT CTAC手动配位后 59.65±19.08a 212.06±33.59a 372.84±39.37a 219.13±25.10a 335.00±36.84a 注:表中,a: 与IQ-SPECT/CT CTAC前相比,差异有统计学意义(t=−7.632~5.473, P<0.05)。IQ:智能;SPECT:单光子发射计算机体层摄影术;CT:计算机体层摄影术;AC:衰减校正 表 2 IQ-SPECT/CT CTAC前后及手动配位后左心室各室壁的放射性摄取值比较(%,
$\bar x$ Table 2. Comparison of left ventricular wall radioactive uptake value before and after intelligence quotient-SPECT/CT CT attenuation correction and after manual coordination (%,
$\bar x $ 显像方法 心尖 前壁 侧壁 下壁 间壁 LEHR-SPECT/CT CTAC前 63.10±21.60 204.68±41.14 360.97±38.87 185.48±31.06 319.13±44.90 LEHR-SPECT/CT CTAC后 63.10±19.08 211.81±35.04 363.96±38.49 228.67±29.45 350.87±44.24 t值 0.947 −2.471 −0.593 −11.311 −5.968 P值 0.351 0.019 0.558 <0.001 <0.001 注:表中,LEHR:低能高分辨率;SPECT:单光子发射计算机体层摄影术;CT:计算机体层摄影术;AC:衰减校正 表 3 LEHR-SPECT/CT CTAC前后左心室各室壁的放射性摄取值比较(%,
$ \bar x $ Table 3. Comparison of left ventricular wall radioactive uptake values before and after low energy high resolution-SPECT/CT CT attenuation correction(%,
$ \bar x $ -
随着SPECT/CT的普及,CTAC技术的优势逐渐突出。CT图像在提供准确解剖定位信息的同时,还能为MPI提供准确的AC数据,从而提高MPI断层图像的质量。有研究结果表明,无论静息显像还是负荷显像,CTAC后图像的放射性摄取值均比CTAC前的图像增加了2~3倍,而且室壁各阶段的放射性分布趋于均匀[5]。
IQ-SPECT/CT是一种针孔采集技术,目前针对这种技术行CTAC的相关报道还较少。Matsuo等 [6]比较了IQ-SPECT/CT、LEHR- SPECT/CT CTAC前的MPI图像,结果显示,两种方法在17节段心肌显像的放射性分布差异均无统计学意义。本研究中,IQ-SPECT/CT、LEHR-SPECT/CT CTAC前MPI图像的结果比较具有很高的一致性,这与Matsuo等[6]的研究结果一致。
在MPI中,膈肌和乳腺会对心脏的室壁造成软组织衰减,从而导致衰减伪影,主要表现为左心室下壁和侧壁的放射性分布稀疏或缺损[7]。Nakajima等[8]研究发现,CTAC后可以显著提高左心室下壁及侧壁的放射性摄取值。本研究中我们发现,LEHR- SPECT/CT CTAC后左心室下壁的放射性得到补偿,但IQ- SPECT/CT CTAC后没有任何变化。
Raza等[9]研究结果表明,CTAC后左心室心尖及前壁放射性分布较CTAC前稀疏。本研究结果表明,无论是LEHR- SPECT/CT还是IQ- SPECT/CT CTAC后均出现了左心室心尖放射性摄取值下降。这可能是由于心尖相对较薄,容易受部分容积效应的影响,使CTAC对心尖补偿不足[10]。但是IQ-SPECT/CT CTAC后,左心室前壁和间壁均出现了放射性摄取值明显下降。通过分析原始图像后发现,31例患者均出现不同程度的配位不准。IQ-SPECT/CT CTAC后矫枉过正现象较LEHR-SPECT/CT CTAC后发生概率高。理论上,IQ-SPECT/CT采集8 min,LEHR-SPECT/CT采集20 min,LEHR-SPECT/CT出现配位不准的概率更大。但本研究结果表明,IQ-SPECT/CT CTAC更易出现矫枉过正,这可能是由于IQ-SPECT/CT采集技术使用SMART-ZOOM准直器,以心脏为焦点进行采集,使得心脏始终处于准直器的最敏感区域,能在保持其余脏器显像完整的同时,放大心脏及周围区域[11]。在这种模式下,放大心脏的同时,这可能会放大患者的体位移动、呼吸活动,致使IQ-SPECT/CT与CT配准不良,从而导致矫枉过正。因此,IQ-SPECT/CT CTAC是否更容易造成配位不准我们仍在摸索中。
有研究结果表明,配位不准与重新配位之间放射性分布有差异,且重新配位之后放射性分布有所改善[12]。黄克敏等[13]对110例受检者行MPI+CTAC,结果表明,58例受检者(58/110,52.73%)出现配准不良,对配准不良的图像重新配准后,心尖、前壁和侧壁的放射性摄取值均明显增加。本研究通过对31例确诊或可疑的冠心病患者IQ-SPECT/CT原始图像进行分析,CTAC后均出现配位不良,将MPI与CT图像重新手动配位,配位后与IQ-SPECT/CT CTAC前相比,结果发现,左心室下壁和间壁放射性分布均有所增高,而心尖放射性分布减少。重新手动配位后对于左心室间壁及下壁均有补偿作用。本研究中配位后左心室心尖放射性摄取值降低,这可能是由于部分容积效应的影响[10]。
本研究采用配对研究,同一患者采用两种方法进行显像,可以回避伪影的影响。本研究结果还可提示,在临床工作中,应关注IQ-SPECT/CT CTAC的配位问题,在行图像判别时不仅要结合CTAC前后图像,必要时还应观察原始图像,在MPI与CT错配的情况下重新进行手动配位。
利益冲突 本研究由署名作者按以下贡献声明独立开展,不涉及任何利益冲突。
作者贡献声明 卫华负责研究命题的提出与设计、方法的建立、论文的撰写与修改;薛及弟负责实验数据的获取与分析、研究过程的实施;武志芳负责论文的审阅;张磊负责实验数据的随访、获取与分析;胡光、王进负责对技术问题进行指导。
CT衰减校正对IQ-SPECT/CT和LEHR-SPECT/CT心肌灌注显像的影响
Effect of CT attenuation correction on IQ-SPECT/CT and LEHR-SPECT/CT myocardial perfusion imaging
-
摘要:
目的 探讨CT衰减校正(CTAC)对智能(IQ)-SPECT/CT和低能高分辨率(LEHR)-SPECT/CT心肌血流灌注显像(MPI)图像的影响。 方法 收集2018年5月至10月在山西医科大学第一医院行静息心肌灌注显像(MPI)的31例确诊或者可疑的冠心病患者,其中男性21例、女性10例,年龄(49.4±12.01)岁。所有患者同日分别行IQ-SPECT/CT+CTAC及LEHR-SPECT/CT+CTAC。视觉分析IQ-SPECT/CT CTAC前后图像及手动配位后图像、LEHR-SPECT/CT CTAC前后断层图像;同时比较左心室各个室壁(心尖、前壁、侧壁、间壁、下壁)IQ-SPECT/CT和LEHR-SPECT/CT CTAC前后与重新配位后的放射性摄取值(%)。两组间比较采用配对t检验,率的比较采用卡方检验,一致性分析采用Kappa检验。 结果 ①视觉分析:IQ-SPECT/CT与LEHR-SPECT/CT CTAC前图像比较,具有很高的一致性(Kappa值=0.795,P<0.001)。IQ-SPECT/CT CTAC后心肌节段出现放射性分布明显稀疏的比例为77%(24/31),远高于LEHR- SPECT/CT CTAC后的23%(7/31),差异有统计学意义(χ2=16.52,P<0.001)。将MPI与CT图像手动重新配位后,IQ-SPECT/CT左心室心尖的放射性分布为16%(5/31),与LEHR-SPECT/CT的23%(7/31)相比,差异无统计学意义(χ2=0.103,P=0.748)。②放射性摄取值(%):IQ-SPECT/CT CTAC前后比较,左心室心尖[(65.71±25.69)%对(58.68±20.39)%]、前壁[(204.23±43.24)%对(184.66±41.22)%]及间壁[(316.19±47.43)%对(270.03±65.33)% ] 的放射性摄取值明显降低,且差异均有统计学意义(t=4.014、4.232、5.473,均P<0.05);LEHR-SPECT/CT CTAC前后比较,左心室前壁[(204.68±41.14)%对[(211.81±35.04)%]、间壁[(319.13±44.90)%对(350.87±44.24)%]及下壁[(185.48±31.06)%对(228.67±29.45)% ]的放射性摄取值显著增高,且差异均有统计学意义(t=−2.471,P =0.019;t=−5.968,P<0.001;t=−11.311,P<0.001)。IQ-SPECT/CT CTAC配位后与IQ-SPECT/CT CTAC前比较,左心室前壁[(212.06±33.59)%对(204.23±43.24)% ]、侧壁[(372.84±39.37)%对(355.81±46.79)%]、下壁[(219.13±25.10)%对(191.58±33.06)%]和间壁[(335.00±36.84)%对(316.19±47.43)%]的放射性摄取值均明显增高,且差异均有统计学意义(t=−2.497,P=0.018;t=−2.672,P=0.012;t=−7.632,P<0.001;t=−3.557,P<0.001) 。 结论 LEHR-SPECT/CT CTAC后左心室间壁及下壁的放射性分布得到补偿;而IQ-SPECT/CT CTAC后左心室心尖、前壁及间壁的放射性分布却更加稀疏。在IQ-SPECT/CT采集模式下,CTAC后容易出现矫枉过正,重新手动配位后这种情况将得到明显改善。 -
关键词:
- 体层摄影术,发射型计算机,单光子 /
- 体层摄影术,X线计算机 /
- 衰减校正 /
- 心肌灌注显像
Abstract:Objective To evaluate the impact of CT attenuation correction (CTAC) on intelligence quotient (IQ)-SPECT/CT and low energy high resolution (LEHR)- SPECT/CT myocardial perfusion imaging (MPI). Methods Thirty-one patients (21 males and 10 females, aged 49.4 ± 12.01 years) with confirmed or suspected coronary heart disease were subjected to resting MPI from May 2018 to Octorber 2018 in the First Hospital of Shanxi Medical University. All patients were subjected to IQ-SPECT/CT+CTAC and LEHR-SPECT/CT+CTAC on the same day. The visual analysis and myocardial uptake of five myocardial segments (apical, anterior, lateral, inferior, and septal walls) were compared before and after IQ-SPECT/CT CTAC and after manual coordination, as well as before and after LEHR-SPECT/CT CTAC. Paired t test was used for comparison between the two groups. Chi-square test was used to compare the rate. Kappa test was used for consistency analysis. Results (1) Visual analysis results were as follows. The IQ group was compared with the LEHR group without CTAC. Two nuclear medicine physicians were double blind and had high agreement (Kappa value = 0.795, P<0.001). The sparse rate of myocardial segments of the IQ group was 77% (24/31), which was much higher than that of the LEHR group by 23% (7/31) ( χ2=16.52, P<0.001). Owing to the high sparse rate myocardial segments of IQ, the original image and manual reregistration the MPI and CT images were analyzed. After re-coordination, the distribution of apical in the IQ group was found to be sparse (16%, 5/31), and the difference between the LEHR group (23%, 7/31) was not statistically significant (χ2=0.103, P=0.748). (2) Results of myocardial uptake were as follows. Compared with the previous IQ-CTAC, the myocardial uptake values of the apical wall [(65.71±25.69)% vs.(58.68±20.39)%], anterior wall[ (204.23±43.24)% vs.(184.66±41.22)%], and septal wall [ (316.19±47.43)% vs. (270.03±65.33)% ] significantly decreased after CTAC(t=4.014, 4.232, and 5.473, respectively; all P<0.05). Meanwhile, myocardial uptake increased in anterior wall [ (204.68±41.14) % vs. (211.81±35.04)%], septal wall[ (319.13±44.90)% vs.( 350.87±44.24)%], and inferior wall [(185.48±31.06)% vs.( 228.67±29.45)% ] of the LEHR group after CTAC(t=−2.471, P=0.019; t=−5.968, P<0.001; and t=−11.311, P<0.001, respectively). After IQ registration, compared with previous CTAC, the myocardial uptake values of anterior wall [(212.06±33.59)% vs. (204.23±43.24)%], lateral wall [(372.84±39.37)% vs. (355.81±46.79)%], inferior wall [(219.13±25.10)% vs. (191.58±33.06)%], and septal wall [(335.00±36.84)% vs. (316.19±47.43)%] obviously increased (t=−2.497, P=0.018; t=2.672, P=0.012; t=−7.632, P<0.001 and t=−3.557, P<0.001, respectively). Conclusions The distribution of inferior and inferior walls of LEHR-SPECT/CT CTAC was compensated, whereas the distribution of apical, anterior, and septal walls became sparse after IQ-SPECT/CT CTAC. In the IQ-SPECT/CT acquisition mode, overcorrection likely occurred after CTAC, and this situation was significantly improved after re-coordination. -
图 1 高血压患者(女性,63岁)的IQ-SPECT/CT CTAC前后及手动配位后MPI的对比图
Figure 1. Comparison of myocardial perfusion imaging before and after intelligence quotient-SPECT/CT CT attenuation correction and manual coordination (female patient with hypertension, 63 years old)
表 1 IQ-SPECT/CT 、LEHR-SPECT/CT CTAC后和IQ-SPECT/CT CTAC手动配位后左心室各室壁的放射性分布情况(例)
Table 1. The radioactivity distribution of left ventricular wall after intelligence quotient-SPECT/CT, low energy high resolution-SPECT/CT CT attenuation correction and intelligence quotient-SPECT/CT CT attenuation correction manual coordination (case)
显像方法 心尖 前壁 侧壁 下壁 间壁 合计(稀疏) IQ-SPECT/CT CTAC后 0 7(稀疏) 0 0 17(稀疏) 24 a LEHR-SPECT/CT CTAC后 7(稀疏) 0 0 14(补偿) 0 7 IQ-SPECT/CT CTAC手动配位后 5(稀疏) 0 0 15(补偿) 2(补偿) 5 注:表中,a: 与LEHR-SPECT/CT CTAC后相比,差异有统计学意义(χ 2=16.52,P<0.001)。IQ:智能;SPECT:单光子发射计算机体层摄影术;CT:计算机体层摄影术;AC:衰减校正;LEHR:低能高分辨率  下载: 导出CSV
表 2 IQ-SPECT/CT CTAC前后及手动配位后左心室各室壁的放射性摄取值比较(%,
$\bar x$ Table 2. Comparison of left ventricular wall radioactive uptake value before and after intelligence quotient-SPECT/CT CT attenuation correction and after manual coordination (%,
$\bar x $ 显像方法 心尖 前壁 侧壁 下壁 间壁 IQ-SPECT/CT CTAC前 65.71±25.69 204.23±43.24 355.81±46.79 191.58±33.06 316.19±47.43 IQ-SPECT/CT CTAC后 58.68±20.39a 184.66±41.22a 351.58±49.27 203.26±30.18 270.03±65.33a IQ-SPECT/CT CTAC手动配位后 59.65±19.08a 212.06±33.59a 372.84±39.37a 219.13±25.10a 335.00±36.84a 注:表中,a: 与IQ-SPECT/CT CTAC前相比,差异有统计学意义(t=−7.632~5.473, P<0.05)。IQ:智能;SPECT:单光子发射计算机体层摄影术;CT:计算机体层摄影术;AC:衰减校正
下载: 导出CSV
表 3 LEHR-SPECT/CT CTAC前后左心室各室壁的放射性摄取值比较(%,
$ \bar x $ Table 3. Comparison of left ventricular wall radioactive uptake values before and after low energy high resolution-SPECT/CT CT attenuation correction(%,
$ \bar x $ 显像方法 心尖 前壁 侧壁 下壁 间壁 LEHR-SPECT/CT CTAC前 63.10±21.60 204.68±41.14 360.97±38.87 185.48±31.06 319.13±44.90 LEHR-SPECT/CT CTAC后 63.10±19.08 211.81±35.04 363.96±38.49 228.67±29.45 350.87±44.24 t值 0.947 −2.471 −0.593 −11.311 −5.968 P值 0.351 0.019 0.558 <0.001 <0.001 注:表中,LEHR:低能高分辨率;SPECT:单光子发射计算机体层摄影术;CT:计算机体层摄影术;AC:衰减校正
下载: 导出CSV
-
[1] Shibutani T, Onoguchi M, Yoneyama H, et al. Characteristics of iodine-123 IQ-SPECT/CT imaging compared with conventional SPECT/CT[J]. Ann Nucl Med, 2019, 33(2): 103−111. DOI: 10.1007/s12149-018-1310-8. [2] 卫华, 李思进, 刘建中, 等. X线衰减校正用于99mTc-N-NOET SPECT心肌灌注显像[J]. 中国医学影像技术, 2010, 26(10): 1953−1956. DOI: 10.13929/j.1003-3289.2010.10.063.
Wei H, Li SJ, Liu JZ, et al. X-ray attenuation correction on 99mTc-N-NOET SPECT myocardial perfusion imaging[J]. Chin J Med Imaging Technol, 2010, 26(10): 1953−1956. DOI: 10.13929/j.1003-3289.2010.10.063.[3] Gremillet E, Agostini D. How to use cardiac IQ·SPECT routinely? An overview of tips and tricks from practical experience to the literature[J]. Eur J Nucl Med Mol Imaging, 2016, 43(4): 707−710. DOI: 10.1007/s00259-015-3269-1. [4] 李珺奇, 焦建, 牟甜甜, 等. CT衰减校正在IQ-单光子发射型电子计算机断层扫描心肌灌注显像中的应用价值[J]. 心肺血管病杂志, 2017, 36(10): 853−857. DOI: 10.3969/j.issn.1007-5062.2017.10.016.
Li JQ, Jiao J, Mou TT, et al. Influence of CT attenuation correction on IQ-single photon emission CT myocardial perfusion imaging in patients without coronary artery disease[J]. J Cardiovasc Pulm Dis, 2017, 36(10): 853−857. DOI: 10.3969/j.issn.1007-5062.2017.10.016.[5] Xin WC, Shao XL, Wang YT, et al. Is there an incremental value to use myocardial perfusion imaging with or without CT attenuation for the diagnosis of coronary artery disease? A study in Chinese patients[J]. Hell J Nucl Med, 2018, 21(1): 48−54. DOI: 10.1967/s002449910706. [6] Matsuo S, Nakajima K, Onoguchi M, et al. Nuclear myocardial perfusion imaging using thallium-201 with a novel multifocal collimator SPECT/CT: IQ-SPECT versus conventional protocols in normal subjects[J]. Ann Nucl Med, 2015, 29(5): 452−459. DOI: 10.1007/s12149-015-0965-7. [7] Peli A, Camoni L, Zilioli V, et al. Attenuation correction in myocardial perfusion imaging affects the assessment of infarct size in women with previous inferior infarct[J]. Nucl Med Commu, 2018, 39(4): 290−296. DOI: 10.1097/MNM.0000000000000813. [8] Nakajima K, Okuda K, Momose M, et al. IQ-SPECT technology and its clinical applications using multicenter normal databases[J]. Ann Nucl Med, 2017, 31(9): 649−659. DOI: 10.1007/s12149-017-1210-3. [9] Raza H, Jadoon LK, Mushtaq S, et al. Comparison of non-attenuation corrected and attenuation corrected myocardial perfusion SPECT[J]. Egyptian J Radiol Nucl Med, 2016, 47(3): 783−792. DOI: 10.1016/j.ejrnm.2016.05.006. [10] Ogino Y, Horiguchi Y, Ueda T, et al. A myocardial perfusion imaging system using a multifocal collimator for detecting coronary artery disease: validation with invasive coronary angiography[J]. Ann Nucl Med, 2015, 29(4): 366−370. DOI: 10.1007/s12149-015-0955-9. [11] Matsutomo N, Nagaki A, Sasaki M. Performance of myocardial perfusion imaging using multi-focus fan beam collimator with resolution recovery reconstruction in a comparison with conventional SPECT[J]. Asia Ocean J Nucl Med Biol, 2014, 2(2): 111−119. [12] Apostolopoulos DJ, Gsowska M, Savvopoulos CA, et al. The impact of transmission-emission misregistration on the interpretation of SPET/CT myocardial perfusion studies and the value of misregistration correction[J]. Hell J Nucl Med, 2015, 18(2): 114−121. DOI: 10.1967/s002449910205. [13] 黄克敏, 冯彦林, 温广华, 等. SPECT/CT心肌灌注显像图像配准情况及其对图像质量的影响[J]. 中国医学影像技术, 2014, 30(10): 1574−1578. DOI: 10.13929/j.1003-3289.2014.10.036.
Huang KM, Feng YL, Wen GH, et al. Images registration of SPECT/CT myocardial perfusion imaging and effect on image quality[J]. Chin J Med Imaging Technol, 2014, 30(10): 1574−1578. DOI: 10.13929/j.1003-3289.2014.10.036. -

 点击查看大图
计量
- 文章访问数: 3224
- HTML全文浏览量: 1988
- PDF下载量: 14
