


-
替莫唑胺(temozolomide, TMZ)是初诊或复发性胶质瘤患者的重要化疗药物[1]。O6-甲基鸟嘌呤-DNA甲基转移酶(O6-methylguanine-DNA methyl-transferase, MGMT)基因甲基化可使胶质瘤患者对TMZ治疗产生更好的临床反应,特别是能显著延长患者的生存期[2]。因此,MGMT基因甲基化状态的评估对于胶质瘤患者治疗方案的选择至关重要。
18F-FDG PET/CT已被广泛应用于神经胶质瘤的诊断。葡萄糖代谢可以直接反映胶质瘤的代谢特征,并进一步指示胶质瘤的生物学特征,如肿瘤细胞的增殖状态、胶质瘤的分级和内在的血管分布等[3-4]。尽管术中组织病理学检查仍是诊断胶质瘤的“金标准”,但利用分子探针来探索显像剂与胶质瘤分子特征之间的相关性逐渐成为研究焦点。已有研究结果发现,通过分析18F-FDG的代谢指标[肿瘤与正常组织摄取率(tumor-to-normal-tissue uptake ratio,TNR)]能够预测MGMT基因的甲基化状态[5]。
影像组学通过提取ROI高通量的图像特征,能将肉眼不可见的影像信息转化为多维可挖掘的空间特征数据[6]。相关研究结果表明,影像组学的研究方法相较于传统的手动勾画ROI,能够从图像中获取更多有用的信息,此类信息对于提高确诊率和预测预后至关重要[7-8],特别是近年来,因其可无创、重复且整体分析肿瘤内部异质性而愈发受到重视[9-10]。
据笔者所知,迄今尚未有已发表的研究通过分析18F-FDG PET/CT图像的纹理特征来探索胶质瘤的特征与MGMT基因甲基化状态之间的关系。本研究尝试以此来综合评估MGMT基因甲基化状态,以预测胶质瘤患者对TMZ治疗的反应,并探索胶质瘤的多种生物学特性,以服务于临床诊疗。
-
回顾性分析2016年1月至2018年9月在中国人民解放军总医院第一医学中心核医学科进行18F-FDG PET/CT检查的17例胶质瘤患者,其中男性13例、女性4例。纳入标准:(1)经病理学结果证实为胶质瘤患者;(2)初诊患者,做PET/CT之前未接受过其他治疗。排除标准:(1)患有其他重大疾病无法配合完成检查的患者;(2)有幽闭恐惧症等PET/CT检查禁忌症的患者。
-
按照标准程序取部分肿瘤样品固定在10%福尔马林中,并包埋在石蜡中。每一份肿瘤样品都进行苏木精-伊红染色,根据世界卫生组织(World Health Organization,WHO)国际肿瘤组织学分类确定肿瘤分级。
-
肿瘤标本取出后立即放入液氮中冷冻并储存在–80℃冰箱中。参照DNeasy Blood and Tissue试剂盒(美国Qiagen公司)说明书的步骤提取基因组DNA。
-
按照文献[11]中的焦磷酸测序法来分析、确定MGMT基因的甲基化状态。根据说明书提示的步骤,使用EZ DNA Methylation-Gold试剂盒(美国Zymo Research公司)对从肿瘤组织中提取的DNA进行亚硫酸氢盐修饰。使用PyroMark PCR试剂盒(美国Qiagen公司)将亚硫酸氢盐修饰的DNA用于PCR;PCR的阴性对照组则用水代替模板DNA。将MGMT基因的PCR条件设定为95℃15 min;45个循环,95℃持续20 s,53℃持续20 s,72℃持续20 s,在72℃下维持5 min,最后储存在4℃条件下。将PCR产物固定在珠子上并进行链分离。使用PyroMark CpG MGMT试剂盒(美国Qiagen公司)中提供的测序引物在PyroMark Q96ID焦磷酸测序仪(美国Qiagen公司)上进行焦磷酸甲基化测序。使用PyroMark CpG MGMT试剂盒检测MGMT基因外显子1上的5个CpG位点的甲基化水平;将未紧临鸟嘌呤的胞嘧啶作为完成亚硫酸氢盐转化的内部对照,记录下每个CpG位点的甲基化百分比(胞嘧啶的含量百分比)。甲基化高于任何单个CpG岛的10%或5个CpG岛平均值的样品视为阳性(甲基化组);甲基化低于10%的样品视为阴性(未甲基化组)。
-
18F-FDG PET/CT检查在手术前7 d内进行;患者禁食至少6 h。所有检查均使用德国西门子公司的Siemens Biograph 64 TruePoint PET/CT扫描仪,检查前患者安静休息约30 min,经肘静脉注射3.7 MBq/kg的18F-FDG(由中国人民解放军总医院第一医学中心核医学科18F-FDG自动化合成模块合成,放射化学纯度>95%),继续安静休息40 min后,使用512×512矩阵以螺旋模式进行CT采集(管电压120 kV、管电流110 mAs)。以三维模式进行PET全身扫描(从下颌骨至股骨上部),头部采集1个床位,采集时间4 min。后行PET显像,采用迭代重建算法(迭代3次,每次21个子集),层厚5 mm。再使用CT对PET图像进行衰减校正。经CT衰减校正后获得横断面、矢状面和冠状面的PET/CT图像。
-
使用专用的图像后处理软件Multiparametric Analysis(德国西门子医疗系统有限公司)进行图像分析。由2位核医学科医师(1位具有10年神经疾病诊断经验,另1位具有3年纹理特征分析经验)根据PET/CT图像手动勾画肿瘤的感兴趣体积(volume of interest,VOI)进行纹理分析。通过分析基于VOI的信号强度直方图,该软件可提供图像的一阶纹理特征,包括排除了最小5%和最大5%体素的平均标准化摄取值(mean standardized uptake value,SUVmean)、Percentile 5th、Percentile 95th、Skewness、Kurtosis、DiffEntropy、DiffVariance、Contrast和Entropy。此外,通过软件也可计算常规参数,如全部体素的SUVmean、SUVmax、代谢肿瘤体积(metabolic tumor volume,MTV)、糖酵解总量(total lesion glycolysis,TLG)和皮质TNR。为了计算正常的SUV摄取,手动在PET图像上对肿瘤病变对侧的顶叶皮质绘制感兴趣环形区域[5,12]。
-
使用SPSS23.0软件进行统计学分析。符合正态分布的定量指标用均数±标准差表示。若方差齐,定量变量均值的比较采用两独立样本t检验;若方差不齐,则采用Levene检验。所有P值均设置为双侧,P<0.05为差异有统计学意义。
-
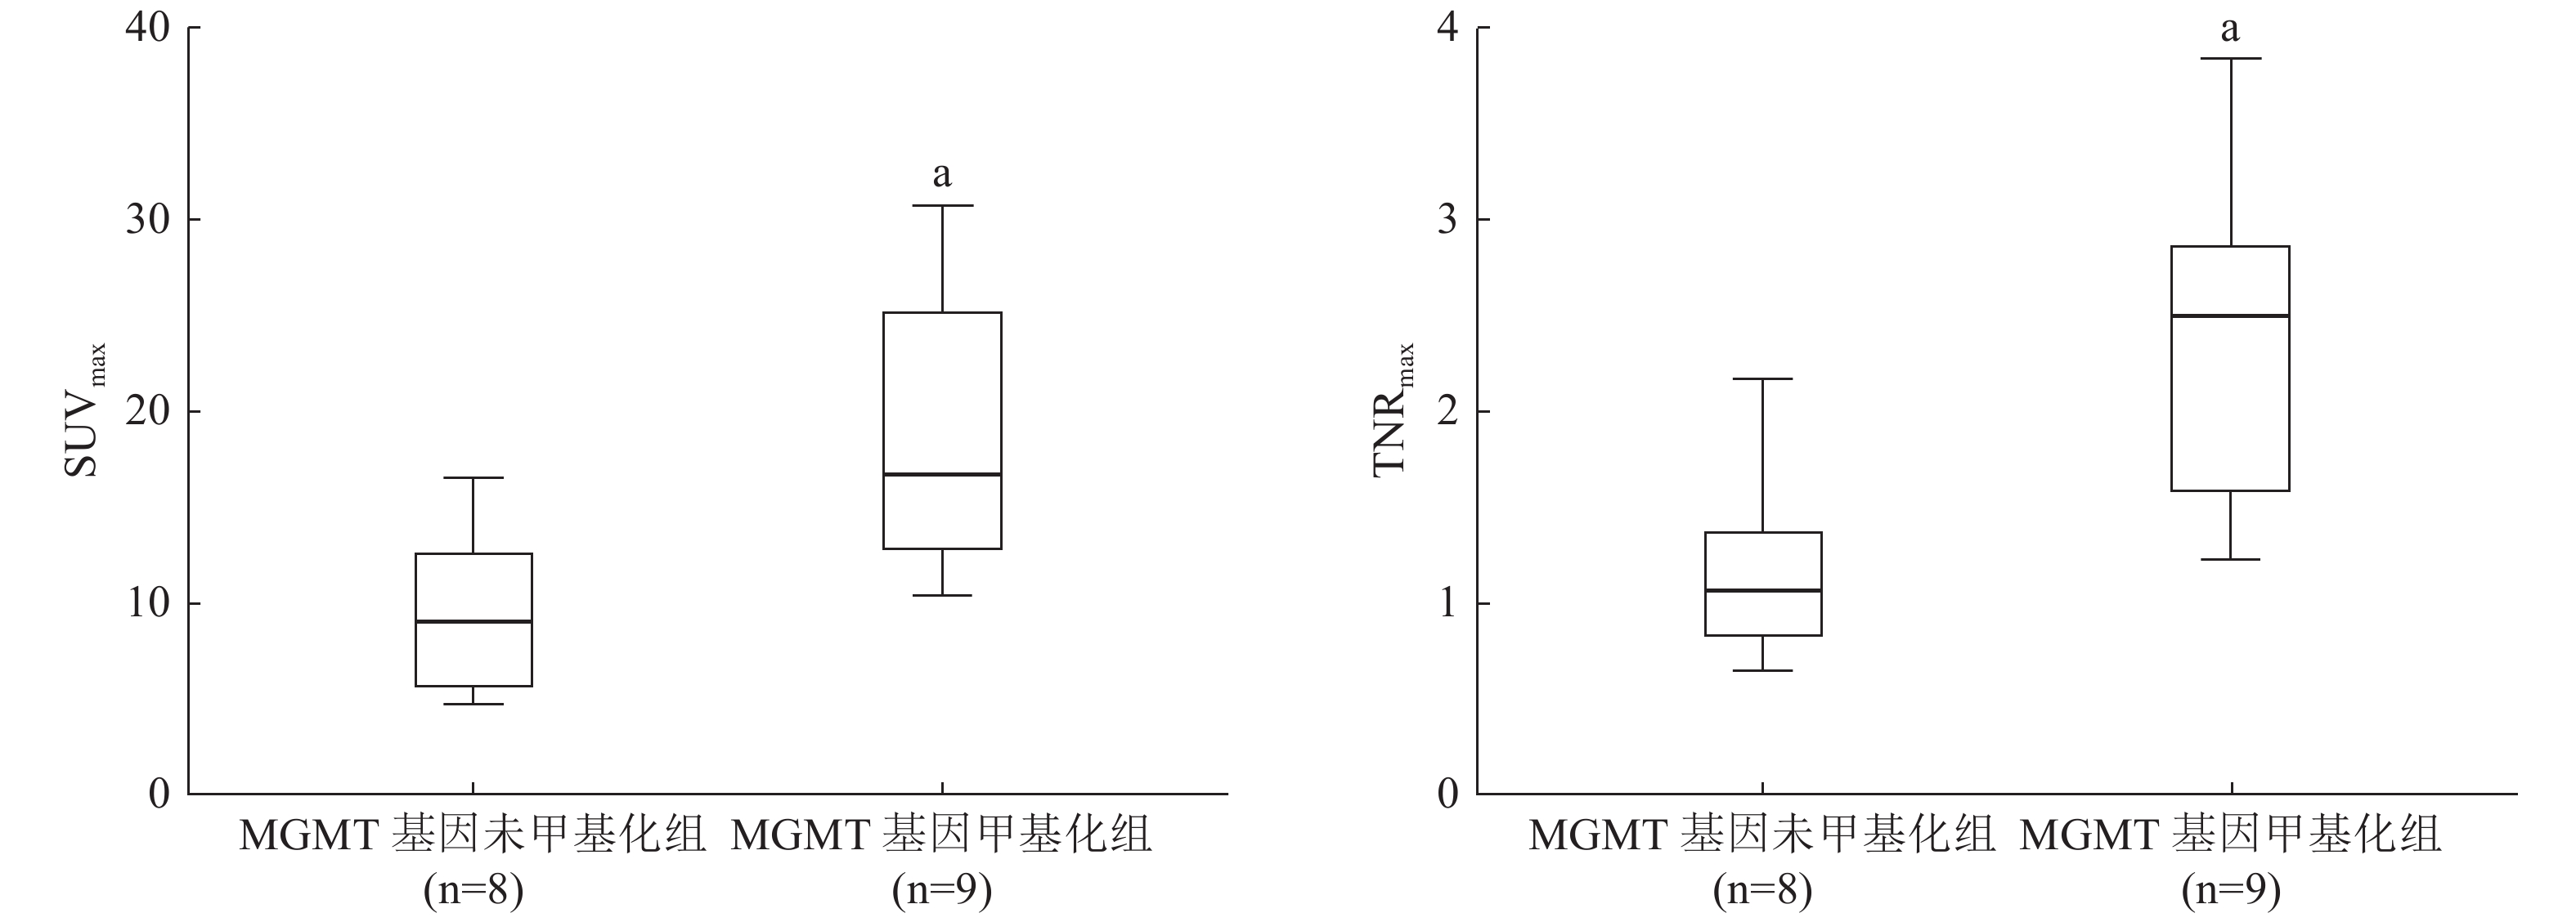
17例患者中,2例(11.8%)经组织病理学结果证实为WHO国际肿瘤组织学分类Ⅰ级、1例(5.9%)为Ⅲ级、14例(82.4%)为Ⅳ级胶质瘤。9例(52.9%)患者的MGMT基因甲基化(甲基化组)、8例(47.1%)患者的MGMT基因未甲基化(未甲基化组)。甲基化组与未甲基化组比较,患者的年龄和肿瘤分级的差异无统计学意义(t=−0.251、−0.016, P=0.806、0.198);而性别之间的差异有统计学意义(t=−1.426,P=0.031)(表1)。MGMT基因甲基化组的SUVmax高于MGMT基因未甲基化组的SUVmax,且差异有统计学意义(t=−3.095,P=0.007);MGMT基因甲基化组的TNRmax也高于MGMT基因未甲基化组,差异有统计学意义(t=−3.402,P=0.004)。18F-FDG PET/CT图像的常规半定量指标、直方图特征及纹理特征间的差异均无统计学意义(表1)。典型病例的PET/CT图像见图1,MGMT基因甲基化组与未甲基化组胶质瘤患者18F-FDG PET图像的SUVmax和TNRmax比较见图2。
MGMT基因未甲基化组(n=8) MGMT基因甲基化组(n=9) t值 P值 临床指标 年龄(岁) 45.7±19.6 47.9±16.3 −0.251 0.806 性别(男∶女,例) 8∶0 5∶4 −1.426 0.031 肿瘤级别(Ⅰ∶Ⅱ∶Ⅲ∶Ⅳ,例) 2∶0∶0∶6 0∶0∶1∶8 −0.016 0.198 图像的常规特征 最大标准化摄取值 9.66±4.13 18.83±7.77 −3.095 0.007 平均标准化摄取值 4.83±2.19 6.20±2.98 −1.088 0.294 代谢肿瘤体积 39.71±62.87 49.34±77.73 −0.282 0.782 糖酵解总量 123.41±179.85 216.06±250.27 −0.884 0.390 TNRmax 1.20±0.52 2.37±0.87 −3.402 0.004 TNRmean 0.61±0.27 0.77±0.34 −1.044 0.313 图像的直方图特征 中位标准化摄取值 4.66±2.11 6.03±2.98 −1.098 0.289 Percentile 5th 3.00±1.73 2.57±1.10 0.599 0.558 Percentile 95th 7.20±3.12 10.41±5.29 −1.548 0.142 Skewness 0.52±0.32 0.50±0.63 0.081 0.937 Kurtosis 0.25±1.27 0.49±2.91 −0.224 0.826 图像的纹理特征 DiffEntropy 0.93±0.37 0.96±0.50 −0.161 0.874 DiffVariance 0.27±0.16 0.42±0.46 −0.879 0.404 Contrast 0.84±0.51 1.58±2.12 −0.956 0.368 Entropy 1.76±0.72 1.81±0.73 −0.159 0.876 注:表中,FDG:氟脱氧葡萄糖;PET/CT:正电子发射断层显像计算机体层摄影术;MGMT:O6-甲基鸟嘌呤-DNA甲基转移酶;TNRmax:最大肿瘤与正常组织摄取率;TNRmean:平均肿瘤与正常组织摄取率; Percentile 5t、Percentile 95th、Skewness、Kurtosis为图像的直方图特征参数;DiffEntropy、DiffVariance、Contrast、Entropy为图像的纹理特征参数 表 1 17例胶质瘤患者的临床特征及18F-FDG PET/CT图像特征(
$\bar x $ Table 1. Clinical and 18F-FDG PET/CT imaging characteristics of 17 glioma patients (
$\bar x $ 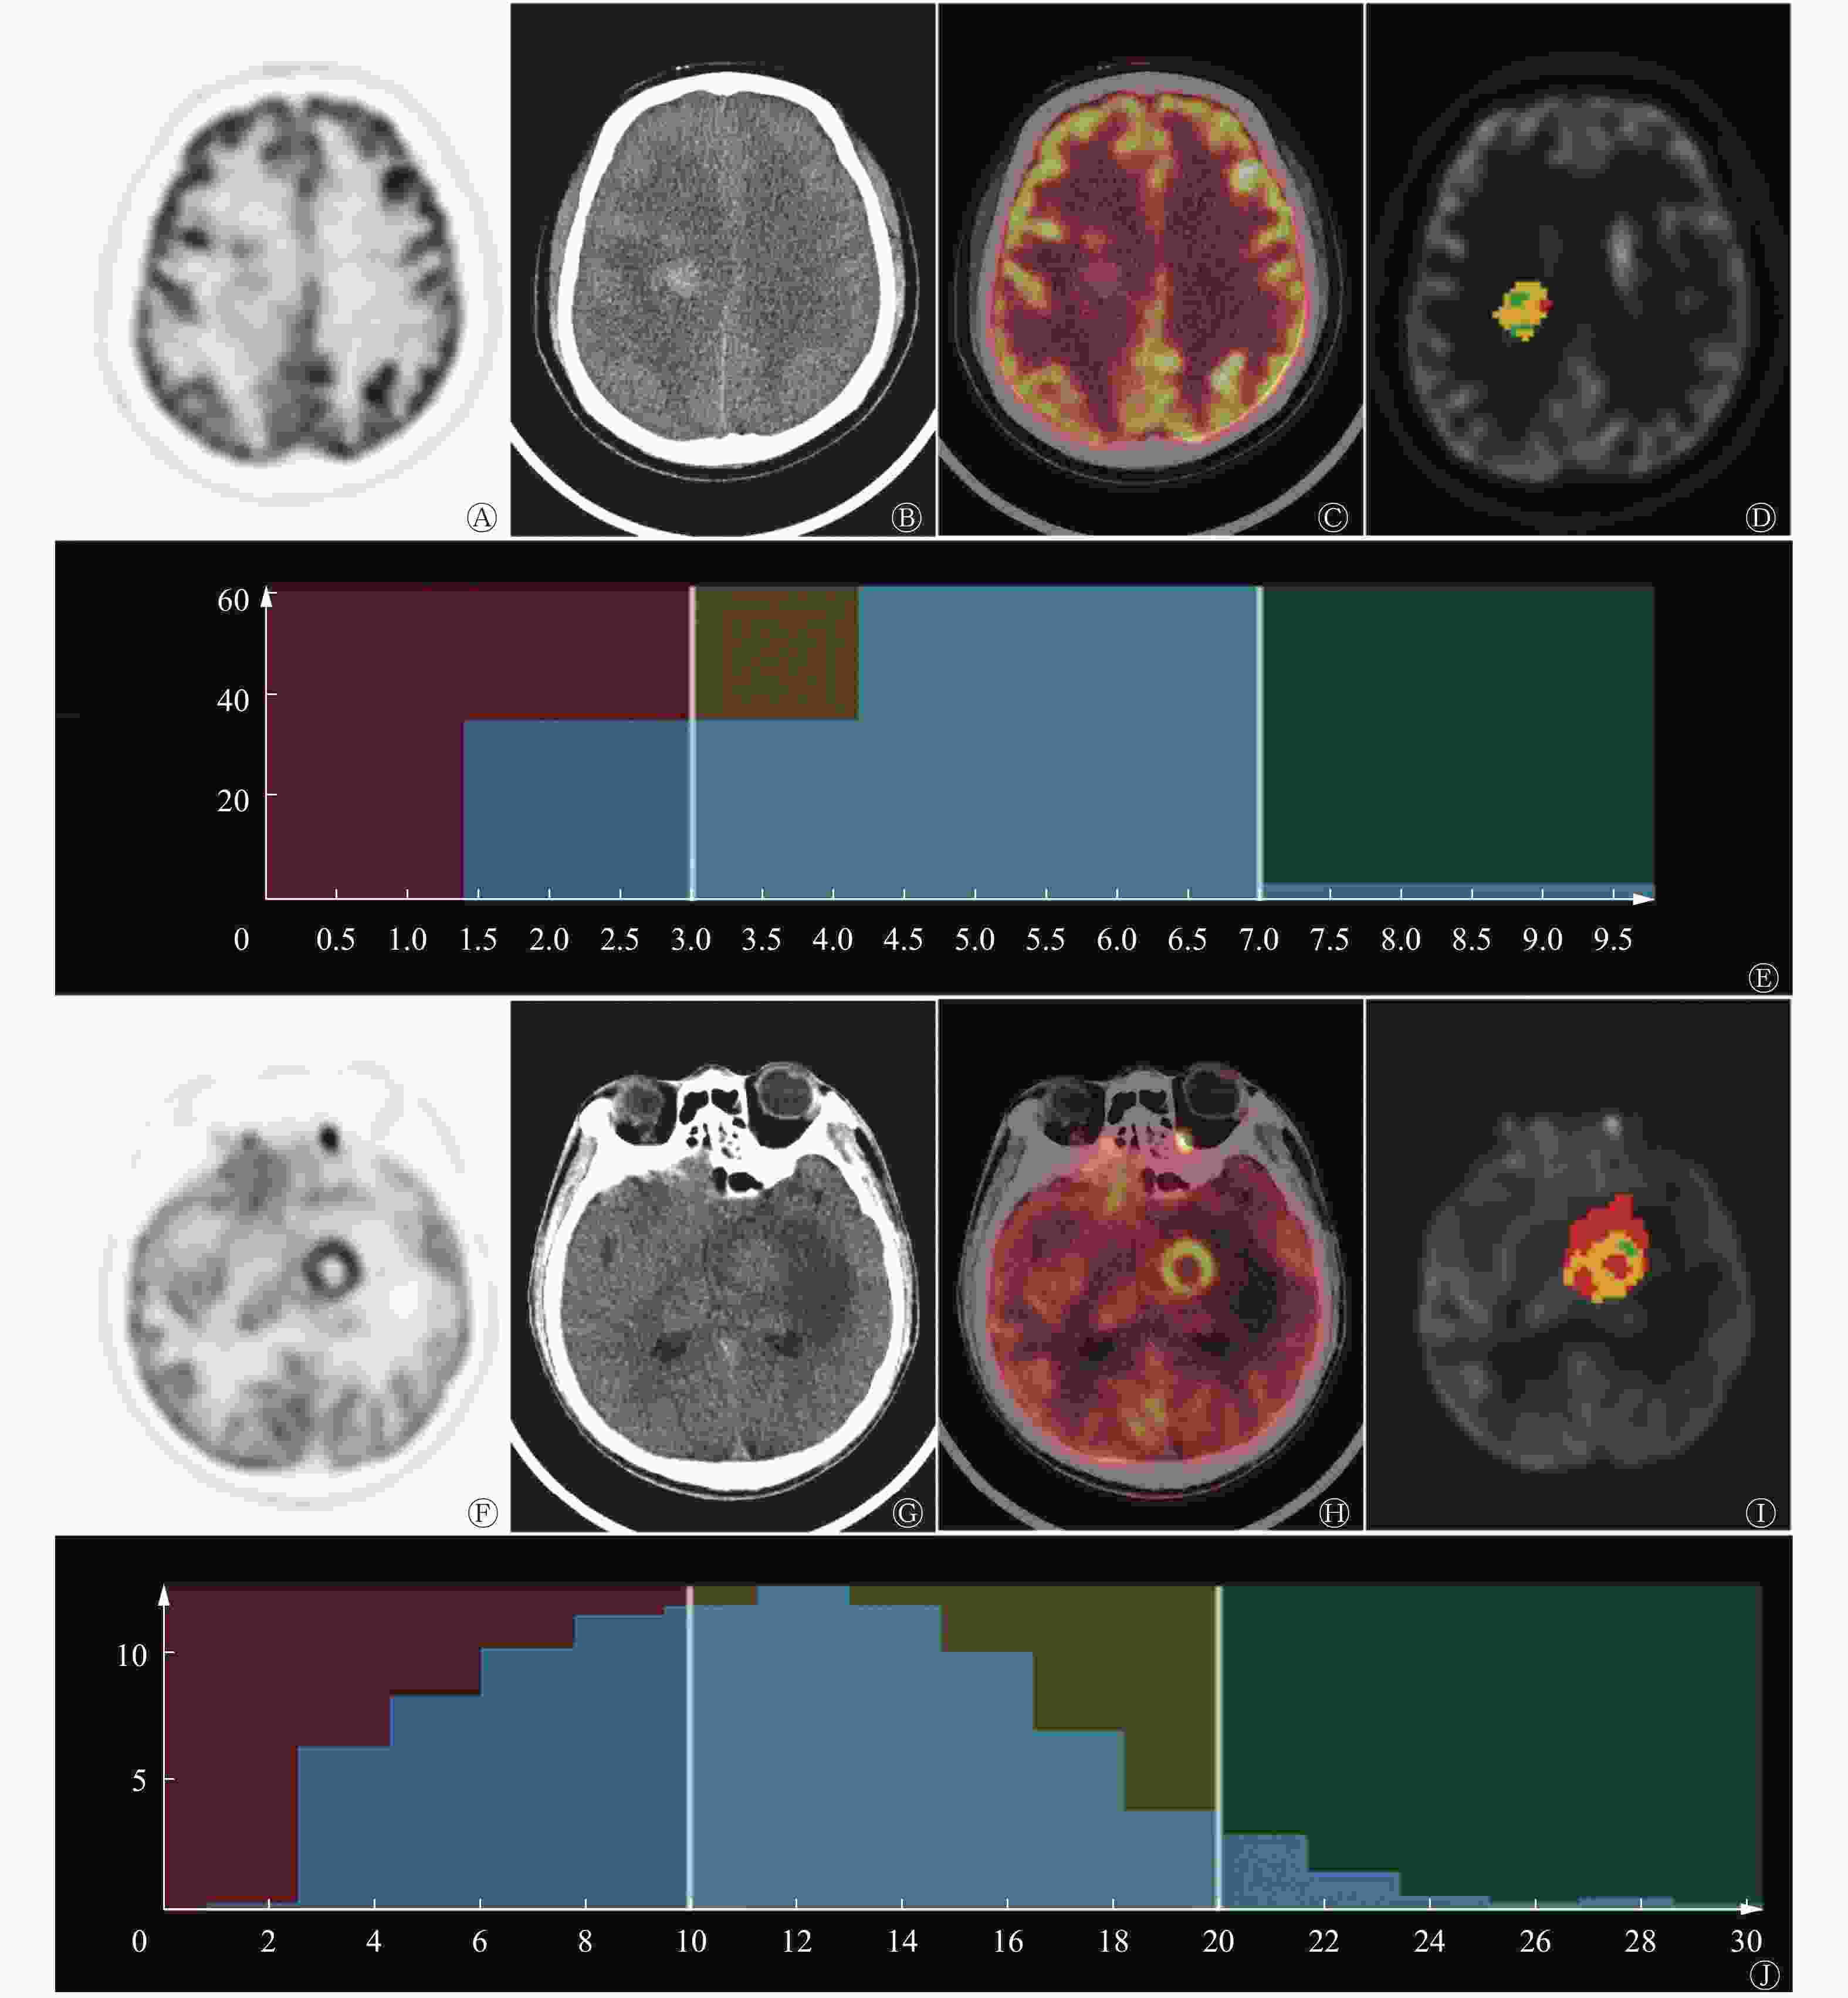
图 1 不同MGMT基因甲基化状态的胶质瘤患者(病例1,图A~E,男性MGMT基因未甲基化患者,41岁;病例2,图F~J,男性MGMT基因甲基化患者,24岁)的18F-FDG PET/CT图及纹理分析图
Figure 1. 18F-FDG PET/CT and representative images of MGMT unmethylated glioma (case 1, male, aged 41, glioblastoma: A–E) and MGMT methylated glioma (case 2, male, aged 24, glioblastoma: F–J)
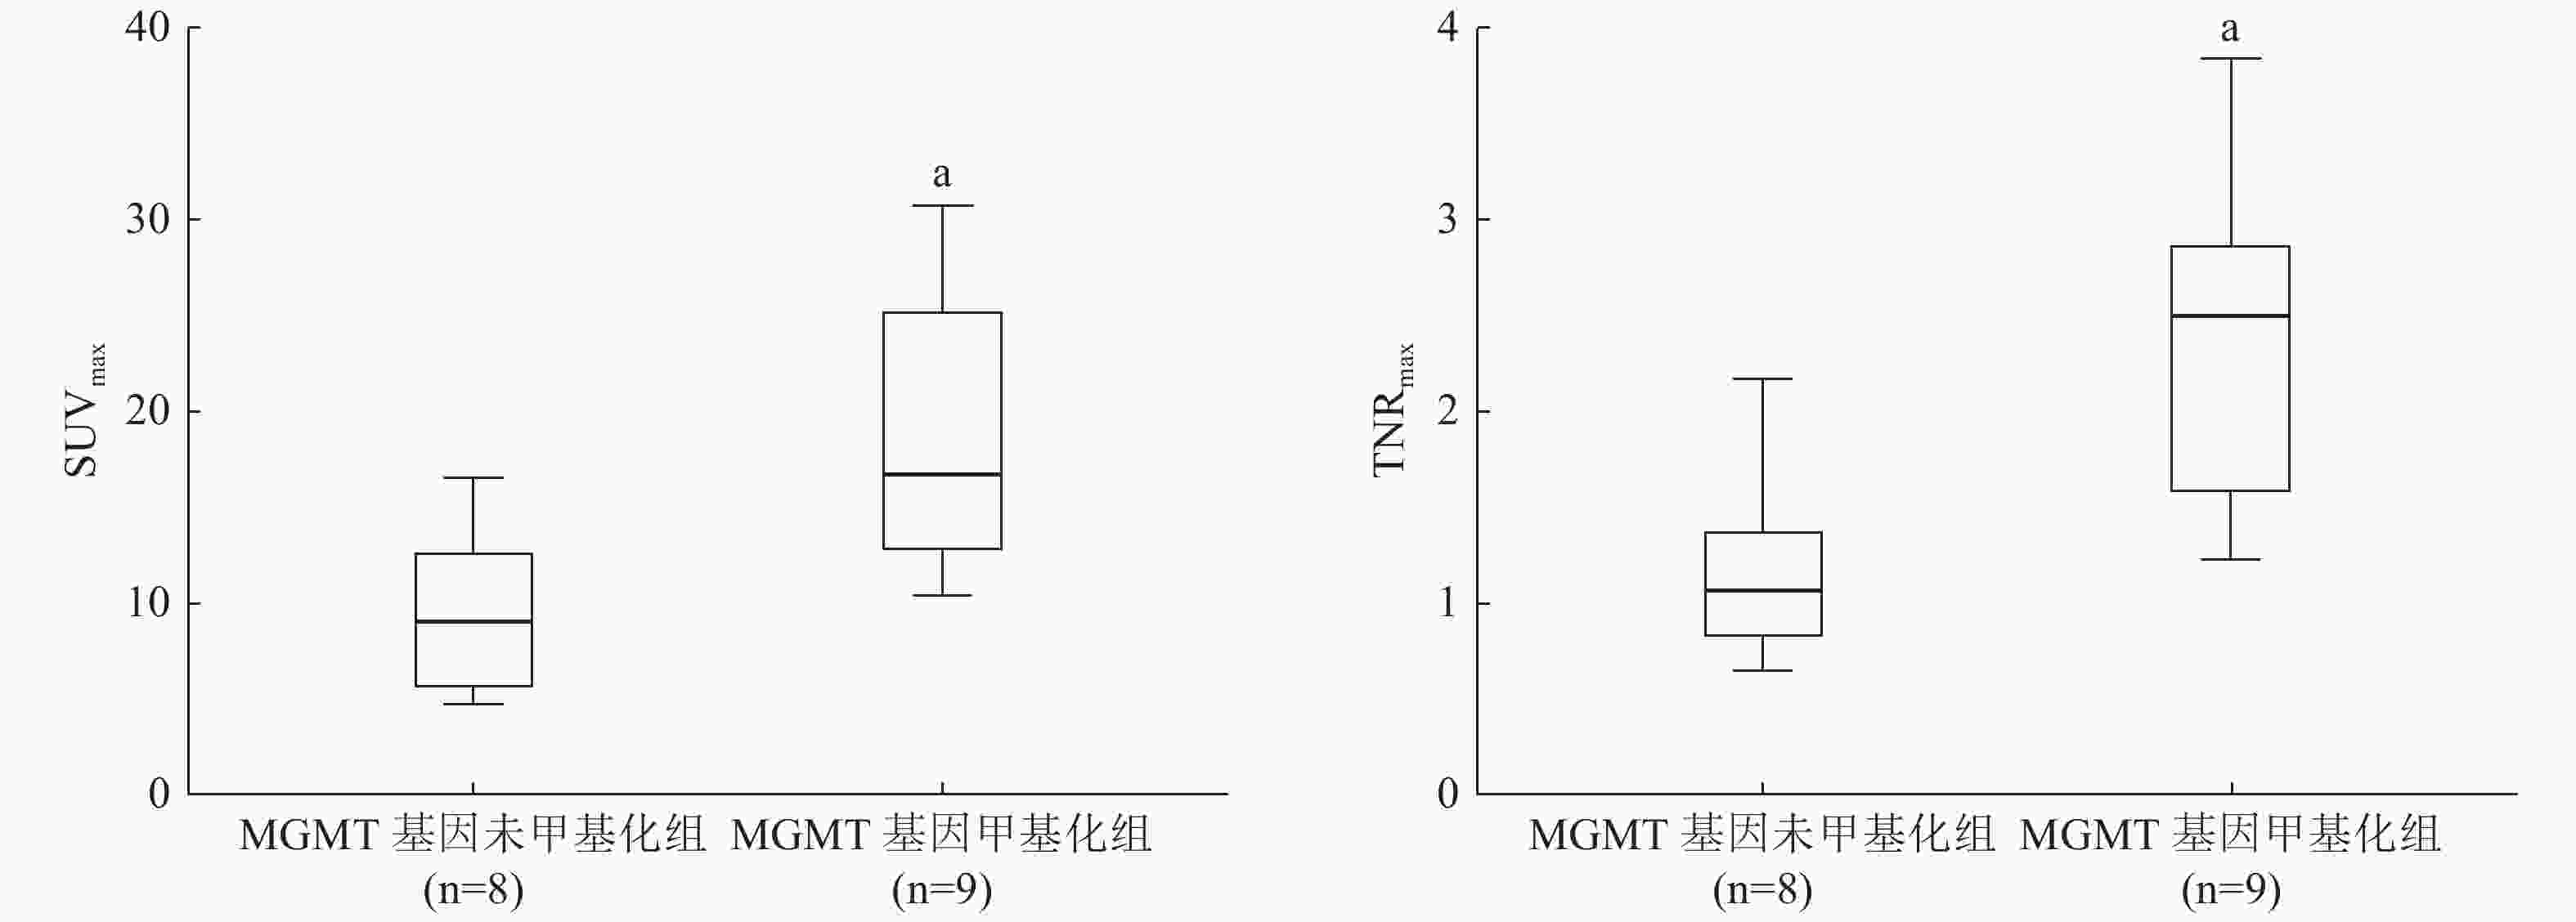
图 2 MGMT基因甲基化组和未甲基化组胶质瘤患者18F-FDG PET图像的SUVmax和TNRmax比较
Figure 2. Comparison of SUVmax and TNRmax in 18F-FDG PET images of patients with glioma in MGMT methylation group and unmethylation group
-
在本研究中,我们通过对18F-FDG PET/CT图像的纹理研究分析了MGMT基因甲基化状态与胶质瘤代谢特征之间的关系,同时发现18F-FDG摄取与MGMT基因甲基化状态存在显著相关性,其中SUVmax和TNRmax可用于区分MGMT基因甲基化组和未甲基化组。通过手动勾画VOI及对侧正常顶叶的圆形ROI计算TNR的方法客观性较差,且仅仅靠半定量指标评定18F-FDG代谢与MGMT基因甲基化状态有关,说服力较低。因此,本研究采用了基于放射组学的分析方法,探讨更多与MGMT基因甲基化状态相关的直方图特征及纹理特征,以求定量精准化,同时探索这些图像特征可否为解释复杂的胶质瘤生物学行为明晰方向。
与能体现代谢特征的常规半定量指标TNR等相比,基于放射组学的纹理特征分析因能在短时间内获取、分析大量信息,在肿瘤学,特别是神经肿瘤学研究领域中的优势日益突出[13]。基于此,几项研究利用PET显像,综合了肿瘤的代谢学和形态学特征来评估WHO Ⅱ级胶质瘤患者的异柠檬酸脱氢酶基因突变状态[14-15]。此外,O-(2-[18F]氟乙基)-L的酪氨酸PET图像的纹理分析也已应用于临床胶质瘤分级、高级别胶质瘤的假性进展鉴定以及放疗导致的脑转移复发改变等多个方面[16]。
有研究结果显示,肿瘤中高18F-FDG摄取与MGMT基因甲基化有关,且高18F-FDG摄取的胶质瘤患者预后不良[11],而MGMT基因甲基化与良好预后呈正相关[17]。这种悖论一种可能的解释是18F-FDG摄取与患者对化疗药物的耐药程度呈负相关,类似之前研究报道的肺癌、胃肠道间质瘤等[18]。相关研究结果显示,18F-FDG是肿瘤耐药表型的底物,所以其摄取与P-糖蛋白表达的耐药表型相关[19],再者,与患者对TMZ治疗反应相关的MGMT基因甲基化状态在组织病理学上伴有多耐药亚型[20],因此,那些抗药性亚型可能影响到不同MGMT基因甲基化状态的患者对分子探针摄取的模式。另一方面,与甲基化类型相比,MGMT基因未甲基化类型往往具有更广泛的坏死区[12],这也可能是未甲基化组中18F-FDG摄取较低的原因。由于肿瘤代谢是一种复杂的生物学行为,这些涉及耐药性的表型可能与MGMT基因甲基化状态的不同导致不同的18F-FDG摄取有关。因此,为了找出独立的预后成像参数和分子标志物,前瞻性队列研究的多变量分析势在必行。
我们通过18F-FDG PET/CT图像的纹理分析对MGMT基因甲基化状态和胶质瘤的生物学行为、显像特征之间的关系进行了深度研究。研究结果表明,18F-FDG摄取在MGMT基因甲基化组和未甲基化组之间存在显著差异,而18F-FDG PET/CT图像的SUVmax和TNRmax可能成为评估MGMT基因甲基化状态的关键指标。但本研究有两点局限性。首先,受制于18F-FDG PET/CT图像脑部本底较高,本研究的样本量较小,不足以降低分析过程中产生的选择偏倚。鉴于治疗方法的个体化差异和样本数量有限,我们没有采用ROC曲线来分析鉴别效能或评估患者的生存率。本课题组下一步将采用对照良好的前瞻性设计,尽可能纳入个体差异较小的患者来做进一步研究。其次,由于PET图像的空间分辨率低,本研究仅基于强度-体积直方图分析了一些一阶纹理特征。因此,未来需要更大的队列研究来进一步有效地分析基于其他探针的多模态影像(如11C-MET PET/MR等)的纹理特征与MGMT基因甲基化的相关性。
利益冲突 本研究由署名作者按以下贡献声明独立开展,不涉及任何利益冲突。
作者贡献声明 宁静负责数据的收集和分析、论文的撰写;于鹏负责协助数据的分析;刘家金负责患者检查的技术操作;党浩丹负责部分数据的收集和分析;徐白萱负责指导论文的撰写。
18F-FDG PET/CT图像的影像组学分析在胶质瘤MGMT基因甲基化状态评估中的初步应用
Radiomic analysis of 18F-FDG PET/CT images in the evaluation of the MGMT methylation status in gliomas
-
摘要:
目的 探讨18F-氟脱氧葡萄糖(FDG) PET/CT图像的影像组学分析综合评估O6-甲基鸟嘌呤-DNA甲基转移酶(MGMT)基因甲基化状态,预测胶质瘤患者对替莫唑胺(TMZ)治疗的反应。 方法 回顾性分析2016年1月至2018年9月在中国人民解放军总医院第一医学中心经组织病理学结果证实的17例胶质瘤患者,其中男性13例、女性4例,患者均于术前进行了18F-FDG PET/CT检查,手动勾画肿瘤的感兴趣体积(VOI)并进行纹理分析。通过焦磷酸测序法检测、分析MGMT基因甲基化状态。根据MGMT基因甲基化状态分将患者为甲基化组和未甲基化组,采用两独立样本t检验分析两组数据之间各个影像组学参数的差异。 结果 17例胶质瘤患者中,9例(52.9%)MGMT基因未甲基化、8例(47.1%)MGMT基因甲基化。甲基化组与未甲基化组比较,患者的年龄和肿瘤分级的差异无统计学意义(t=−0.251、−0.016,P=0.806、0.198);而性别之间的差异有统计学意义(t=−1.426,P=0.031)。MGMT基因甲基化组的最大标准化摄取值(SUVmax)、最大肿瘤与正常组织摄取率(TNRmax)显著高于MGMT基因未甲基化组(SUVmax:18.83±7.77 对 9.66±4.13,t=−3.095,P=0.007;TNRmax:2.37±0.87对1.20±0.52,t=−3.402,P=0.004)。 结论 18F-FDG PET/CT图像的SUVmax和TNRmax可能是评估胶质瘤MGMT基因甲基化状态的关键指标,或许可用于预测TMZ化疗患者的临床反应。 -
关键词:
- 正电子发射断层显像术 /
- 体层摄影术,X线计算机 /
- 胶质瘤 /
- MGMT基因甲基化状态 /
- 影像组学分析
Abstract:Objective To explore the relationship between comprehensive information of gliomas and O6-methylguanylmethyltransferase (MGMT) promoter methylation status non-invasively by analyzing radiomic features of multi-modality 18F-fluorodeoxyglucose (FDG) PET/CT images. The response to temozolomide (TMZ) was determined through the abovementioned method for the clinical management of glioma patients. Methods A retrospective study of 17 patients (13 males and 4 females) with glioma confirmed by histopathological results in the First Medical Center of General Hospital of Chinese PLA from January 2016 to September 2018 was conducted. Preoperative 18F-FDG PET/CT scanning was performed. Radiomic texture analysis was performed after manually delineating the volume of interest. MGMT promoter methylation was examined by pyrosequencing analysis. MGMT data were categorized according to the methylation status, i.e., methylated and unmethylated groups. Two independent sample t-tests were used to analyze the differences in imaging omics parameters between the two groups of data. Results Among the 17 patients with glioma, 9 (52.9%) had MGMT unmethylation and 8 (47.1%) had MGMT methylation. Between the methylated group and the unmethylated group, there was no significant difference in patient age or tumor grade (t=−0.251, −0.016, P=0.806, 0.198); The difference between genders was statistically significant Meaning (t=−1.426, P=0.031). Both the SUVmax and TNRmax values of the MGMT methylated group were significantly higher than those of the MGMT unmethylated group (SUVmax: 18.83±7.77 vs. 9.66±4.13; t=−3.095, P=0.007; TNRmax: 2.37±0.87 vs. 1.20±0.52; t=−3.402, P=0.004). Conclusion The features (SUVmax and TNRmax) of 18F-FDG PET/CT images are two key indicators in the detection of MGMT methylation status in gliomas and are valuable predictors of the clinical responses of patients scheduled to receive TMZ chemotherapeutics. -
图 1 不同MGMT基因甲基化状态的胶质瘤患者(病例1,图A~E,男性MGMT基因未甲基化患者,41岁;病例2,图F~J,男性MGMT基因甲基化患者,24岁)的18F-FDG PET/CT图及纹理分析图
Figure 1. 18F-FDG PET/CT and representative images of MGMT unmethylated glioma (case 1, male, aged 41, glioblastoma: A–E) and MGMT methylated glioma (case 2, male, aged 24, glioblastoma: F–J)
图 2 MGMT基因甲基化组和未甲基化组胶质瘤患者18F-FDG PET图像的SUVmax和TNRmax比较
Figure 2. Comparison of SUVmax and TNRmax in 18F-FDG PET images of patients with glioma in MGMT methylation group and unmethylation group
表 1 17例胶质瘤患者的临床特征及18F-FDG PET/CT图像特征(
$\bar x $ Table 1. Clinical and 18F-FDG PET/CT imaging characteristics of 17 glioma patients (
$\bar x $ MGMT基因未甲基化组(n=8) MGMT基因甲基化组(n=9) t值 P值 临床指标 年龄(岁) 45.7±19.6 47.9±16.3 −0.251 0.806 性别(男∶女,例) 8∶0 5∶4 −1.426 0.031 肿瘤级别(Ⅰ∶Ⅱ∶Ⅲ∶Ⅳ,例) 2∶0∶0∶6 0∶0∶1∶8 −0.016 0.198 图像的常规特征 最大标准化摄取值 9.66±4.13 18.83±7.77 −3.095 0.007 平均标准化摄取值 4.83±2.19 6.20±2.98 −1.088 0.294 代谢肿瘤体积 39.71±62.87 49.34±77.73 −0.282 0.782 糖酵解总量 123.41±179.85 216.06±250.27 −0.884 0.390 TNRmax 1.20±0.52 2.37±0.87 −3.402 0.004 TNRmean 0.61±0.27 0.77±0.34 −1.044 0.313 图像的直方图特征 中位标准化摄取值 4.66±2.11 6.03±2.98 −1.098 0.289 Percentile 5th 3.00±1.73 2.57±1.10 0.599 0.558 Percentile 95th 7.20±3.12 10.41±5.29 −1.548 0.142 Skewness 0.52±0.32 0.50±0.63 0.081 0.937 Kurtosis 0.25±1.27 0.49±2.91 −0.224 0.826 图像的纹理特征 DiffEntropy 0.93±0.37 0.96±0.50 −0.161 0.874 DiffVariance 0.27±0.16 0.42±0.46 −0.879 0.404 Contrast 0.84±0.51 1.58±2.12 −0.956 0.368 Entropy 1.76±0.72 1.81±0.73 −0.159 0.876 注:表中,FDG:氟脱氧葡萄糖;PET/CT:正电子发射断层显像计算机体层摄影术;MGMT:O6-甲基鸟嘌呤-DNA甲基转移酶;TNRmax:最大肿瘤与正常组织摄取率;TNRmean:平均肿瘤与正常组织摄取率; Percentile 5t、Percentile 95th、Skewness、Kurtosis为图像的直方图特征参数;DiffEntropy、DiffVariance、Contrast、Entropy为图像的纹理特征参数  下载: 导出CSV
-
[1] Weller M, Tabatabai G, Kastner B, et al. MGMT promoter methylation is a strong prognostic biomarker for benefit from dose-intensified temozolomide rechallenge in progressive glioblastoma: the DIRECTOR trial[J]. Clin Cancer Res, 2015, 21(9): 2057−2064. DOI: 10.1158/1078-0432.CCR-14-2737. [2] Weller M, Stupp R, Hegi ME, et al. Personalized care in neuro-oncology coming of age: why we need MGMT and 1p/19q testing for malignant glioma patients in clinical practice[J]. Neuro Oncol, 2012, 14(Suppl 4): iv100−iv108. DOI: 10.1093/neuonc/nos206. [3] Kim S, Chung JK, Im SH, et al. 11C-methionine PET as a prognostic marker in patients with glioma: comparison with 18F-FDG PET[J]. Eur J Nucl Med Mol Imaging, 2005, 32(1): 52−59. DOI: 10.1007/s00259-004-1598-6. [4] Okita Y, Kinoshita M, Goto T, et al. 11C-methionine uptake correlates with tumor cell density rather than with microvessel density in glioma: a stereotactic image-histology comparison[J]. Neuroimage, 2010, 49(4): 2977−2982. DOI: 10.1016/j.neuroimage.2009.11.024. [5] Choi H, Bang J-I, Cheon GJ, et al. 18F-Fluorodeoxyglucose and 11C-methionine positron emission tomography in relation to methyl-guanine methyltransferase promoter methylation in high-grade gliomas[J]. Nucl Med Commun, 2015, 36(3): 211−218. DOI: 10.1097/MNM.0000000000000236. [6] Zhou M, Hall L, Goldgof D, et al. Radiologically defined ecological dynamics and clinical outcomes in glioblastoma multiforne: preliminary results[J]. Transl Oncol, 2014, 7(1): 5−13. DOI: 10.1593/tlo.13730. [7] Zhou Y, He L, Huang YQ, et al. CT-based radiomics signature: a potential biomarker for preoperative prediction of early recurrence in hepatocellular carcinoma[J]. Abdom Radiol (NY), 2017, 42(6): 1695−1704. DOI: 10.1007/s00261-017-1072-0. [8] Zhang Q, Xiao Y, Suo JF, et al. Sonoelastomics for breast tumor classification: a radiomics approach with clustering-based feature selection on sonoelastography[J]. Ultrasound Med Biol, 2017, 43(5): 1058−1069. DOI: 10.1016/j.ultrasmedbio.2016.12.016. [9] Padma MV, Said S, Jacobs M, et al. Prediction of pathology and survival by FDG PET in gliomas[J]. J Neurooncol, 2003, 64(3): 227−237. DOI: 10.1023/a:1025665820001. [10] Summers RM. Texture analysis in radiology: Does the emperor have no clothes?[J]. Abdom Radiol (NY), 2017, 42(2): 342−345. DOI: 10.1007/s00261-016-0950-1. [11] Xie H, Tubbs R, Yang B. Detection of MGMT promoter methylation in glioblastoma using pyrosequencing[J]. Int J Clin Exp Pathol, 2015, 8(2): 1790−1796. [12] Eoli M, Menghi F, Bruzzone MG, et al. Methylation of O6-methylguanine DNA methyltransferase and loss of heterozygosity on 19q and/or 17p are overlapping features of secondary glioblastomas with prolonged survival[J]. Clin Cancer Res, 2007, 13(9): 2606−2613. DOI: 10.1158/1078-0432.CCR-06-2184. [13] Aerts HJ, Velazquez ER, Leijenaar RT, et al. Decoding tumour phenotype by noninvasive imaging using a quantitative radiomics approach[J]. Nat Commun, 2014, 5: 4006. DOI: 10.1038/ncomms5006. [14] Eichinger P, Alberts E, Delbridge C, et al. Diffusion tensor image features predict IDH genotype in newly diagnosed WHO grade Ⅱ/Ⅲ gliomas[J]. Sci Rep, 2017, 7(1): 13396. DOI: 10.1038/s41598-017-13679-4. [15] Yu JH, Shi ZF, Lian YX, et al. Noninvasive IDH1 mutation estimation based on a quantitative radiomics approach for grade Ⅱ glioma[J]. Eur Radiol, 2017, 27(8): 3509−3522. DOI: 10.1007/s00330-016-4653-3. [16] Lohmann P, Stoffels G, Ceccon G, et al. Radiation injury vs. recurrent brain metastasis: combining textural feature radiomics analysis and standard parameters may increase 18F-FET PET accuracy without dynamic scans[J]. Eur Radiol, 2017, 27(7): 2916−2927. DOI: 10.1007/s00330-016-4638-2. [17] Colavolpe C, Metellus P, Mancini J, et al. Independent prognostic value of pre-treatment 18-FDG-PET in high-grade gliomas[J]. J Neurooncol, 2012, 107(3): 527−535. DOI: 10.1007/s11060-011-0771-6. [18] Stupp R, Mason WP, van den Bent MJ, et al. Radiotherapy plus concomitant and adjuvant temozolomide for glioblastoma[J]. N Engl J Med, 2005, 352(10): 987−996. DOI: 10.1056/NEJMoa043330. [19] Seo S, Hatano E, Higashi T, et al. Fluorine-18 fluorodeoxyglucose positron emission tomography predicts lymph node metastasis, P-glycoprotein expression, and recurrence after resection in mass-forming intrahepatic cholangiocarcinoma[J]. Surgery, 2008, 143(6): 769−777. DOI: 10.1016/j.surg.2008.01.010. [20] Yu CJ, Wan WX, Zhang B, et al. Evaluation of the relationship between [18F] FDG and P-glycoprotein expression: an experimental study[J]. Nucl Med Biol, 2012, 39(5): 671−678. DOI: 10.1016/j.nucmedbio.2011.12.007. -

 点击查看大图

计量
- 文章访问数: 3387
- HTML全文浏览量: 2137
- PDF下载量: 16