


-
核素肺通气/灌注(ventilation/perfusion,V/Q)显像是较早应用于慢性血栓栓塞性肺动脉高压(chronic thromboembolic pulmonary hypertension,CTEPH)的无创影像学技术,其主要根据血栓栓塞导致的肺血流灌注受损,肺V/Q不匹配进行诊断。但这种V/Q肺段性不匹配并不能反映肺动脉高压引起的V/Q分布紊乱情况,从而低估了CTEPH患者肺血管受损的程度和范围。目前临床尚缺乏有效的定量评价方法来全面评估肺V/Q分布的紊乱程度。已有研究结果证实,核素肺V/Q分布异质性可评估肺栓塞[1]和慢性阻塞性肺疾病[2]等疾病的肺V/Q分布失衡,从而提高了诊断的准确率。同时,基于SPECT软件计算的全肺的SUV也可定量评估肺血流灌注分布的异质性,与PET相比,更加经济、便捷,具有较高的稳定性和可重复性。本研究通过定量比较CTEPH组和健康对照组肺V/Q分布的异质性,探讨肺V/Q分布异质性指标与肺动脉压力之间的相关性,从而验证肺V/Q分布异质性的定量分析方法应用于CTEPH的可行性。
-
根据2015年欧洲心脏病学会肺动脉高压诊断和治疗指南中的标准[3],收集中国医学科学院北京协和医学院阜外医院2018年2月至12月经右心导管及肺动脉造影确诊的CTEPH患者20例,其中男性12例、女性8例,年龄(48.75±14.07)岁,排除其他类型的肺动脉高压、急性肺栓塞和肺实质性病变等患者,同时入组以排除为目的行肺V/Q显像的患者。将肺V/Q显像诊断为正常的13名健康者作为对照组,其中男性7名、女性6名,年龄(54.46±8.56)岁。所有CTEPH患者同时接受超声心动图检查,估测肺动脉收缩压(pulmonary arterial systolic pressure,PASP),该检查与肺V/Q显像的时间间隔在一周内。本研究经中国医学科学院阜外医院伦理委员会批准(NO.402),受试者均符合核素肺V/Q显像安全标准且均签署了知情同意书。
-
图像采集均采用德国SIEMENS公司的 Symbia T16 SPECT/CT仪,配低能高分辨率准直器。能峰:140 keV,窗宽20%。通气设备采用一次性肺通气导入器:99Tcm-锝气通气装置(澳大利亚VITA医疗有限公司)。肺V/Q显像采用两日法。
-
嘱患者吸氧,氧气流量为2~4 L/min,吸入时间为 5~10 min。患者仰卧于检查床上,双臂抱头,使探头尽量贴近胸部。静脉注射74~185 MBq 99Tcm标记的大颗粒聚合人血清白蛋白(购自中国原子能科学研究院原子高科股份有限公司),行肺灌注断层显像。在注射前后分别测量并记录99Tcm-人血清白蛋白的放射性剂量和对应时间。两探头各旋转180°,每个探头采集32个投影,每个投影采集20 s,共采集64个投影,采集矩阵128
$\times $ 128,放大1倍。采集过程中嘱患者平稳呼吸,以减少呼吸运动对肺显像的干扰。 -
灌注SPECT采集之后同一床位进行低剂量CT扫描。采集参数[4]:管电压110 kV、管电流25 mAs、层厚5 mm,于吸气末屏气采集。
-
灌注SPECT显像后第2天行通气采集。将高放射性浓度(>370 MBq/0.1 mL)的99TcmO4−注入锝气发生器的石墨钳锅内,在充满氩气的密闭装置内通电加温,99TcmO4−蒸发形成锝气,嘱患者通过连接管及面罩吸入锝气,吸入时间为1 min。嘱患者仰卧于检查床上,双臂抱头,使探头尽量贴近胸部行肺通气断层显像,采集参数同灌注SPECT显像。
-
将全部采集图像导入HERMES工作站(HERMES Medical Solutions AB,瑞典)。选取灌注SPECT图像、通气SPECT图像及用于衰减校正的CT图像进行重建。重建后的数据根据通气、灌注放射性计数的10%作为阈值设定肺的边界。通气、灌注放射性计数经归一化校正后,可获得每个体素的通气、灌注的放射性计数及二者的比值,并计算三者的标准差(standard deviation,SD)。三者的SD经对数转换后获得V/Q放射性分布异质性的定量指标,分别记为LogSDV、LogSDQ和LogSDVQR。同时,校正后的每个体素的通气、灌注的放射性计数以及V/Q放射性计数比值经对数转换,范围从−3(log100.001)~2(log10100),放射性计数>100的所有体素被赋值为100,<0.001的体素被赋值为0.001,间隔为0.05,绘制V、Q及V/Q比值的分布-肺内占比曲线[1],上述LogSDV、LogSDQ 及LogSDVQR分别表示各曲线分布的宽度,即描述V/Q异质性情况。此外,将重建后的灌注SPECT及诊断CT图像导入仪器自带Hybrid 3D软件,在CT图像上,采用肺CT值作为阈值自动勾画左肺、右肺和全肺边界轮廓获得感兴趣体积(volume of interest,VOI),并将其复制于肺灌注图像上,将每一体素的放射性计数转换为每单位体积放射性活度[5],经体表面积(body surface area,BSA)校正后获得左肺、右肺和全肺的SUV(见下述公式),包括峰值(SUVpeak)、最大值(SUVmax)、最小值(SUVmin)、平均值(SUVmean)和SD(SUVSD),其中,SUVpeak为VOI内每立方厘米体素内SUV平均值的最大值,SUVSD则代表灌注分布的异质性。
$ {\rm{SU}}{{\rm{V}}_{{\rm{BSA}}}} = {\rm{A}} \times \frac{{{\rm{BSA}}}}{{\rm{D}}} \times 10\;000 $ 公式中,A为单位体积的放射性活度(Bq/cm3)、D为注射剂量(Bq)、BSA(m2)=(体重0.425
$\times $'/> 身高0.725)$\times $'/> 0.007 184、10 000的单位为cm2。 -
使用 SPSS 19.0 软件进行统计学分析。符合正态分布的计量资料以均数±标准差表示。在方差齐的条件下,CTEPH组与对照组、左肺与右肺的测量指标组间比较采用两独立样本t检验。CTEPH组患者的肺V/Q分布异质性指标与PASP的相关性采用Pearson相关性分析。P<0.05 为差异有统计学意义。
-
由表1可见,CTEPH组和健康对照组在年龄、性别、身高和体重等方面的比较,差异均无统计学意义(均P>0.05)。
组别 年龄(岁) 女性/男性(例) 身高(cm) 体重(kg) CTEPH组
(n=20)48.75±14.07 8/12 166.45±7.83 65.25±11.00 健康对照组
(n=13)54.46±8.56 6/7 168.46±9.68 71.69±18.01 检验值 t=−1.31 χ2=0.122 t=−0.66 t=−1.28 P值 0.200 >0.99 0.516 0.210 注:表中,CTEPH:慢性血栓栓塞性肺动脉高压;PASP:肺动脉收缩压 表 1 2组临床资料的比较
Table 1. Comparison of clinical data between two groups
-
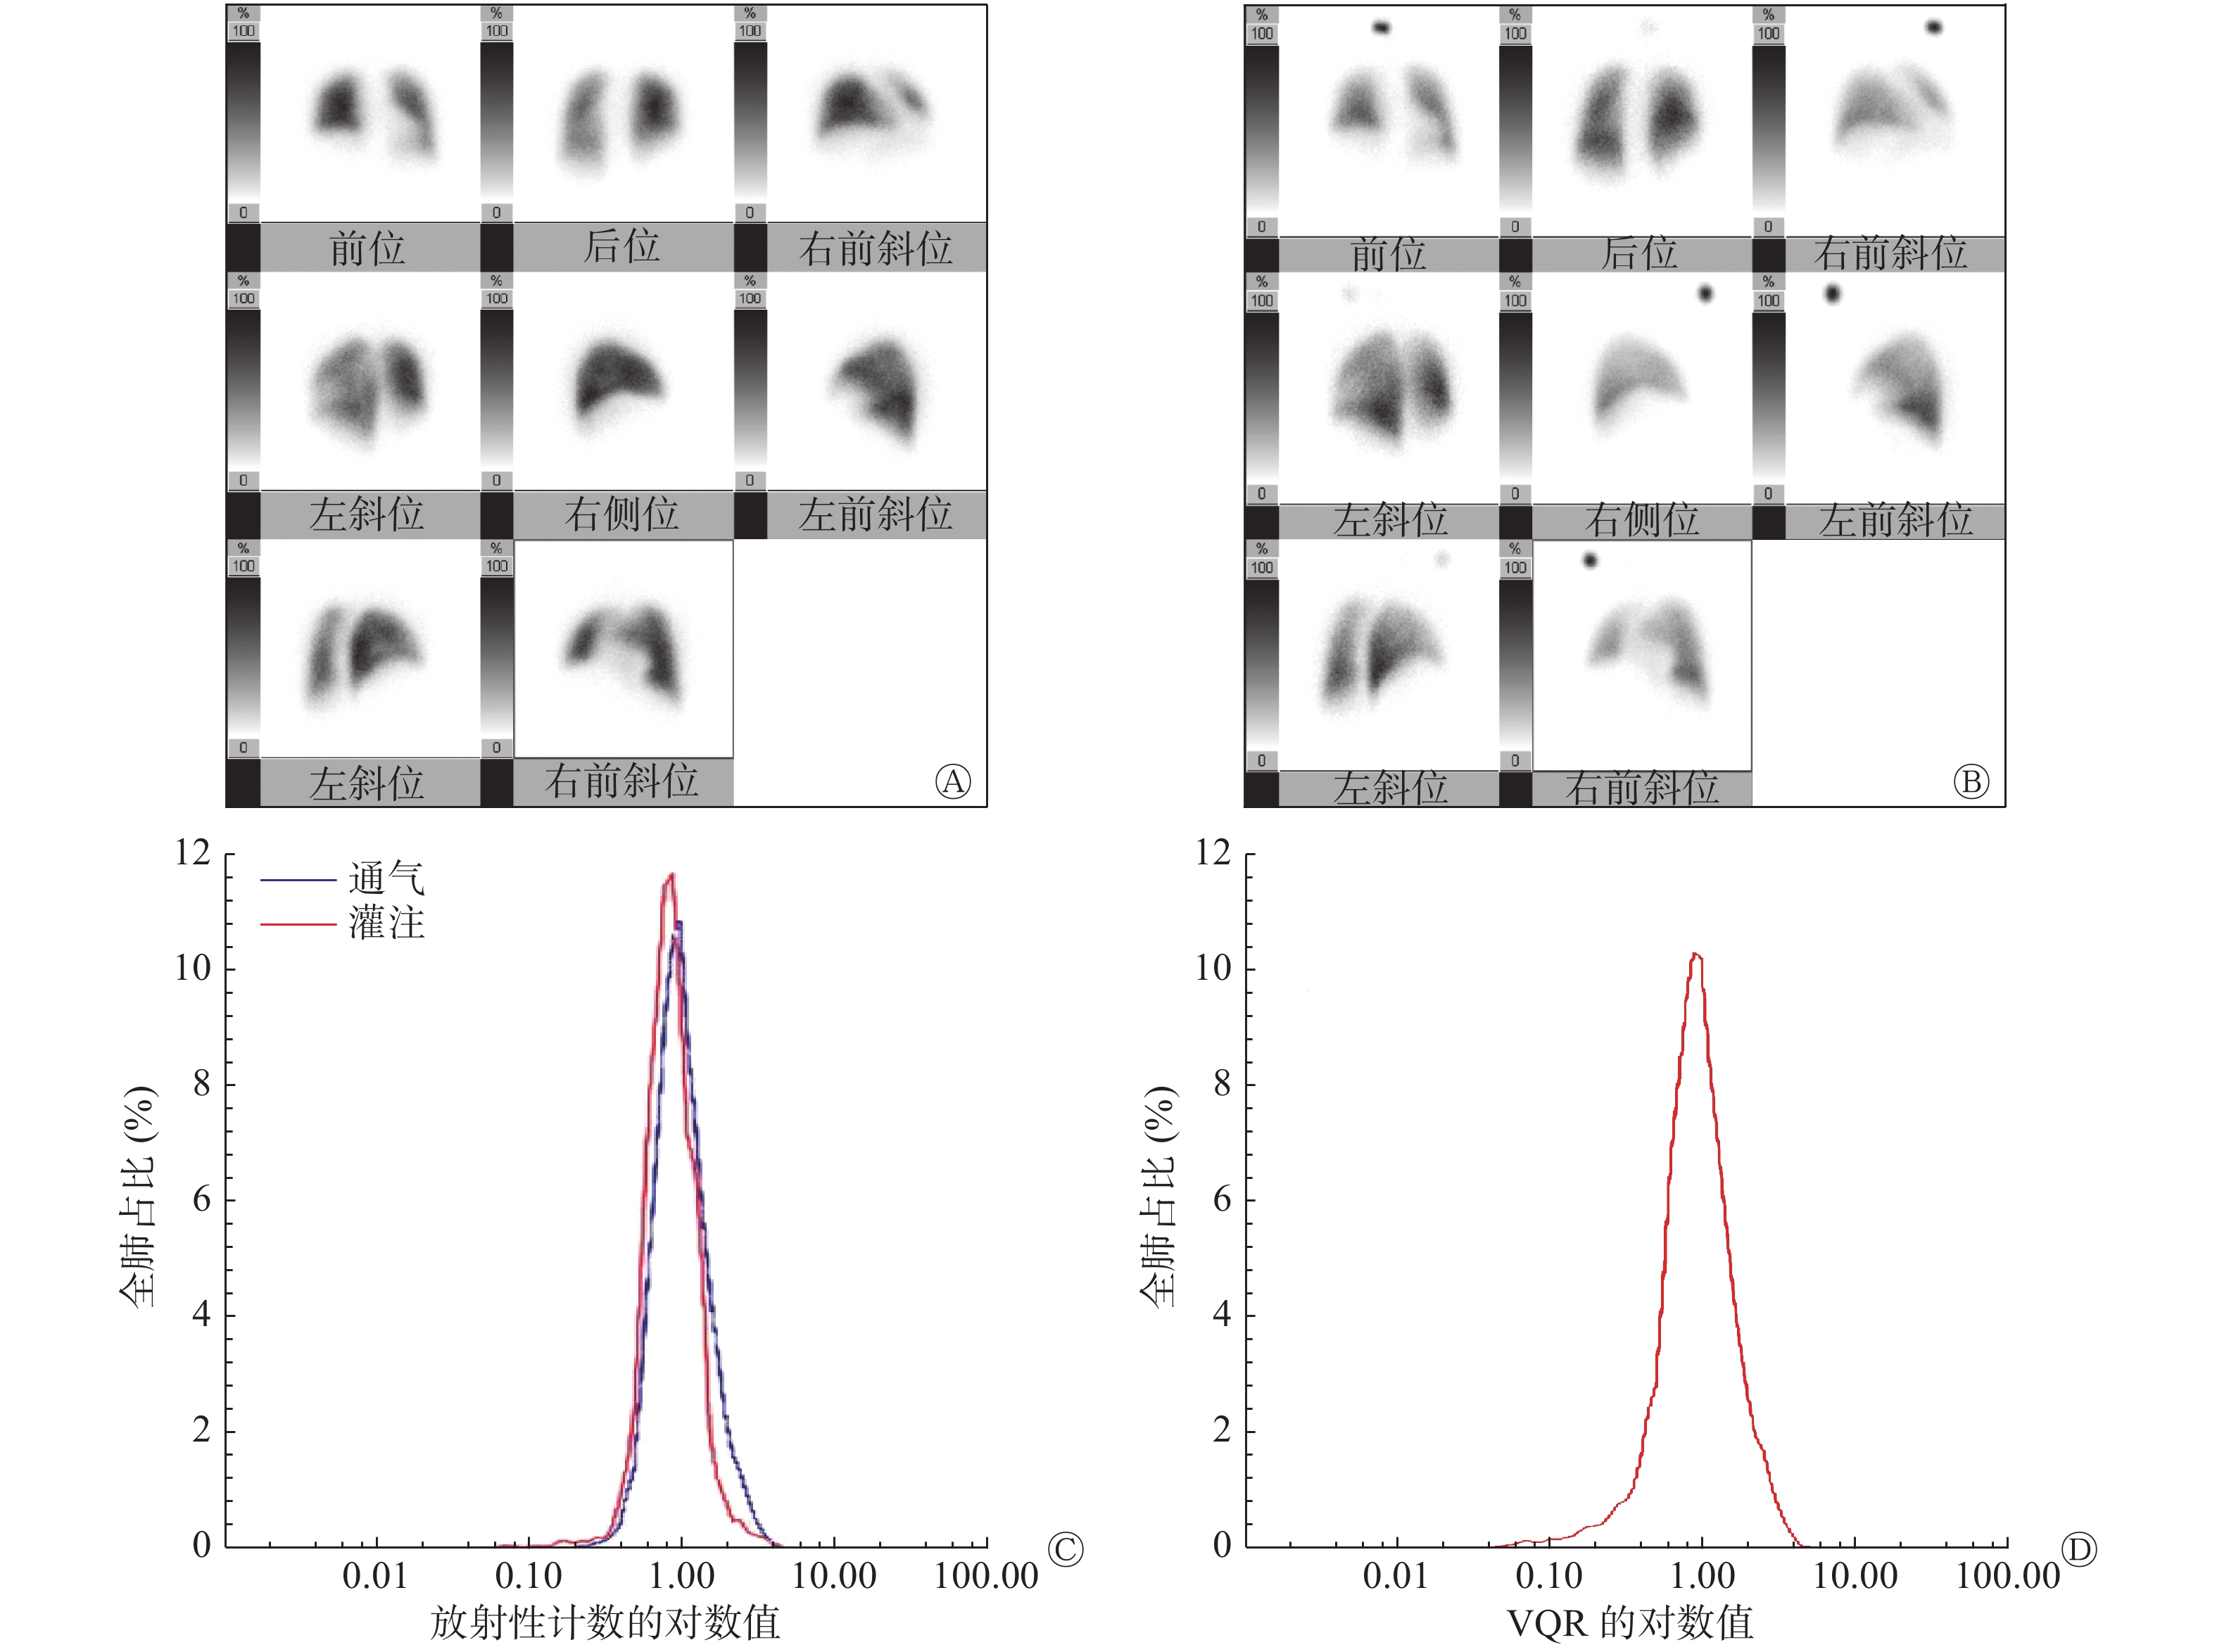
对照组的肺V/Q放射性分布曲线呈对称性单峰状分布(图1中C、D),而CTEPH组患者的肺V/Q放射性分布曲线呈非对称性的多峰分布(图2中C、D),2组图像有明显差别。典型病例的肺V/Q平面显像图分别见图1和2中的C、D。
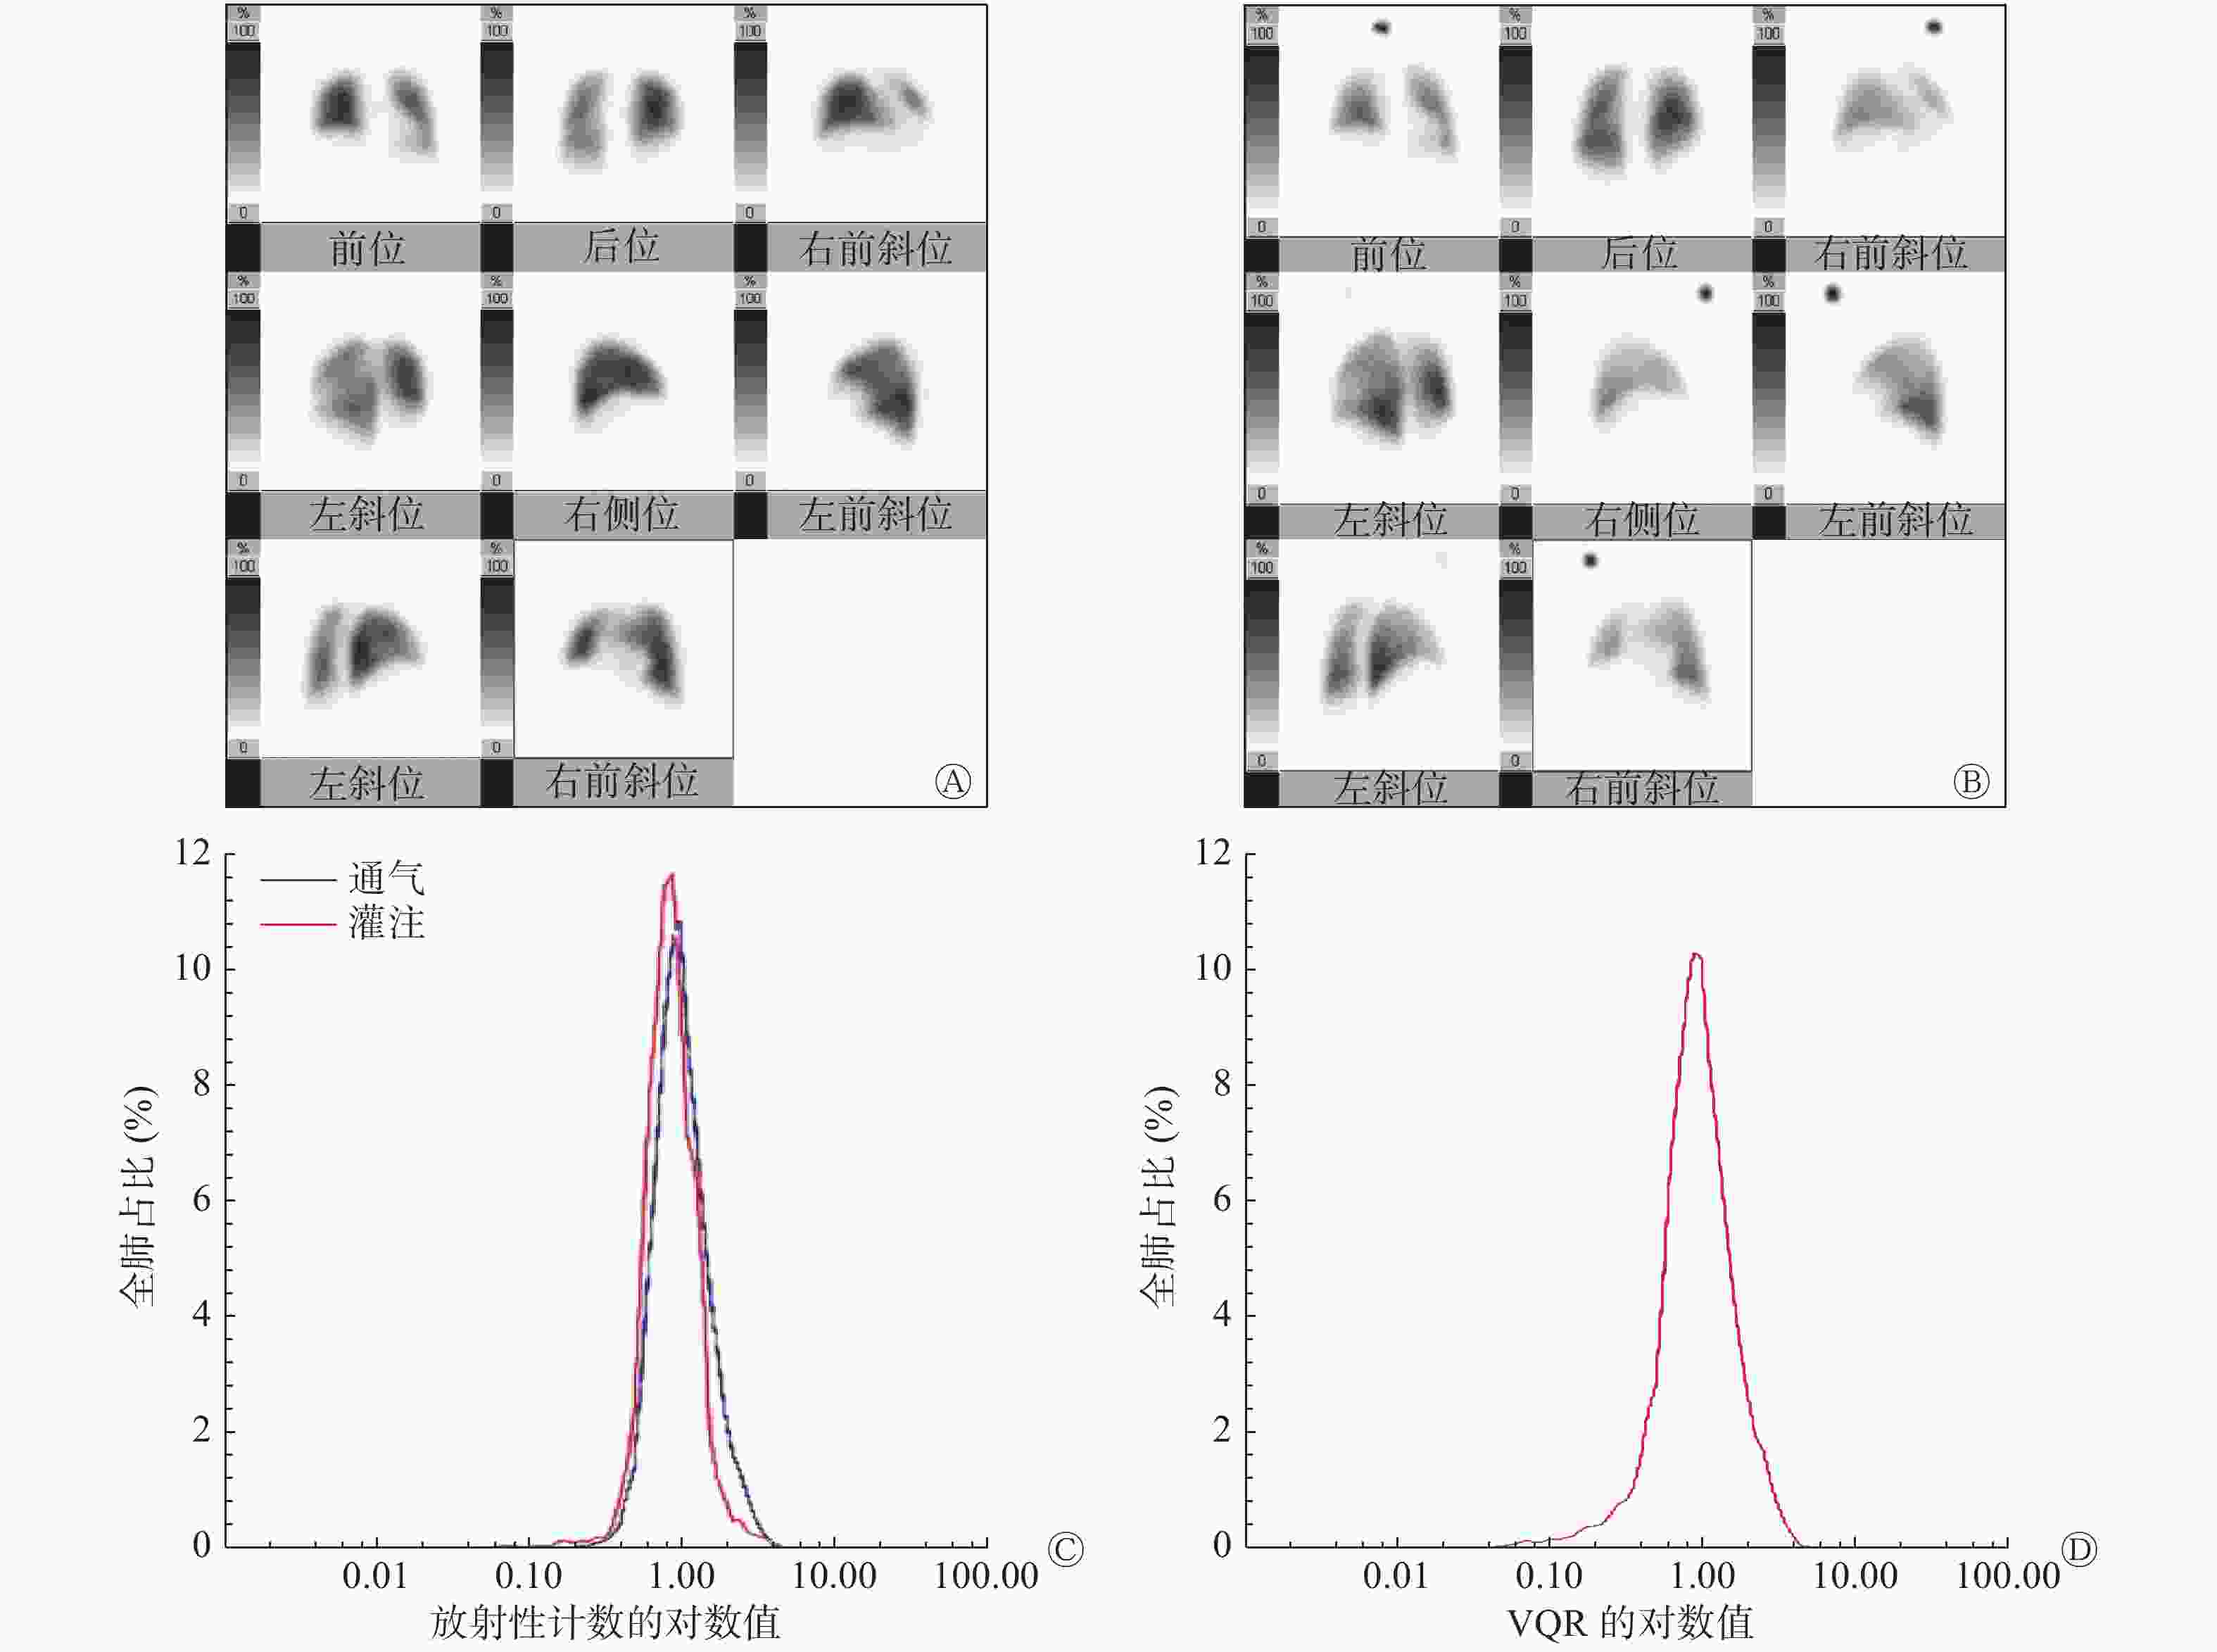
图 1 健康者(女性,63岁)的肺灌注(A)、肺通气(B)平面显像图及放射性分布曲线(C、D)
Figure 1. Lung perfusion scan (A), lung ventilation scan (B) and radioactivity distribution curve (C, D) in healthy people (female, 63 years old)
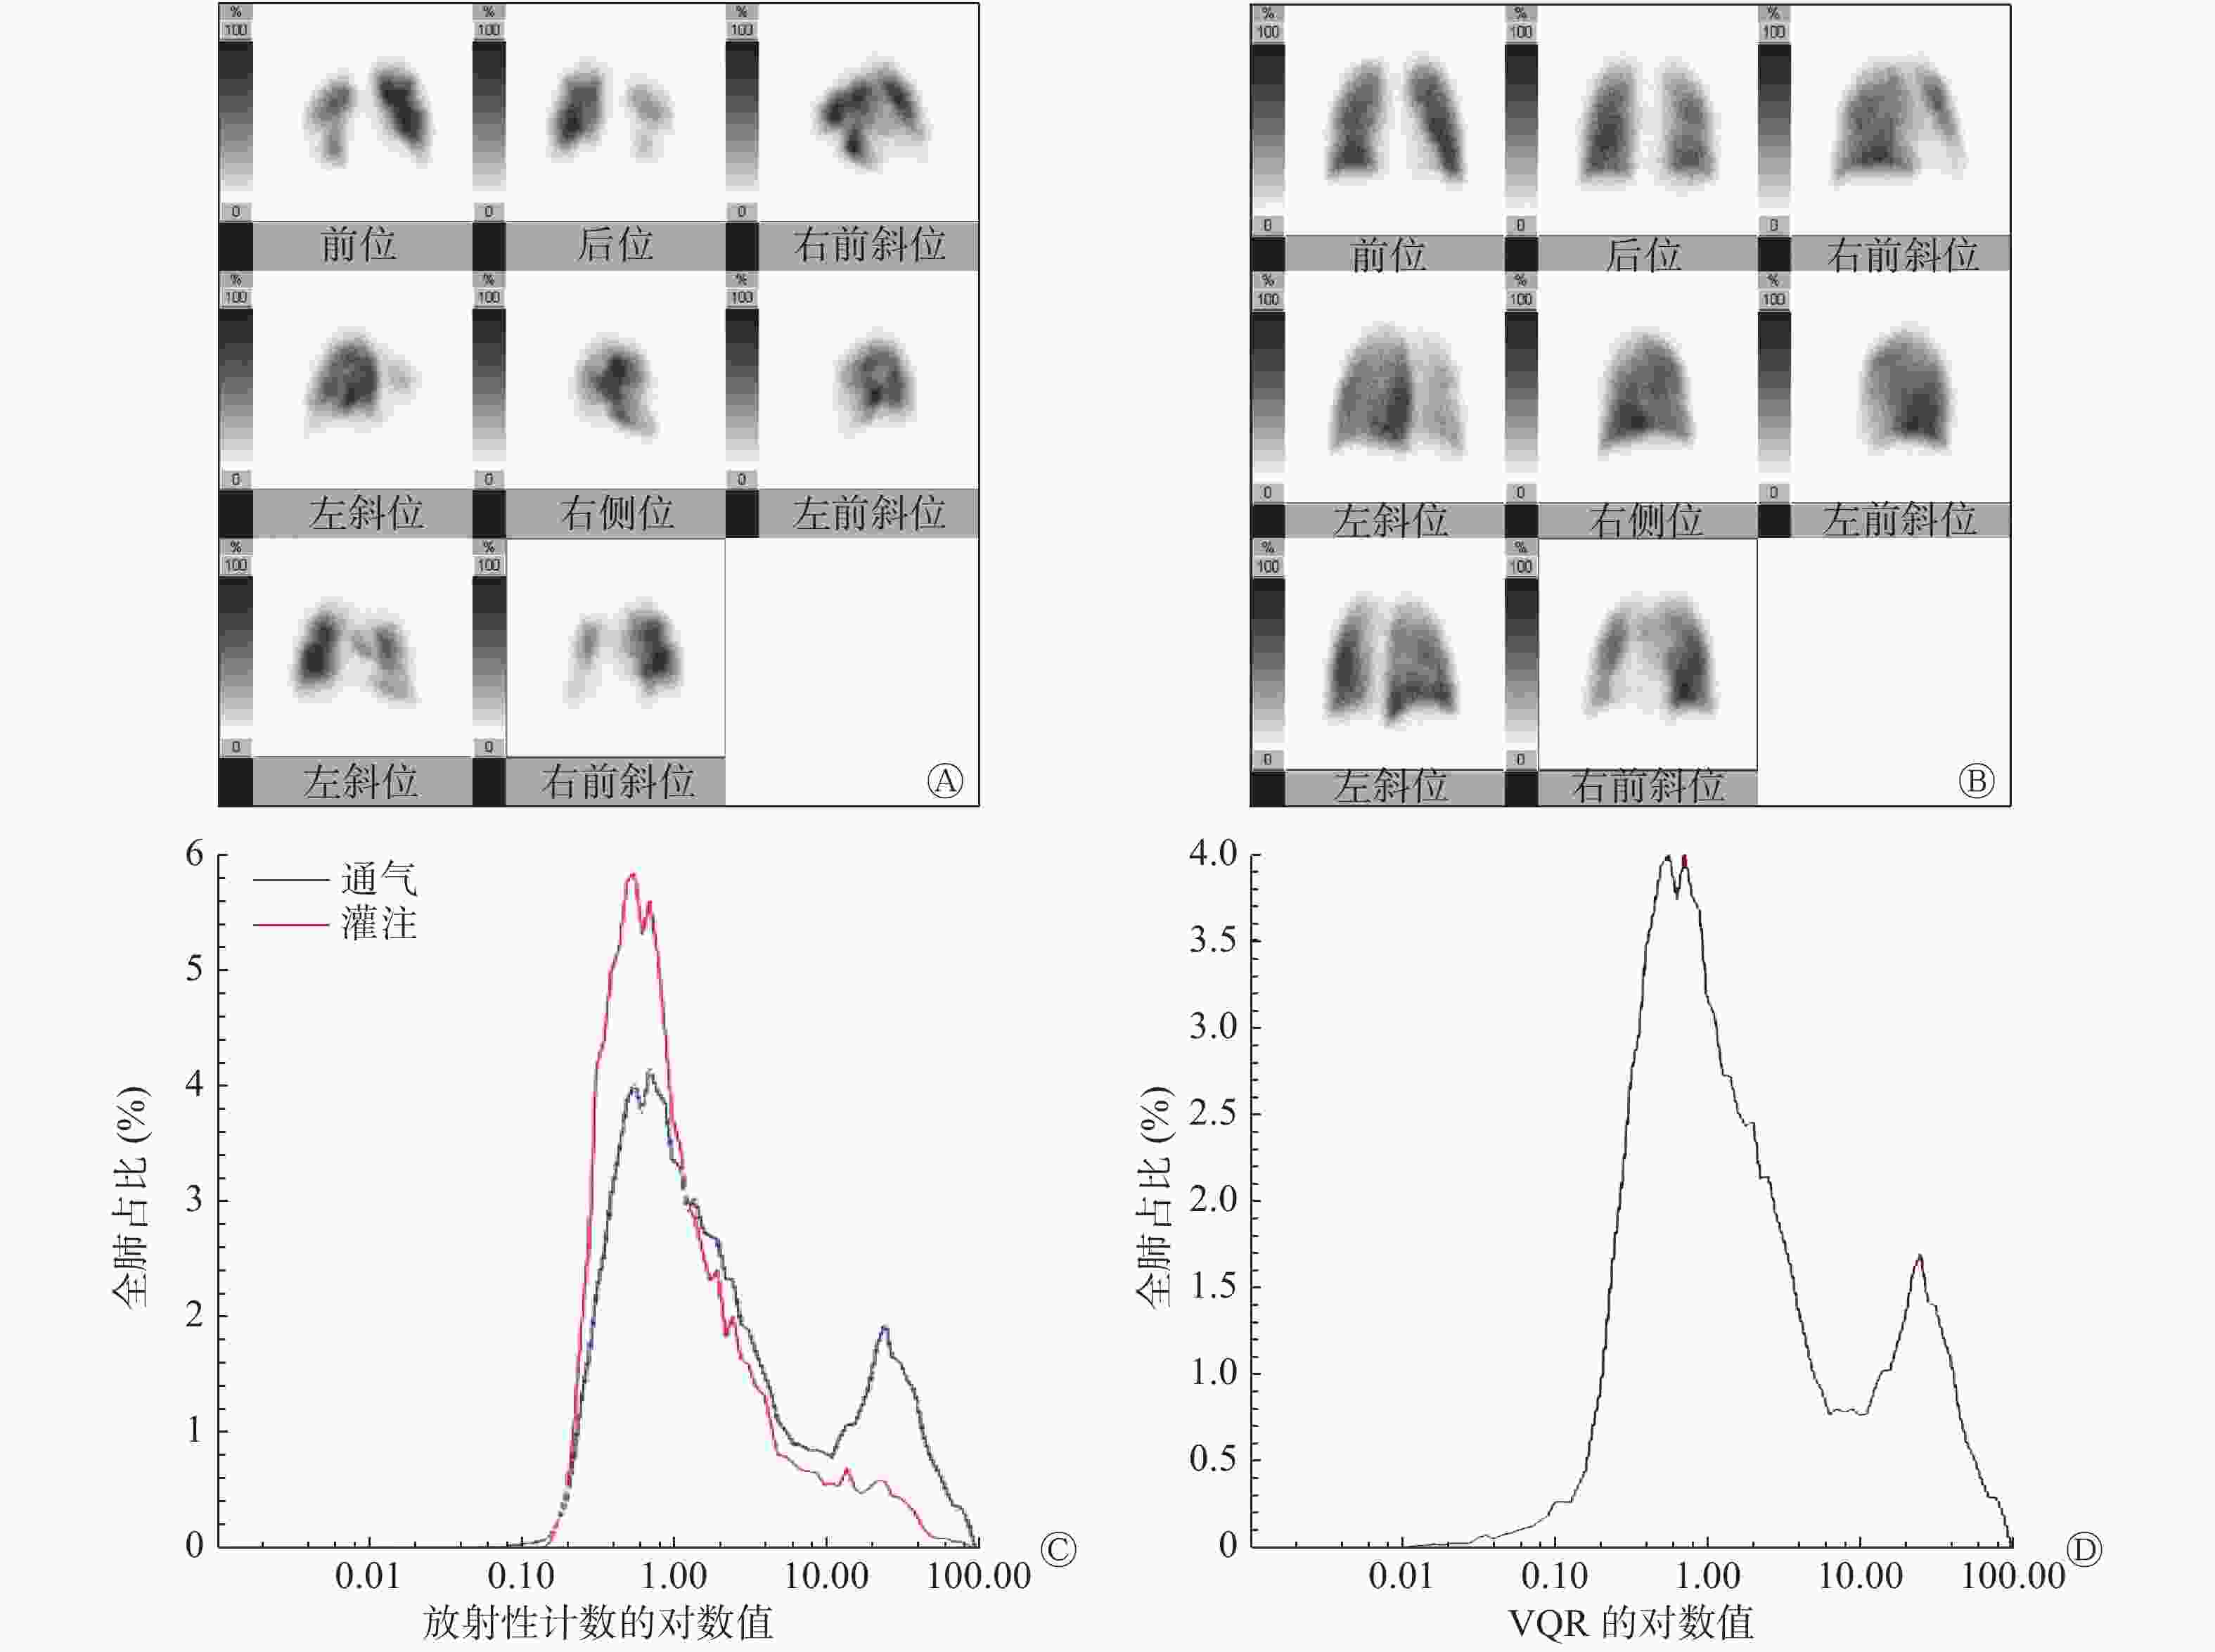
图 2 慢性血栓栓塞性肺动脉高压患者(男性,34岁,肺动脉收缩压为57 mmHg)的肺灌注(A)、通气(B)平面显像图及放射性分布曲线(C、D)
Figure 2. Lung perfusion scan (A), lung ventilation scan (B) and radioactivity distribution curve (C, D) in chronic thromboembolic pulmonary hypertension patient (male, 34 years old)
-
由表2可见,CTEPH组的LogSDVQR、SUVSD分别为0.61±0.15、3.54±1.44;对照组的LogSDVQR、SUVSD分别为0.40±0.14、2.42±0.91,2组间的差异有统计学意义(均P<0.05);与健康对照组相比,CTEPH组的LogSDV、LogSDVQR、全肺灌注的SUVpeak、SUVmax、SUVSD均明显升高,差异有统计学意义(均P<0.05);2组的LogSDQ、SUVmean和SUVmin之间的差异均无统计学意义。CTEPH组的左肺SUVmean、SUVSD较右肺明显增高(均P<0.05);左、右肺的SUVpeak、SUVmax、SUVmin比较,差异均无统计学意义,对照组的左、右肺各项SUV比较,差异均无统计学意义(表3)。
组别 全肺 SUV参数 V/Q 放射性计数 峰值 平均值 最小值 最大值 标准差 LogSDV LogSDQ LogSDVQR CTEPH组(n=20) 19.12±7.94 2.78±1.15 0.002±0.003 20.19±8.30 3.54±1.44 0.56±0.16 0.44±0.09 0.61±0.15 健康对照组(n=13) 10.81±4.05 3.36±2.21 0.011±0.024 11.44±4.33 2.42±0.91 0.31±0.11 0.35±0.16 0.40±0.14 t值 3.48 −0.98 −1.37 3.49 2.50 4.91 1.72 3.89 P值 0.002 0.334 0.197 0.001 0.018 0.000 0.103 0.001 注:表中,SUV:标准化摄取值;V:通气;Q:灌注;CTEPH:慢性血栓栓塞性肺动脉高压;SD:标准差;VQR:V、Q的放射性计数的比值 表 2 2组肺的SUV参数和V/Q 放射性计数的比较(
$\bar {{x}}$ Table 2. Comparison of standardized uptake value parameters and ventilation/perfusion radioactive counts in two groups (
$\bar {{x}}$ SUV参数 CTEPH组(n=20) t值 P 值 健康对照组(n=13) t值 P 值 右肺 左肺 右肺 左肺 峰值 14.12±6.42 18.27±7.88 −1.83 0.075 10.39±4.06 10.23±3.93 0.10 0.919 平均值 2.04±1.23 3.61±2.00 −2.98 0.005 3.42±2.37 3.29±2.05 0.15 0.885 最小值 0.003±0.004 0.005±0.008 −0.95 0.346 0.031±0.066 0.012±0.024 0.98 0.338 最大值 15.25±6.84 19.28±8.29 −1.68 0.102 10.91±4.30 10.78±4.15 0.08 0.937 标准差 2.55±1.44 3.84±1.66 −2.63 0.012 2.42±0.92 2.39±0.91 0.10 0.921 注:表中,CTEPH:慢性血栓栓塞性肺动脉高压;SUV:标准化摄取值 表 3 CTEPH组和健康对照组的右肺、左肺SUV参数的比较(
$\bar {{x}}$ Table 3. Comparison of standardized uptake value of right lung and left lung in chronic thromboembolic pulmonary hypertension group and healthy control group (
$\bar {{x}}$ -
CTEPH组患者的PASP为(72.80±0.15) mmHg。LogSDVQR与PASP呈中等程度相关(R=0.544,P=0.013),SUV各项指标与PASP无显著相关性(均P>0.05,图3)。

图 3 CTEPH患者肺 V/Q分布异质性指标LogSDVQR与PASP的相关性分析
Figure 3. Correlation analysis of lung ventilation/perfusion distribution heterogeneity index LogSDVQR and pulmonary arterial systolic pressure in chronic thromboembolic pulmonary hypertension patients
-
CTEPH是由于急性肺栓塞或肺动脉原位血栓反复发作不能完全溶解、血栓机化和肺动脉内膜慢性炎症并增厚等原因最终发展为慢性肺栓塞,从而导致肺动脉高压。慢性血栓及增高的肺动脉压力均可导致肺通气和血流灌注失衡。CTEPH在肺V/Q SPECT显像上,肺段分布的不匹配仅反映血栓所导致的肺动脉阻塞,并不能全面反映这种肺V/Q分布紊乱,甚至可能会低估肺血管受损的程度和范围。基于SPECT定量软件测量的LogSDVQR和SUVSD等指标可弥补上述不足,为定量评估CTEPH患者肺V/Q放射性分布异质性提供了有效方法。
本研究中,健康对照组的肺V/Q放射性分布曲线呈现对称性单峰状分布,而CTEPH组的肺V/Q放射性分布曲线呈非对称性的多峰分布,具有明显差别,且与国外已往研究结果一致[6]。CTEPH组的LogSDVQR、SUVSD较对照组均显著升高,证明该方法应用于CTEPH的可行性。这种肺V/Q放射性分布的不均一性主要来自栓塞导致的肺段性缺损及肺动脉高压所致的斑片状的缺损。同时,LogSDVQR与PASP呈中等程度相关,这也提示肺V/Q放射性分布不均与肺动脉高压所致的血流动力学的变化有关。本研究结果显示,CTEPH组的全肺SUVpeak和SUVmax较对照组也显著增高,这可能由于CTEPH患者多发性血栓栓塞、阻塞血管和局部血流灌注受阻导致的放射性局部浓聚,而引起摄取峰值和最大值的增高,这也可能与肺段的代偿和过度灌注有关。在CTEPH组患者中,左、右肺的SUVmean、SUVSD也存在差异,左肺的血流分布紊乱较右肺严重,而健康对照组的SUV未见差异,提示CTEPH组患者左、右肺血流灌注的损伤情况不同,这可能与双肺血流生理分布和血栓位置的差异等有关,但目前应用基于SPECT的SUV评价CTEPH患者血流受损情况的研究鲜有,缺乏相关的研究证据。
肺V/Q显像定量分析技术被不断地发展与探索,研究者先后提出了上下肺野放射性计数比法、全肺灌注缺损百分数法和肺血流分布指数等。本研究采用的肺V/Q放射性分布异质性分析是基于多种惰性气体清除试验理论,且依据肺V/Q示踪剂的相对分布情况来进行定量分析[7]。与上述定量方法相比,参数计算完全自动化,具有较好的重复性和稳定性。Harris等[1]也将 LogSDVQR用于肺栓塞的诊断研究,结果显示该方法可减少不确诊结果的数量,提高诊断效能。还有研究将其用于预测肺减容术后和肺癌患者肺切除后的残余肺功能[8-10]。SUV作为PET临床及科学研究中应用较多的半定量分析指标,在肿瘤诊断、分期和预后分析中起着不可替代的重要作用,但易受PET系统性能、采集方式及患者自身状态等一系列的生物和技术因素影响[11],易导致组间及组内的偏倚。基于灌注SPECT测量的全肺SUV,可弥补PET测量SUV中的不足,且更加经济、便捷。Arvola等[5]研究已证实SPECT和PET测量的SUV具有良好的相关性和一致性。但肺V/Q放射性分布异质性方法的不足之处在于对疾病的诊断特异度较差,凡是血流灌注和通气不匹配的情况均可表现出这种分布异质性,如慢性阻塞性肺疾病[12]和间质性肺炎[13]等。
综上所述,肺V/Q放射性分布异质性分析法既能量化评估肺V/Q失衡情况,又与肺动脉压力相关,在CTEPH的诊疗中具有较好的应用前景。
利益冲突 本研究由署名作者按以下贡献声明独立开展,不涉及任何利益冲突。
作者贡献声明 马荣政负责研究命题的提出与设计、数据的获取与分析、论文的撰写与修订;王蒙负责数据的获取与分析、研究过程的实施;方纬负责研究命题的提出与设计;张宗耀负责研究过程的实施;汪蕾负责研究命题的提出与设计、论文的审阅。
慢性血栓栓塞性肺动脉高压患者核素肺通气/灌注分布异质性的初步定量研究
Preliminary quantitative analysis of the distribution heterogeneity of lung ventilation/perfusion in patients with chronic thromboembolic pulmonary hypertension
-
摘要:
目的 研究核素肺通气/灌注(V/Q)SPECT显像在慢性血栓栓塞性肺动脉高压(CTEPH)分布异质性中的应用,探讨分布异质性定量指标与肺动脉压力之间的相关性。 方法 收集中国医学科学院阜外医院2018年2月至12月经右心导管及肺动脉造影确诊的CTEPH患者20例(CTEPH组),其中男性12例、女性8例,年龄(48.75±14.07)岁;13名正常健康者作为对照组,其中男性7名、女性6名,年龄(54.46±8.56)岁。CTEPH组患者和对照组健康者均行肺V/Q SPECT显像及同床位低剂量CT扫描,CTEPH患者在一周内行超声心动检查,估测肺动脉收缩压(PASP)。通过图像重建和分析,获得肺V/Q放射性分布异质性指标LogSDV、LogSDQ和LogSDVQR(SD为标准差;V、Q、VQR分别为通气、灌注的放射性计数及二者的比值)。在CT图像上采用肺CT阈值的方法自动勾画左肺、右肺和全肺的感兴趣区,并将之复制于肺灌注图像上,获得左肺、右肺和全肺的标准化摄取值(SUV),包括SUV的峰值(SUVpeak)、最大值(SUVmax)、最小值(SUVmin)、平均值(SUVmean)和标准差(SUVSD),其中SUVSD代表肺灌注放射性分布的异质性。2组之间的比较采用t检验,分布异质性指标与PASP的相关性采用Pearson相关性分析。 结果 健康对照组的肺V/Q放射性分布曲线呈对称性单峰状分布,而CTEPH组的肺V/Q放射性分布曲线呈非对称性的多峰分布。与健康对照组相比,CTEPH组的LogSDV、LogSDVRQ、全肺灌注的SUVpeak、SUVmax、SUVSD均明显升高,且差异均有统计学意义(LogSDV:0.56±0.16对0.31±0.11,t=4.91,P=0.000;LogSDVQR:0.61±0.15对0.40±0.14,t=3.89,P=0.001;SUVpeak:19.12±7.94对10.81±4.05,t=3.48,P=0.002;SUVmax:20.19±8.30对11.44±4.33,t=3.49,P=0.001;SUVSD:3.54±1.44 对2.42±0.91,t=2.50,P=0.018);而2组的LogSDQ、SUVmean和SUVmin 的差异均无统计学意义。CTEPH组的PASP为(72.80±0.15) mmHg,LogSDVQR与PASP呈中等程度相关(R=0.544,P=0.013)。 结论 核素肺V/Q显像可定量评估CTEPH患者肺V/Q放射性分布的异质性,同时可反映CTEPH患者肺动脉压力的状态。 -
关键词:
- 通气-灌注显像 /
- 高血压,肺性;肺栓塞 /
- 体层摄影术,发射型计算机,单光子 /
- 体层摄影术,X线计算机 /
- 异质性
Abstract:Objective To quantitatively assess the distribution heterogeneity of lung ventilation/perfusion (V/Q) in patients with chronic thromboembolic pulmonary hypertension (CTEPH) and to evaluate the correlation between distribution heterogeneity parameters and pulmonary artery pressure. Methods Twenty CTEPH patients, comprising twelve males and eight females (age, 48.75±14.07 years old), who were hospitalized in Fuwai Hospital, Chinese Academy of Medical Sciences and Peking Union Medical College from February 2018 to December 2018, were confirmed to have CTEPH by means of right heart catheterization and pulmonary angiography. Thirteen controls, comprising seven males and six females (age, 54.46±8.56 years old), were also enrolled. Patients and controls underwent V/Q san and low-dose CT, and echocardiography was performed within 1 week to estimate pulmonary artery systolic pressure (PASP). The heterogeneity indexes of lung V/Q distribution include LogSDV, LogSDQ, and LogSDVQR (V and Q and V/Q are the radioactivity count of ventilation and perfusionand, and its ratio). SD is the standard deviation. The abovementioned indexes were obtained by image reconstruction and analysis. Then, on CT images, the lung CT threshold was used to automatically delineate the boundary of the left lung, the right lung, and the whole lung as the volume of interest, and it was replicated on the pulmonary perfusion images to acquire the standardized uptake value (SUV), including peak of SUV (SUVpeak), maximum of SUV (SUVmax), minimum of SUV (SUVmin), mean of SUV (SUVmean), and standard deviation of SUV (SUVSD). SUVSD represents the heterogeneity of perfusion distribution. The comparation of two groups by utilising t-test. Using Pearson correlation to analyse distribution heterogeneity parameters and PASP correlation. Results The distribution of lung V/Q in the healthy control patients presented a symmetrical unimodal distribution, whereas the distribution curve of lung V/Q in patients with CTEPH presented an asymmetric multi-peak distribution. Compared with the control group, LogSDV, LogSDVQR, total pulmonary perfusion SUVpeak, SUVmax, and SUVSD significantly increased in the CTEPH group. The differences were statistically significant (LogSDV: 0.56±0.16 vs. 0.31±0.11, t=4.91, P=0.000; LogSDVQR: 0.61±0.15 vs. 0.40±0.14, t=3.89, P=0.001; SUVpeak: 19.12±7.94 vs. 10.81±4.05, t=3.48, P=0.002; SUVmax: 20.19±8.30 vs. 11.44±4.33, t=3.49, P=0.001; SUVSD: 3.54±1.44 vs. 2.42±0.91, t=2.50, P=0.018). The differences of LogSDQ, SUVmean, and SUVmin were not statistically significant between the two groups. PASP of CTEPH patients was (72.80±0.15) mmHg. The LogSDVQR was moderately correlated with PASP in patients with CTEPH (R=0.544, P=0.013). Conclusion The lung V/Q scan can quantitatively assess the distribution heterogeneity and reflect the pulmonary artery pressure status of the patients with CTEPH. -
图 1 健康者(女性,63岁)的肺灌注(A)、肺通气(B)平面显像图及放射性分布曲线(C、D)
Figure 1. Lung perfusion scan (A), lung ventilation scan (B) and radioactivity distribution curve (C, D) in healthy people (female, 63 years old)
图 2 慢性血栓栓塞性肺动脉高压患者(男性,34岁,肺动脉收缩压为57 mmHg)的肺灌注(A)、通气(B)平面显像图及放射性分布曲线(C、D)
Figure 2. Lung perfusion scan (A), lung ventilation scan (B) and radioactivity distribution curve (C, D) in chronic thromboembolic pulmonary hypertension patient (male, 34 years old)
图 3 CTEPH患者肺 V/Q分布异质性指标LogSDVQR与PASP的相关性分析
Figure 3. Correlation analysis of lung ventilation/perfusion distribution heterogeneity index LogSDVQR and pulmonary arterial systolic pressure in chronic thromboembolic pulmonary hypertension patients
表 1 2组临床资料的比较
Table 1. Comparison of clinical data between two groups
组别 年龄(岁) 女性/男性(例) 身高(cm) 体重(kg) CTEPH组
(n=20)48.75±14.07 8/12 166.45±7.83 65.25±11.00 健康对照组
(n=13)54.46±8.56 6/7 168.46±9.68 71.69±18.01 检验值 t=−1.31 χ2=0.122 t=−0.66 t=−1.28 P值 0.200 >0.99 0.516 0.210 注:表中,CTEPH:慢性血栓栓塞性肺动脉高压;PASP:肺动脉收缩压  下载: 导出CSV
表 2 2组肺的SUV参数和V/Q 放射性计数的比较(
$\bar {{x}}$ Table 2. Comparison of standardized uptake value parameters and ventilation/perfusion radioactive counts in two groups (
$\bar {{x}}$ 组别 全肺 SUV参数 V/Q 放射性计数 峰值 平均值 最小值 最大值 标准差 LogSDV LogSDQ LogSDVQR CTEPH组(n=20) 19.12±7.94 2.78±1.15 0.002±0.003 20.19±8.30 3.54±1.44 0.56±0.16 0.44±0.09 0.61±0.15 健康对照组(n=13) 10.81±4.05 3.36±2.21 0.011±0.024 11.44±4.33 2.42±0.91 0.31±0.11 0.35±0.16 0.40±0.14 t值 3.48 −0.98 −1.37 3.49 2.50 4.91 1.72 3.89 P值 0.002 0.334 0.197 0.001 0.018 0.000 0.103 0.001 注:表中,SUV:标准化摄取值;V:通气;Q:灌注;CTEPH:慢性血栓栓塞性肺动脉高压;SD:标准差;VQR:V、Q的放射性计数的比值
下载: 导出CSV
表 3 CTEPH组和健康对照组的右肺、左肺SUV参数的比较(
$\bar {{x}}$ Table 3. Comparison of standardized uptake value of right lung and left lung in chronic thromboembolic pulmonary hypertension group and healthy control group (
$\bar {{x}}$ SUV参数 CTEPH组(n=20) t值 P 值 健康对照组(n=13) t值 P 值 右肺 左肺 右肺 左肺 峰值 14.12±6.42 18.27±7.88 −1.83 0.075 10.39±4.06 10.23±3.93 0.10 0.919 平均值 2.04±1.23 3.61±2.00 −2.98 0.005 3.42±2.37 3.29±2.05 0.15 0.885 最小值 0.003±0.004 0.005±0.008 −0.95 0.346 0.031±0.066 0.012±0.024 0.98 0.338 最大值 15.25±6.84 19.28±8.29 −1.68 0.102 10.91±4.30 10.78±4.15 0.08 0.937 标准差 2.55±1.44 3.84±1.66 −2.63 0.012 2.42±0.92 2.39±0.91 0.10 0.921 注:表中,CTEPH:慢性血栓栓塞性肺动脉高压;SUV:标准化摄取值
下载: 导出CSV
-
[1] Harris B, Bailey D, Miles S, et al. Objective Analysis of Tomographic Ventilation-Perfusion Scintigraphy in Pulmonary Embolism[J]. Am J Respir Crit Care Med, 2007, 175(11): 1173−1180. DOI: 10.1164/rccm.200608−1110OC. [2] Bajc M, Chen Y, Wang J, et al. Identifying the heterogeneity of COPD by V/P SPECT: a new tool for improving the diagnosis of parenchymal defects and grading the severity of small airways disease[J]. Int J Chron Obstruct Pulmon Dis, 2017, 12: 1579−1587. DOI: 10.2147/COPD.S131847. [3] Galiè N, Humbert M, Vachiery JL, et al. 2015 ESC/ERS Guidelines for the Diagnosis and Treatment of Pulmonary Hypertension: The Joint Task Force for the Diagnosis and Treatment of Pulmonary Hypertension of the European Society of Cardiology (ESC) and the European Respiratory Society (ERS): Endorsed by: Association for European Paediatric and Congenital Cardiology (AEPC), International Society for Heart and Lung Transplantation (ISHLT)[J]. Eur Heart J, 2016, 37(1): 67−119. DOI: 10.1093/eurheartj/ehv317. [4] 中华医学会放射学分会心胸学组. 低剂量螺旋CT肺癌筛查专家共识[J]. 中华放射学杂志, 2015, (5): 328−335. DOI: 10.3760/cma.j.issn.1005−1201.2015.05.003.
Cardiothoracic Group of Radiology Society of Chinese Medical Association. Low dose spiral CT lung cancer screening experts consensus[J]. Chin J Radiol, 2015, (5): 328−335. DOI: 10.3760/cma.j.issn.1005−1201.2015.05.003.[5] Arvola S, Jambor I, Kuisma A, et al. Comparison of standardized uptake values between 99mTc-HDP SPECT/CT and 18F-NaF PET/CT in bone metastases of breast and prostate cancer[J/OL]. EJNMMI Res, 2019, 9(1): 6[2019-02-27]. https://ejnmmires.springeropen.com/articles/10.1186/s13550-019-0475-z. DOI: 10.1186/s13550-019-0475-z. [6] Suga K, Kawakami Y, Koike H, et al. Lung ventilation-perfusion imbalance in pulmonary emphysema: assessment with automated V/Q quotient SPECT[J]. Ann Nucl Med, 2010, 24(4): 269−277. DOI: 10.1007/s12149−010−0369−7. [7] King GG, Harris B, Mahadev S. V/Q SPECT: utility for investigation of pulmonary physiology[J]. Semin Nucl Med, 2010, 40(6): 467−473. DOI: 10.1053/j.semnuclmed.2010.07.006. [8] Suga K, Kawakami Y, Zaki M, et al. Clinical utility of co-registered respiratory-gated 99mTc-Technegas/MAA SPECT-CT images in the assessment of regional lung functional impairment in patients with lung cancer[J]. Eur J Nucl Med Mol Imaging, 2004, 31(9): 1280−1290. DOI: 10.1007/s00259−004−1558−1. [9] Takenaka D, Ohno Y, Koyama H, et al. Co-registered perfusion SPECT/CT: Utility for prediction of improved postoperative outcome in lung volume reduction surgery candidates[J]. Eur J Radiol, 2010, 74(3): 465−472. DOI: 10.1016/j.ejrad.2009.03.008. [10] Ohno Y, Koyama H, Takenaka D, et al. Coregistered Ventilation and Perfusion Spect Using Krypton-81m and Tc-99m-Labeled Macroaggregated Albumin With Multislice CT: utility for Prediction of Postoperative Lung Function in Non-Small Cell Lung Cancer Patients[J]. Acad Radiol, 2007, 14(7): 830−838. DOI: 10.1016/j.acra.2007.03.013. [11] Brendle C, Kupferschlager J, Nikolaou K, et al. Is the standard uptake value (SUV) appropriate for quantification in clinical PET imaging? —Variability induced by different SUV measurements and varying reconstruction methods[J]. Eur J Radiol, 2015, 84(1): 158−162. DOI: 10.1016/j.ejrad.2014.10.018. [12] Sando Y, Inoue T, Nagai R, et al. Ventilation/perfusion ratios and simultaneous dual-radionuclide single-photon emission tomography with krypton-81m and technetium-99m macroaggregated albumin[J]. Eur J Nucl Med, 1997, 24(10): 1237−1244. DOI: 10.1007/s002590050147. [13] Suga K, Kawakami Y, Koike M, et al. Characteristic crescentic subpleural lung zones with high ventilation (V)/perfusion (Q) ratios in interstitial pneumonia on V/Q quotient SPECT[J]. Nucl Med Commun, 2009, 30(11): 881−889. DOI: 10.1097/MNM.0b013e328330571d. -

 点击查看大图
计量
- 文章访问数: 2812
- HTML全文浏览量: 1670
- PDF下载量: 13


 '/>
'/>